The semiconductor stocks that drove the AI rally have just had their longest losing streak since 2008, according to Reuters. JPMorgan now says the selling may be close to running out of fuel. In the same corner of the market, though, bond investors are charging one of the most prominent AI infrastructure borrowers yields of about 16%. The AI stock sell-off is sending two signals at once, and they do not agree.
Chips matter more to this story than their index weight suggests. JPMorgan estimates that semiconductors account for roughly 20% of all risk capital in global equity markets. That concentration made them the first place hedge funds cut exposure when volatility rose.
In a note published today, 22 October 2026, JPMorgan strategist Nikolaos Panigirtzoglou argued that investor positioning has been cut sharply since mid-September. If you hold AI exposure, or want to, you are probably asking whether a falling AI trade is a buying signal or a warning.
This analysis gives you three lenses for answering that question: sentiment, positioning and funding risk. It also shows where they currently point in different directions.
How far has positioning really been cut, and is it enough?
The selling was fast and broad. According to Reuters, the Philadelphia Semiconductor Index fell about 15.7% over eight sessions through 16 October. Bloomberg data cited by Hedgeweek show the Nasdaq 100 dropped 5.5% in five sessions, its worst week since April 2025.
Panigirtzoglou’s team believes hedge funds and momentum investors have mostly closed their large long semiconductor positions. These momentum investors include commodity trading advisers (CTAs), which are systematic funds that buy or sell according to price trends rather than company fundamentals. Goldman Sachs prime brokerage data, which track the positions of hedge funds that use Goldman for trading and financing, support part of that picture. Goldman recorded the fastest hedge-fund technology de-risking in its records, which began in 2016.
The scale of the reset is clearer against where it started: record hedge fund tech exposure in late May, concentrated in semiconductors and AI software, set up the crowded positioning that later unwound so quickly.
Key statistic Semiconductors make up about 13% of index market capitalisation but about 21% of global equity risk capital, according to figures reported by MarketWatch.
The same Goldman data complicate the clean-capitulation story. Capitulation means sellers give up entirely and exposure is flushed out.
| Indicator | Reported figure | Source | What it suggests |
|---|---|---|---|
| Philadelphia Semiconductor Index | -15.7% over eight sessions | Reuters | Heavy, sustained selling |
| Nasdaq 100 | -5.5% in five sessions | Bloomberg data | Worst week since April 2025 |
| Tech share of Goldman prime book | 23.5%, near 90th percentile of five-year range | Goldman Sachs | Exposure still crowded |
| Hedge-fund net leverage | 48.6%, a one-year low | Goldman Sachs | Risk appetite reduced |
Technology still sits near the top of its five-year range in hedge-fund books. Panigirtzoglou himself acknowledged that some short-term headwinds persist.
The evidence describes substantial de-risking, not a washout. For you, that means the fastest phase of forced selling may be over, but crowded exposure still leaves room for further sudden drops.
When big ASX news breaks, our subscribers know first
Why positioning resets can put a floor under falling prices
Markets sometimes stop falling without any good news. The explanation often lies in who still owns the stock and why they bought it.
A positioning indicator measures how much exposure investors hold to an asset relative to its history. Crowded trades fall faster than lightly held ones because many holders try to exit through the same narrow door. The Bank of England has identified correlated momentum positions and leverage as amplifiers of equity declines, according to reported commentary. The eight-session chip slide shows how quickly systematic flows can deepen a drawdown.
The Bank of England Financial Stability Report warns that an equity shock to AI companies could be amplified by high concentration and correlated momentum positions, a risk that sits uneasily beside any claim that lighter positioning alone makes the trade safe.
Four mechanical channels explain why a reset can slow the fall:
- Fewer forced sellers. Once hedge funds cut leverage, further price drops trigger fewer risk-limit breaches. What stops the selling: there is less borrowed money left to unwind.
- CTA trend reversal. Trend-following funds sell automatically when prices turn down. What stops the selling: once their longs are closed, they have nothing left to sell.
- Momentum-flow exhaustion. Falling prices weaken momentum signals, which prompts more selling. What stops the selling: exposure near neutral breaks the loop, and it can even flip to buying.
- Volatility targeting. Some funds cut exposure when price swings widen. What stops the selling: if volatility settles, they simply stop reducing.
The mechanism has limits in practice. In its commentary on 14-15 October, JPMorgan reported that buy-the-dip demand had weakened and company buybacks had slowed. It also found short interest too low to fuel a strong short-covering rally, which happens when bearish traders buy back shares to close their bets.
What a reset cannot do
Stabilised flows are not a fundamental catalyst. They remove a source of selling; they do not add a reason to buy.
A durable rally needs earnings, cash flow and continued access to financing. This distinction helps you tell a flow-driven pullback from a fundamentals-driven one. The first can fade once sellers run dry, but the second needs the underlying business case to improve.
Can a shaky neocloud funding model really threaten the AI buildout?
That business case leads directly to funding. Here, JPMorgan’s sector-level arithmetic and the credit market’s company-level verdict pull apart.
JPMorgan’s case
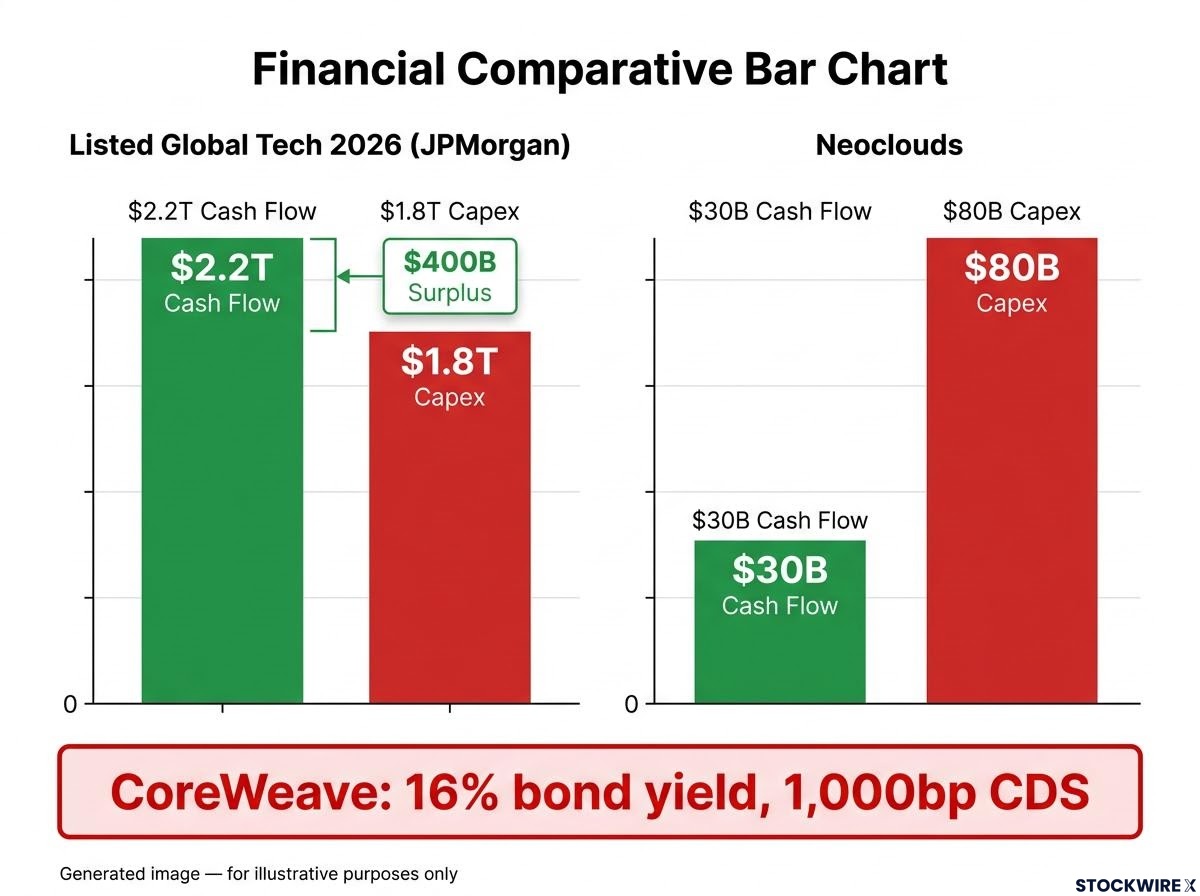
JPMorgan projects that listed global tech companies will generate about $2.2 trillion of cash flow in 2026 against $1.8 trillion of capital expenditure (capex). That leaves a financing surplus of roughly $400 billion. Neoclouds are specialist providers that rent out AI computing capacity. In JPMorgan’s estimates, they generate about $30 billion of cash flow against $80 billion of capex.
The bank’s argument is that neoclouds are a small, non-critical slice of the ecosystem. If their model failed, hyperscalers could take over the buildout. Hyperscalers are the largest cloud operators, with stronger balance sheets and more varied revenue. The sourcing on buybacks is less settled. The original report says the sector issues debt to sustain buybacks, but JPMorgan’s own mid-October commentary pointed to reduced buyback activity during the sell-off. Treat the debt-funded buyback claim with caution.
What credit markets are saying
CoreWeave shows what the aggregate figures hide. According to Reuters, its 2031 bond yield rose to about 16%. Its five-year credit default swap (CDS), a contract that pays out if a borrower defaults, reached about 1,000 basis points. A basis point is one-hundredth of a percentage point, so insuring against default now costs about 10% of the debt each year.
| Group | Cash flow | Capex | Funding signal |
|---|---|---|---|
| Listed global tech (2026, JPMorgan) | $2.2T | $1.8T | About $400B surplus |
| Neoclouds (JPMorgan) | $30B | $80B | Large external funding gap |
| CoreWeave (as reported) | Not stated in cited reporting | $35-39B (2026) | Bond yield about 16%; CDS about 1,000bp |
CoreWeave’s interest expense reached a reported $558M in Q2 2026, about 22% of revenue. The Economist puts neocloud group borrowings at about $100 billion, roughly three times annual revenue.
CoreWeave’s debt risk looks sharper once return on capital is set against borrowing costs: HSBC’s estimate of an 8.9% average return for 2026-30 sits well below the 15-16% the market now charges to lend.
Whether the capex cycle survives is a separate question from whether individual neocloud shareholders and bondholders survive. JPMorgan’s point is about the first question. Do not read it as a safety signal for the most leveraged names.
What the sceptics see that positioning data cannot
The earlier sections lean tactical and cautiously hopeful. Official institutions are focused on structural risk.
The Bank of England, citing Morgan Stanley, reported global AI-related debt issuance of about $450 billion by early September. That is more than twice the 2025 total. Both the Bank and the IMF have warned about circular financing, where tech firms fund AI providers that then buy the financiers’ own products. Demand can look stronger than independent end-user revenue justifies. Bank for International Settlements (BIS) researchers add that specialised assets face fire-sale risk in a bust.
The IMF reviewed 14 transactions and found about $300 billion of equity, $650 billion of debt and $1.4 trillion of future revenue commitments.
Reported debt also understates the burden: hyperscalers’ off-balance sheet obligations, including non-cancellable commitments and uncommenced leases, exceed $2.6 trillion against roughly $700 billion of reported debt.
The IMF’s warning The fund described a potential “triple whammy”: falling equity values, stress in servicing debt and revenue promises that fail to materialise.
The contagion channels include refinancing difficulty, weaker collateral, fewer chip and data-centre orders and impairment of specialised assets. Rates add another layer. Higher inflation or bond yields raise the discount rate applied to long-dated tech earnings and push up data-centre financing costs.
JPMorgan’s earlier tone was more guarded. Its 14-15 October commentary said AI stocks did not yet look oversold on positioning or flow measures. That makes today’s note a call for slowing declines, not an imminent rebound.
Positioning can tell you when forced selling is fading. Only earnings, funding access and returns on AI spending can tell you whether the trade deserves to recover. These signals are worth monitoring:
- Residual positioning in Goldman and JPMorgan data
- Buy-the-dip demand and buyback activity
- Neocloud bond yields and CDS levels
- Hyperscaler capex guidance
- Inflation and bond yields
These assessments are speculative and subject to change as market conditions and company performance evolve.
What the reset changes, and what it leaves unresolved
JPMorgan’s strongest claim is tactical. With hedge funds and CTAs having cut semiconductor exposure, mechanical selling may have less room to accelerate. Lighter positioning does nothing to resolve leverage, circular financing or neocloud credit stress, which the Bank of England, IMF and BIS have all flagged.
Apply the three lenses together. Sentiment tells you how investors feel, positioning tells you who is left to sell and funding tells you whether the buildout can be paid for.
Some signals would support JPMorgan’s view: residual exposure falling towards average, dip-buyers returning and CoreWeave’s yields easing. Others would undermine it, including widening neocloud CDS, trimmed hyperscaler capex guidance or rising bond yields.
This article is for informational purposes only and should not be considered financial advice. Investors should conduct their own research and consult with financial professionals before making investment decisions. Past performance does not guarantee future results. Financial projections are subject to market conditions and various risk factors.