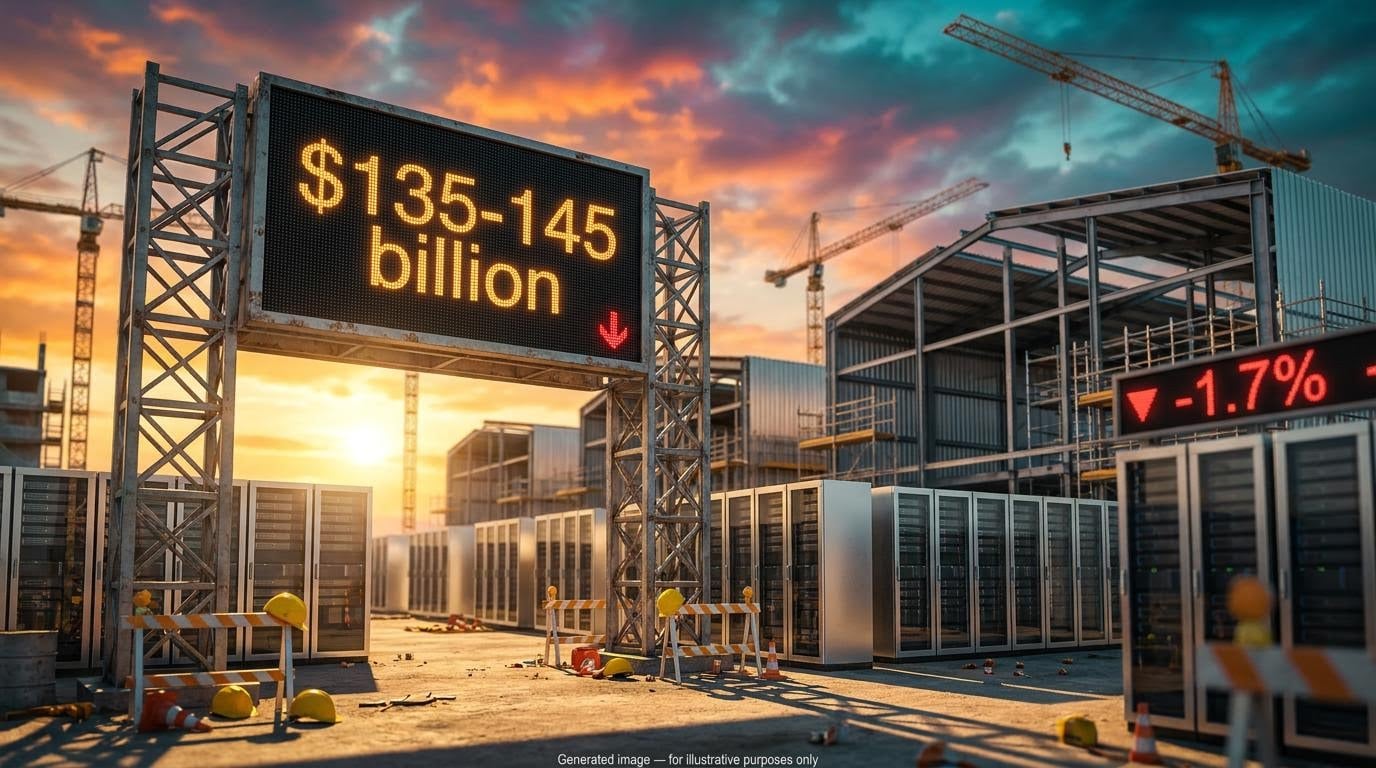
Meta’s third-quarter revenue came in at $64.6 billion, up 26%, and its fourth-quarter guidance topped Wall Street estimates. Yet by Thursday’s premarket session, Nasdaq 100 futures were down roughly 1.7%. The market is no longer grading AI spenders on earnings alone, and Meta’s capex and AI spending now sit at the centre of that shift.
Three developments frame the reaction. Meta narrowed its 2026 capital expenditure range to $135-145 billion, announced a new nonvoting share class, and reported against a backdrop of rising borrowing costs across the AI sector.
If you hold Meta, an index fund or any large technology name, how you weigh spending against returns now shapes your exposure more than the quarterly headline does.
Here is a practical way to judge whether this spending is building lasting capacity or simply burning cash.
What did Meta’s third quarter actually show beneath the headline beat?
What held up
The advertising engine had a strong quarter. Meta Platforms reported revenue of $64.601 billion on 21 October 2026, ahead of the $63.37 billion consensus. Advertising contributed $63.061 billion of that total.
The growth came from both volume and price. Ad impressions rose 10% and the average price per ad climbed 14%, which means more ads were served and each one was worth more. Management then guided fourth-quarter revenue to $73-76 billion, with the top of that range above analyst expectations.
What got squeezed
The cost side tells a different story.
| Metric | Q3 2026 | Q3 2025 |
|---|---|---|
| Revenue | $64.6B | Up 26% year over year |
| Operating income | $13.0B | Down 37% year over year |
| Operating margin | 20% | 40% |
| Capital expenditure | $34.9B | $19.4B |
Operating margin, the share of revenue left after operating costs, halved. Part of that came from a one-off charge of about $10 billion tied to a youth-safety settlement. This is why some coverage cites adjusted earnings per share of roughly $7.40, although reported GAAP EPS was $3.83.
Stripping out the one-off legal charge still leaves adjusted operating margin near 35%, well below last year’s 40%, which suggests part of the squeeze reflects a lasting cost trend rather than settlement noise.
Strip out the legal charge and the spending pressure remains. Quarterly capex nearly doubled, Meta raised the low end of its full-year range from $130 billion, and it gave no 2027 capex or expense guidance.
The ad business is clearly funding the buildout today. The question for you is not whether Meta can afford this spending, but whether it will earn a return on it.
When big ASX news breaks, our subscribers know first
Why does debt-funded AI spending raise the bar for returns?
That return question gets harder when borrowed money enters the picture. Return on invested capital (ROIC) measures how much profit a company earns on the money it puts into its business. When spending grows faster than revenue, ROIC tends to fall unless the new assets eventually pay off.
Four pressure points explain why investors are uneasy:
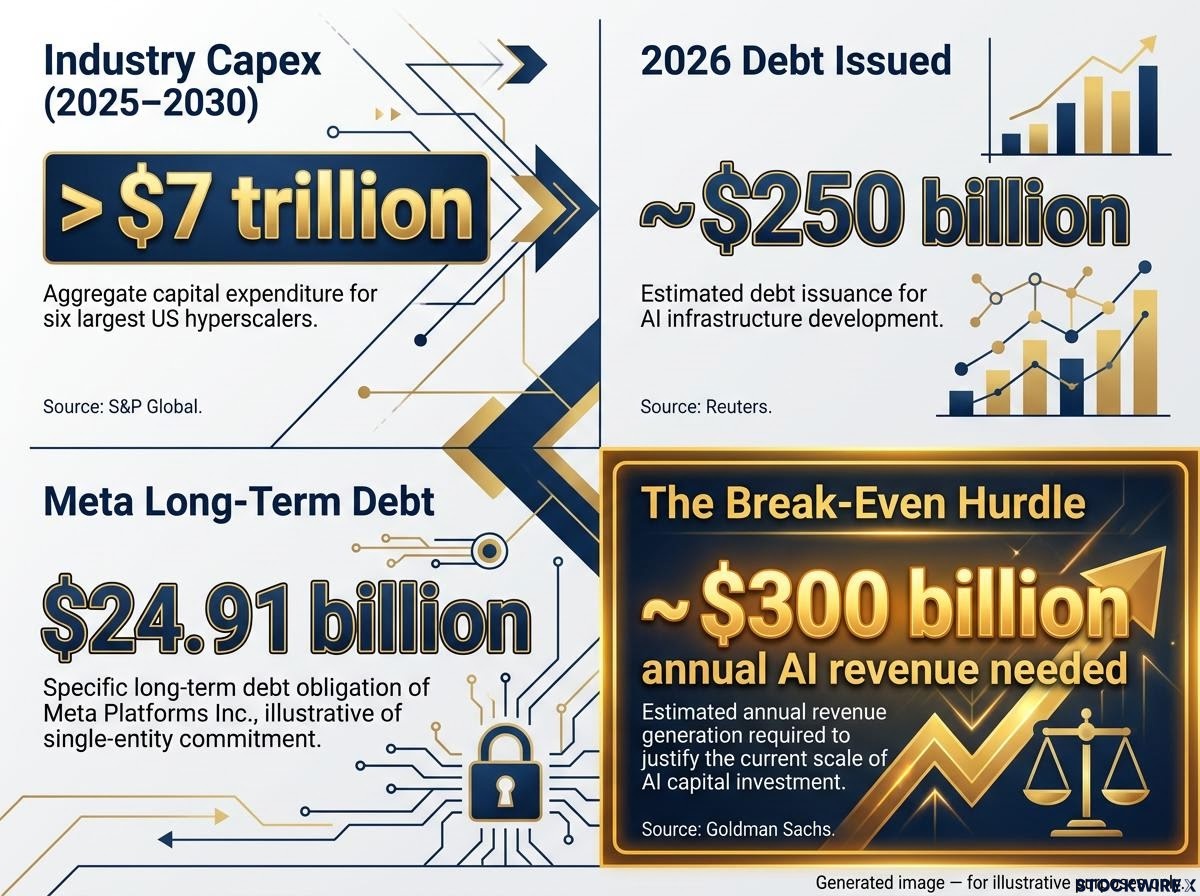
- Borrowing costs. Interest expense raises the operating profit needed to earn an acceptable return. Reuters reported that hyperscalers issued roughly $250 billion of debt in 2026, and Meta reportedly raised $24.91 billion of long-term debt.
- Depreciation timing. Depreciation is the accounting cost of an asset wearing out over its useful life. Servers and data centres depreciate whether or not demand shows up, which compresses margins early.
- ROIC erosion. If capacity grows faster than profits, returns fall even as revenue rises.
- Circular financing. AI companies, chipmakers and cloud providers can fund one another, producing reported revenue that does not prove end customers are generating profitable AI cash flow.
The scale is large. S&P Global projects more than $7 trillion of data-centre and AI capex by the six largest US hyperscalers from 2025 through 2030.
Barclays expects hyperscaler capex to absorb 85-90% of combined operating cash flow through 2028, a structural funding shortfall that helps explain why debt issuance across the sector is running well above historical norms.
The break-even hurdle Goldman Sachs estimates hyperscalers need about $300 billion of annual AI revenue over the next several years just to break even.
Chuck Carlson of Horizon Investment Services argues that higher capital costs make the expansion more expensive and lift the returns required. Kevin Shea of BNY Wealth frames the core test as whether profitability can grow faster than capex.
Reuters has drawn comparisons with the late-1990s dot-com boom, while noting investors remain calmer because today’s hyperscalers generate real profits. The catch is that the future profits required are also enormous.
What this tells you is that a company can post record revenue and still destroy value if the return on new capacity falls below its cost of capital. That is the test worth applying to every AI earnings report.
Can Muse and the Class C shares close the gap?
Muse: early traction, unproven revenue
Meta’s clearest candidate for returns beyond advertising is Muse, the personal AI agent it launched on 8 September 2026. Downloads passed 2.5 million, and the app reached No. 1 on Apple’s US App Store. Speaking to analysts after the results, Mark Zuckerberg put daily use at roughly one in four of those who have set Muse up, with shopping the main draw.
Then came the friction. Amazon blocked Muse from searching and buying on Amazon.com, saying it never approved the access, and some other sites have done the same. A shopping agent that cannot reach major retailers has a narrower revenue path.
| Source | Estimate | Timeframe | Basis |
|---|---|---|---|
| Truist Securities | $28.5B | By 2030 | Incremental Muse revenue |
| Deutsche Bank (base) | $2.4B | By 2030 | Muse revenue, base case |
| Deutsche Bank (bull) | About $36B | By 2030 | Muse revenue, bull case |
| Morningstar | Up to $40B | By 2030 | Renting excess data-centre capacity |
A fifteen-fold gap between Deutsche Bank’s base and bull cases shows how little anyone knows. Meta has disclosed no Muse revenue, subscriber count or transaction economics. Morningstar separately forecasts roughly 22% annual sales growth over five years. You should treat these numbers as scenarios, not guidance.
What the nonvoting shares change
Meta’s board also approved Class C common stock, which carries no votes. Holders will receive one Class C share for every existing Class A and Class B share, effective January 2027.
The stated purposes are AI funding, employee compensation and acquisitions. Zuckerberg keeps about 61% voting control, so governance stays the same. No AI-specific debt facility has been identified alongside it.
Read the Class C shares as added financing flexibility rather than a confirmed sale. Control stays put, but if Meta later issues or sells these shares in volume, your economic stake could be diluted.
Why did futures fall when Meta and other AI earnings were strong?
The sequence matters here. Wall Street closed higher on Wednesday after strong results from SpaceX and Super Micro Computer eased worries about the AI trade. Meta then rose roughly 2-3% in extended trading on its beat and guidance.
Overnight, the mood turned. As of 03:08 ET on Thursday, 22 October 2026, Investing.com reported:
- S&P 500 futures: down 75 points (1.0%)
- Nasdaq 100 futures: down 510 points (1.7%)
- Dow futures: down 283 points (0.5%)
Earlier reports showed smaller declines, with Nasdaq 100 futures down 0.7-1.6% and S&P 500 futures down 0.4-0.9%, reflecting different reporting times. The direction stayed consistent: one company was rewarded while the index was marked down.
Deutsche Bank’s read Deutsche Bank analysts suggested the drop in Nasdaq futures may indicate some investors remain unconvinced. Its strategists separately argued the rotation into technology has gone too far.
Unease over the sector has grown across several sessions, linked to infrastructure projects paid for with borrowed money and costly financing.
Index-level moves also reflect tech concentration: with technology near 37.5% of the S&P 500, above the dot-com peak, any multiple compression in mega-cap AI names hits index funds harder than in past drawdowns.
| Institution | Stance | Key reasoning |
|---|---|---|
| JPMorgan (Brian Anmuth) | Concerned | Projects 2027 capex of about $202B and negative free cash flow in 2026-2027 |
| Goldman Sachs | Industry hurdle | About $300B of annual AI revenue needed to break even |
| Bank of America | Cautious | No large cloud business selling AI capacity directly |
| Mizuho | Uncertain | Route to monetising frontier models unclear |
| Piper Sandler (Thomas Champion) | Previously negative | Earlier capex rise overshadowed top-line growth |
This tells you good earnings are now necessary but not sufficient. Index-level moves reflect a financing and return debate across the sector, and Meta’s after-hours gain does not settle it.
How can you weigh Meta’s spending against its returns?
The debate splits into two camps, and each has evidence on its side.
| View | Who holds it | Supporting evidence | What would confirm it |
|---|---|---|---|
| Structural | Morningstar, Truist | AI as a platform shift like cloud; ad gains already visible | Muse revenue, capacity rental income |
| Cyclical | JPMorgan, Piper Sandler, BofA, Mizuho | Competitive arms race with heavy depreciation and debt | Falling free cash flow, idle capacity |
Precedent cuts both ways. Cloud computing needed heavy upfront spending before utilisation matured, and Meta has tolerated years of Reality Labs losses. Unlike the metaverse, though, AI is already lifting core ads through higher impressions and pricing.
The weakness is concentration. Ads made up about $63.1 billion of $64.6 billion in Q3 revenue, and Bank of America notes Meta lacks a cloud arm to rent capacity directly. Reuters also expects hyperscalers to spend more on capex than they generate in free cash flow by 2027.
Six indicators can show you which camp is winning:
- Muse disclosures: any revenue, subscriber or transaction data from Meta.
- Ad impressions and pricing: whether the 10% and 14% gains hold.
- Free cash flow: Q2 capex of about $31.1 billion left only $784 million of free cash flow.
- Depreciation: the recurring cost, unlike the one-off $10 billion legal charge.
- Class C usage: whether shares are sold, granted or used in deals.
- Access barriers: whether more retailers follow Amazon in blocking Muse.
The investment case hinges on whether AI earns returns beyond ad improvements. These disclosures over the next few quarters are where that answer will appear.
For readers wanting a structured valuation approach, our dedicated guide to valuing Meta stock across three lenses shows why a modest PEG ratio can mislead during a heavy capex cycle.
What the beat settles, and what it leaves open for investors
The quarter confirmed that Meta’s advertising business can carry this buildout for now. It did not confirm that $135-145 billion of annual spending will earn more than it costs once depreciation and borrowing are counted.
Your next decision points are clear. Watch the fourth-quarter results for any 2027 capex guidance, look for the first hard Muse monetisation figures, and track how Meta uses its Class C shares once they take effect in January 2027. Each will tell you whether the structural or cyclical reading is gaining ground.
Until then, strong earnings and a falling market can coexist, and you should expect that tension to persist.
This article is for informational purposes only and should not be considered financial advice. Investors should conduct their own research and consult with financial professionals before making investment decisions. Past performance does not guarantee future results. Financial projections are subject to market conditions and various risk factors.
—