
October’s inflation report came in hot, WTI crude is trading near $99.48 a barrel, and by the usual logic yields and the dollar should be climbing. They are not. The 10-year Treasury yield has slipped from roughly 5.33% to about 5.08%, and the dollar headed for its first weekly decline after four weeks of gains. That combination points to growth risk across stocks and bonds, not a simple inflation story.
US indexes are consolidating after a sell-off that began around 28 August, when Fed chair Kevin Warsh delivered a hawkish Jackson Hole speech. Tesla and Meta report after the close on 21 October, a day after Netflix and SpaceX released their results.
Bonds, currencies and GDP data will shape how the market reads those numbers. Here is what the cross-asset evidence suggests investors are actually worried about, and what changes for your portfolio if Fed pricing shifts.
Why are falling yields and a weak dollar signalling growth fear rather than inflation?
An inflation shock has a familiar shape: yields rise, the dollar firms and gold struggles. Since early October, markets have done close to the opposite.
The 10-year yield spiked to about 5.33% after the hot inflation report, then reversed as tech stocks sold off. The dollar index (DXY), which measures the dollar against a basket of major currencies, fell 0.21% on 16 October. The pound, Australian dollar and Canadian dollar have rallied, and gold has held its ground despite oil and CPI.
| Asset | Level | Recent move | What it suggests |
|---|---|---|---|
| 10-year Treasury yield | About 5.09% (Schwab, 16 Oct) | Down from roughly 5.33%, about 16 bp below the high | Investors buying safety and pricing weaker demand |
| Dollar index (DXY) | Exact level not available | -0.21% on 16 Oct; first weekly fall after four gains | Easing expectations outweighing inflation fears |
| Gold | $4,142.60/oz (another source: $4,165.40 intraday) | Holding despite oil and hot CPI | Support from lower yields and a softer dollar |
| WTI crude | $99.48/bbl | Up 10.9% on the week; Brent above $105 | Energy shock that could squeeze household incomes |
Equities fill in the rest of the picture. The Russell 2000 has not rebounded with lower yields, which Millius Spac, head of global macro at Tasty Live, reads as a hint that growth damage may already be done. The Nasdaq failed to recover a broken wedge near 30,000, which now acts as resistance.
Reuters coverage described investors buying Treasuries and trimming dollar exposure despite the inflation data. JPMorgan Asset Management read the later bond rally as concern that the rate path would weaken growth. When bonds rally and the dollar slips with oil near $100, the market is telling you it fears weaker demand and eventual easing more than lasting inflation, a regime that tends to reward defensive positioning over simple “rates higher” trades.
Bond market recession signals are flashing in an unusual form: a steep-front, flat-back curve has appeared only about 5.4% of the time since 1990, and it has clustered around periods of economic stress.
The case against the growth-scare reading
The key tension: The 10-year yield remains near 5%, and S&P Global still tracks Q3 growth close to 4% annualised.
Other explanations fit the same moves. Safe-haven buying during the tech sell-off, expectations that oil keeps the Fed on hold at high rates, and technical repositioning after the earlier bond rout could all lower yields. Strong GDP and retail sales data also argue against a slowdown.
The evidence is mixed, and the growth reading remains an inference rather than a proven conclusion.
When big ASX news breaks, our subscribers know first
How can an oil price shock turn from inflationary to disinflationary?
Hot CPI and growth fear can sit together because oil works through the economy in stages. The mechanism is an income shock, meaning a hit to the money households have left after essential costs.
- Higher oil raises gasoline, transport, heating and input costs.
- Households spend more on energy and less on discretionary items.
- Businesses face higher costs and weaker sales.
- Margins, hiring and capital expenditure weaken.
- Slower demand eases medium-term inflation pressure.
A supply shock is a price rise caused by reduced availability, such as oil disruption, and it lifts headline inflation first. A demand shock is a fall in spending, and it lowers inflation over time as weaker real incomes bite.
The geopolitical backdrop explains why analysts now treat oil as a structural inflation risk, with transmission running from energy costs to logistics to consumer prices and hitting import-dependent economies hardest.
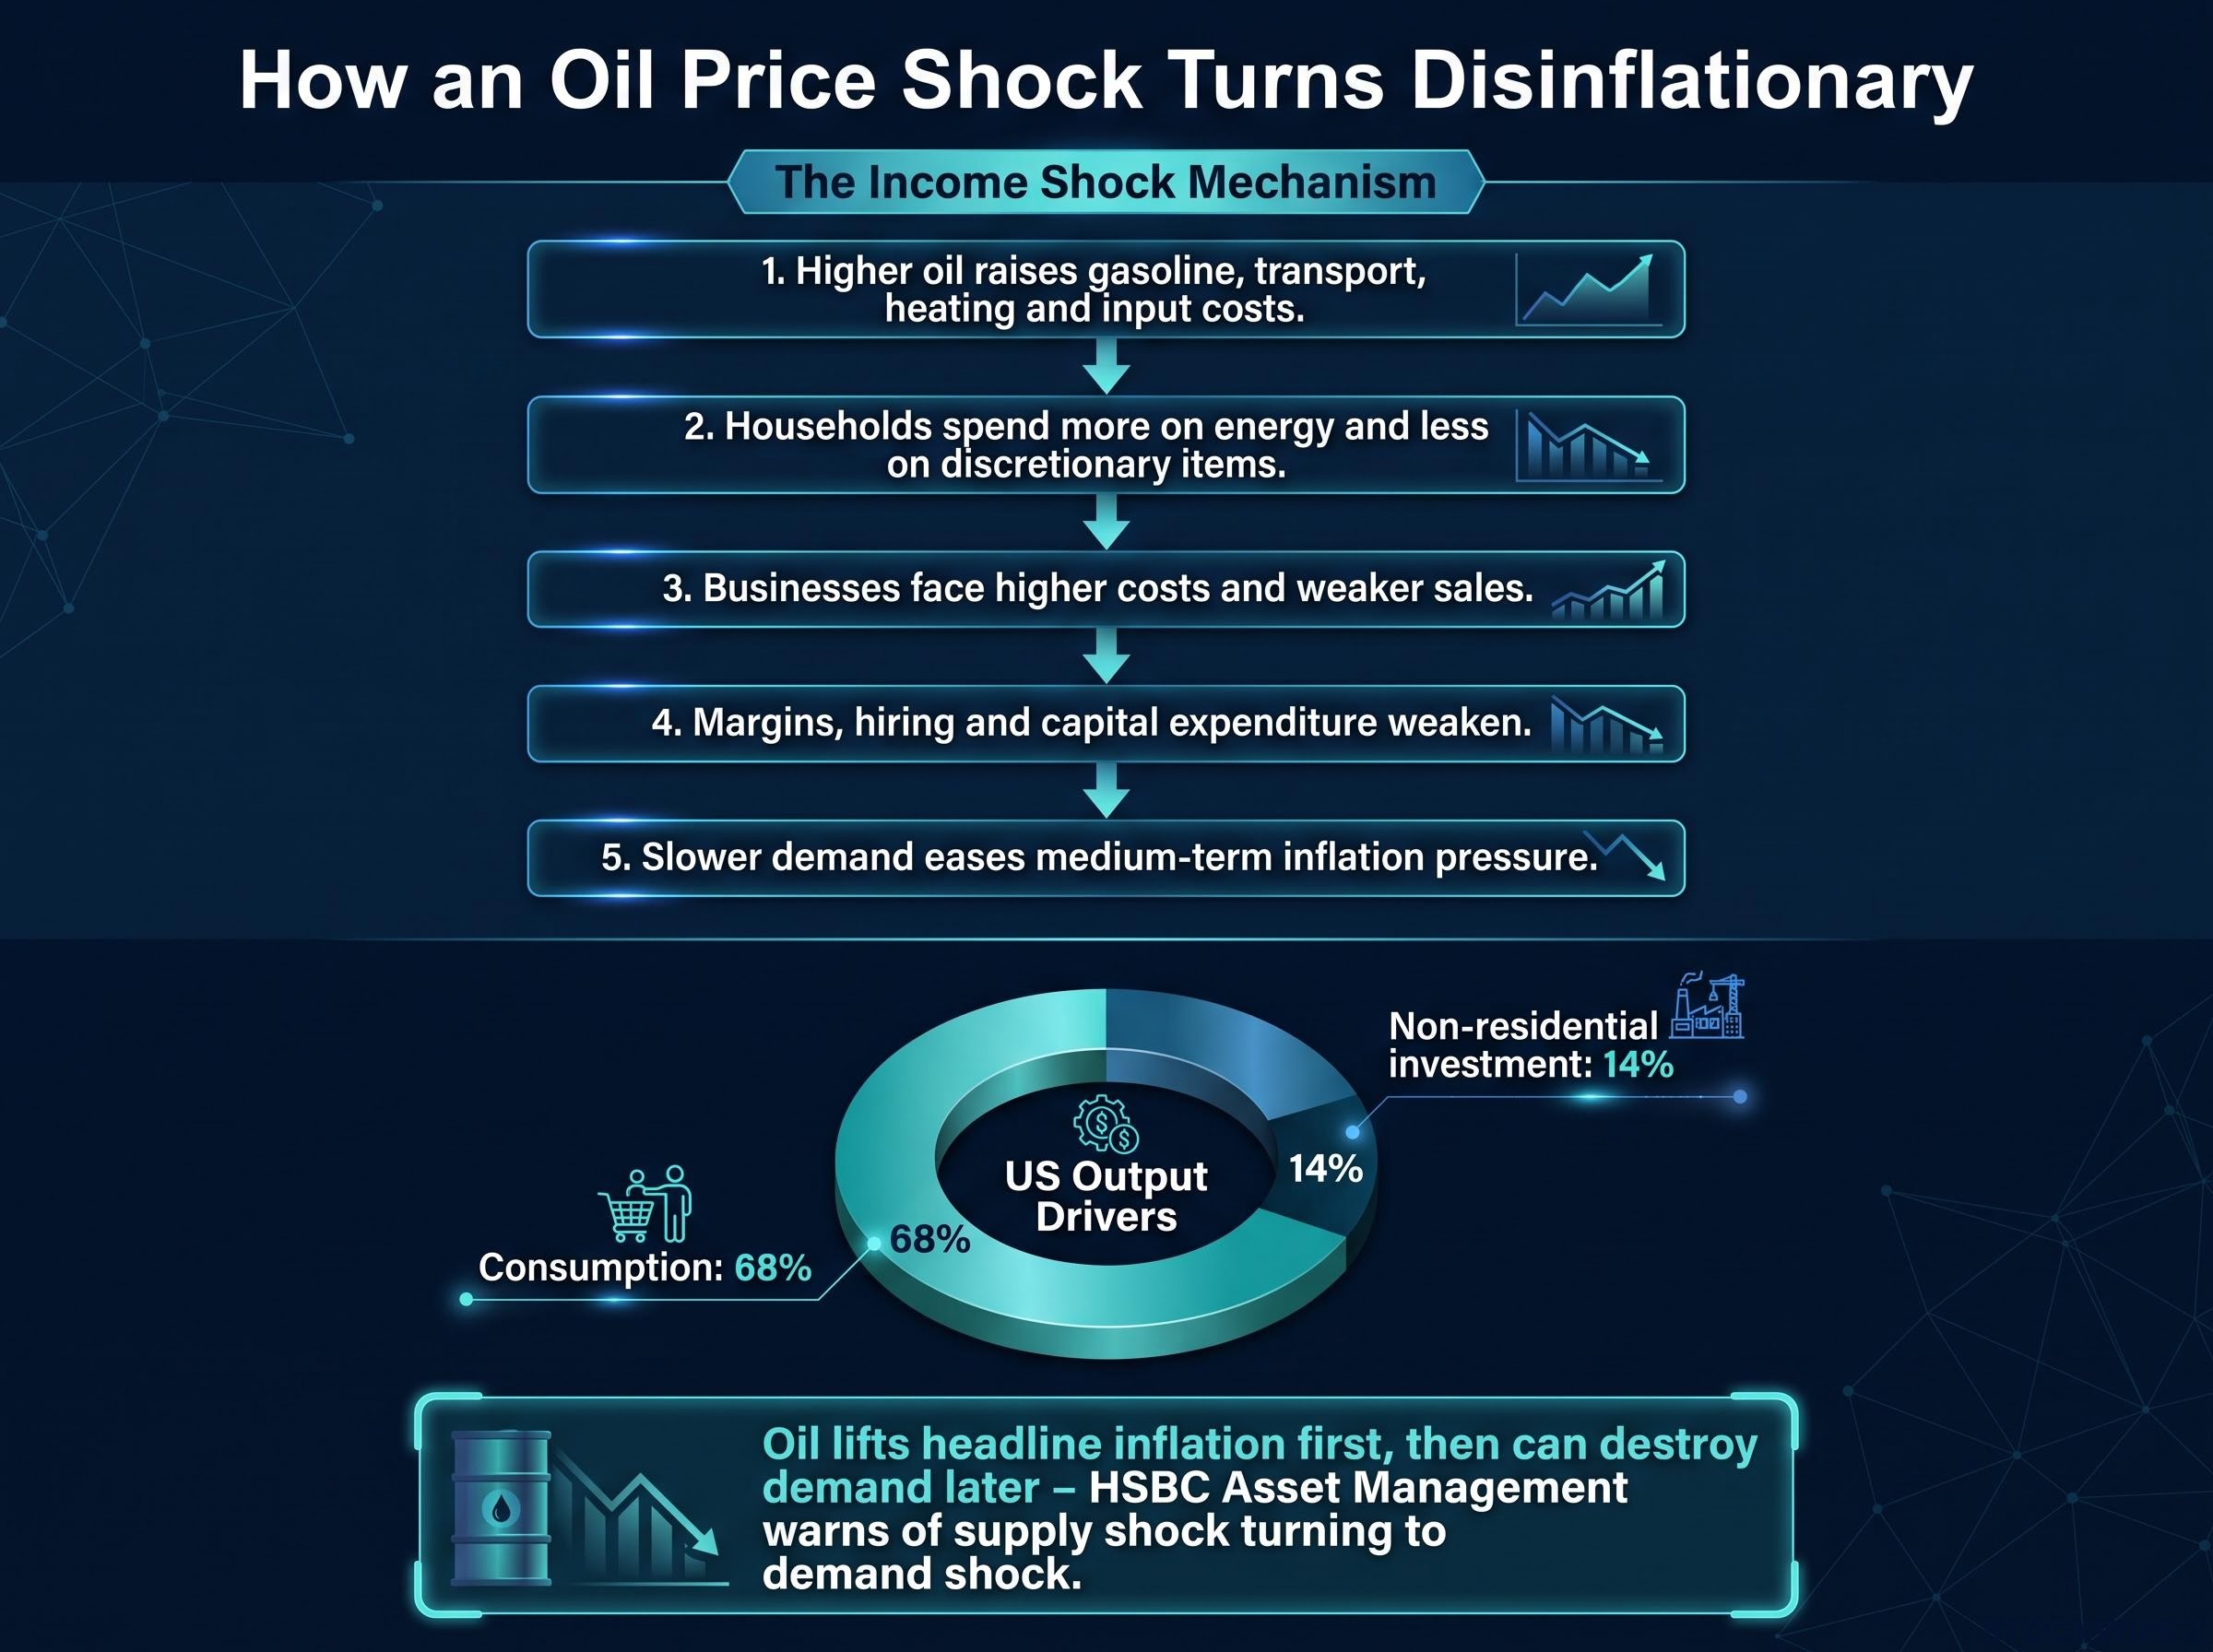
The sequence in one line: Oil lifts headline inflation first, then can destroy demand later.
HSBC Asset Management has warned that prolonged geopolitical disruption could turn an oil supply shock into a demand shock by eroding real incomes and confidence. Its more resilient scenario has AI investment continuing but slowing, with non-AI investment and income-supported consumption taking over as growth drivers.
The stakes are clear when you look at the economy’s makeup. Consumption accounts for about 68% of US output, while non-residential investment is about 14%. The same oil price that pushed up your inflation expectations could, if it persists, weaken the earnings and consumer data that drive stocks, which makes oil a growth variable as much as an inflation one.
Is the strength in GDP data hiding a fragile mix of growth?
The headline looks comfortable. The Atlanta Fed GDPNow model put Q3 growth at 3.5% annualised on 20 October, down from 3.6% on 15 October, and S&P Global’s tracking estimate sits close to 4%.
Read with care: GDPNow is a running model estimate, not an official Atlanta Fed forecast. It can change materially before the official release on 29 October.
The direction matters more than the level. The 15 October update revised consumption higher but trimmed the inventory contribution, and Spac argues incoming data since mid-August has mostly been negative for GDP. PMIs, surveys of purchasing managers that track business activity, have so far been very strong, which keeps the signal split.
The bigger question is what is carrying growth. Three composition risks stand out:
- Funding source of consumption: Spending backed by income is durable, but spending funded by falling savings, credit or asset gains is far more vulnerable.
- AI concentration: AI-related business investment can make GDP look strong while concentrating growth in a narrow group of firms.
- Investment reversal risk: Rapid capex growth can reverse if financing costs rise, AI returns disappoint or tech firms cut spending.
The Fed’s Beige Book flagged the World Cup as a Q2 consumption tailwind, and markets want to know whether that boost has faded without replacement. If Q3 resembles Q1, led by investment such as AI data centres rather than households, Spac views the growth as fragile.
A strong number driven by a narrow group of AI investors leaves the economy exposed to a single funding or sentiment reversal. When the advance GDP figure lands at 8:30 a.m. ET on 29 October, the consumption detail will tell you more than the topline.
What happens to stocks, bonds, gold and the dollar if the Fed is pushed toward the market’s view?
Usually traders bet on cuts that the Fed resists. This time, markets are pricing more hikes than the Fed itself projects.
Where Fed projections and market pricing diverge
- Fed (September projections): Target range 3.75%-4.00%; median year-end 2026 rate 4.1%, implying one more hike; 2027 median also 4.1%; only 8 of 18 officials expect another 2027 hike.
- Markets: One more hike by end-2026 and two more by end-2027, according to JPMorgan Asset Management. Spac cites March and June 2027 hikes totalling 50 bp.
- Next meeting: Spac puts hold odds at about 82-83% for 27-28 October, implying roughly 17-18% for a hike, with December nearly fully priced.
Other reporting described October hike odds as meaningful but subdued after the Treasury rally. Either way, the gap between the Fed and the market is the variable to watch, and the reason it closes matters more than the fact that it closes.
Warsh’s removal of forward guidance concentrates repricing risk into single speeches and data releases, which helps explain why the gap between market hike pricing and the Fed’s own projections can swing so sharply between meetings.
| Asset | If hikes are removed because growth weakens | Main caveat |
|---|---|---|
| Stocks | Lower discount rates help, but cyclical weakness cancels the benefit | Bearish if driven by falling earnings, weaker consumption or poor AI returns |
| Bonds | Generally bullish; yields fall | Less so if inflation expectations stay high or fiscal risk premiums rise |
| Gold | Generally bullish; may bounce | Oil-driven inflation or a stronger dollar can overwhelm it temporarily |
| Dollar | Generally bearish; could fall further | Safe-haven demand can lift it in a global risk-off episode |
Oil could keep inflation high enough to block easing even as growth slows, and fiscal worries could hold Treasury yields up. If pricing moves toward the Fed because data weakens, expect lower yields and a softer dollar, but do not assume a stock rally. Equities would be absorbing a growth warning, not pure rate relief.
Does French bond stress confirm the growth worry or complicate it?
The loudest warning in the data comes from Paris. The gap between French and German 10-year yields stood at roughly 151-154 bp on 20 October, after briefly touching about 159-160 bp earlier in the month, the widest since the 2011-12 sovereign debt crisis.
The drivers are largely domestic:
- A deficit above 5% of GDP and doubts over credible spending cuts
- Political fragmentation ahead of the 2027 presidential election
- Protests over living costs that make consolidation harder
- About €54 billion of proposed 2027 savings with questionable political backing
- A French 10-year yield near 5%, its highest in roughly two decades
Yet the euro has held up. It serves the whole euro area, French debt has a large domestic investor base, the European Central Bank (ECB) has tools to contain fragmentation, and a weaker dollar helps. That resilience could crack if stress spreads to Italy, Spain or Belgium, or if investors doubt the ECB’s capacity.
Bearish read: No credible budget could push yields higher, pressure French banks and weaken the euro. Contained read: ECB’s Olli Rehn cites country-specific and global factors; AllianceBernstein calls it serious but not necessarily Europe’s next sovereign debt crisis.
The current evidence supports serious French-specific fiscal stress, not a confirmed 2011-style systemic crisis. For you as a US investor, global sovereign risk adds weight to holding duration and diversifying away from the dollar, but treat it as a secondary signal rather than proof of a eurozone crisis.
Investors exploring the sovereign angle will find our deep-dive into the French bond spread useful, particularly its look at the ECB’s TPI backstop and eligibility conditions.
What to watch next, and what would change the read on growth risk
The cross-asset evidence leans toward growth worry over inflation. Still, a 10-year yield near 5%, elevated oil and strong headline GDP keep the case unproven.
- 21 October (after close): Tesla and Meta Q3 earnings
- 23 October: S&P Global flash PMIs
- 27-28 October: FOMC meeting
- 29 October, 8:30 a.m. ET: Advance Q3 GDP
- December: Next FOMC, where a hike is nearly fully priced
- Into 2027: France’s budget path ahead of its presidential election
Weaker consumption detail, softer PMIs and Fed pricing converging toward its projections would strengthen the growth-risk reading. Strong consumption and firmer inflation signals pushing yields higher would weaken it.
Spac’s positioning (bearish equities, long bonds, gold and non-dollar currencies) is one analyst’s stance, not a recommendation.
This article is for informational purposes only and should not be considered financial advice. Investors should conduct their own research and consult with financial professionals before making investment decisions. Past performance does not guarantee future results, and projections are subject to market conditions and various risk factors.