The US Dollar Index (DXY), which measures the dollar against a basket of six major currencies, slid to about 101.50 today. That is a three-week low, and it came on reports of a US-Iran deal that a diplomat involved in the talks says are wrong. Gold, which normally rises when the dollar falls, slipped anyway.
On Tuesday, 20 October 2026, unconfirmed reports of a compromise mediated by Qatar and Pakistan lifted risk appetite across markets. Oil fell back from above $100, and US Treasury yields moved lower.
The index then recovered to roughly 101.70 after the denial. The bounce suggests that the market priced a possibility, not a fact.
This analysis traces how one geopolitical headline moved through the dollar, four major currency pairs, oil and gold. It also sets out the releases between 21 and 23 October that could confirm the move or reverse it.
Why did the Dollar Index fall to 101.50 when the deal was never confirmed?
The number on the screen looked decisive. According to FXStreet‘s Pablo Piovano, the index touched an intraday low just above 101.50, its lowest level since 1 October, which extended a pullback that had already run for several days.
The evidence behind the move was much thinner. The reports said Washington and Tehran had given preliminary approval to a compromise brokered by Qatar and Pakistan. Neither government confirmed it.
The denial A diplomat involved in the talks said reports that a deal was close were wrong.
Three things happened at once as traders reacted to the headline, according to FXStreet and Octa:
- Oil fell as the perceived energy-shock risk faded
- Treasury yields declined
- The dollar weakened as traders cut safe-haven positions
None of these moves needed a signed agreement. Traders were repricing the chance that an energy shock, along with the inflation and Federal Reserve pressure it brings, might be smaller than they had feared.
The rebound to 101.70 after the denial shows how conditional that repricing was. A three-week low built on an unconfirmed report tells you that the dollar’s recent strength included a geopolitical premium. That premium can drain away quickly, and it can return just as quickly.
A three-week low built on an unconfirmed report suggests the earlier strength was partly a headline premium, and separating a grounded dollar rally from an overextended one requires weighing structural dominance, Fed policy and technical confluence together.
If you are checking the dollar index today, the useful question is whether the drop reflects a change in the underlying drivers or simply a reaction to a headline. Tuesday’s session leaned heavily towards the second.
When big ASX news breaks, our subscribers know first
How does easing geopolitical risk weaken the Dollar?
The scepticism raises a fair question: why should talk of peace weaken the dollar at all? The answer runs through two channels.
The first is safe-haven unwinding. A safe haven is an asset investors buy for protection during uncertainty, and the dollar is the most widely used one. When tension eases, investors no longer need that protection, so demand for dollars falls.
The dollar remains the most widely used haven partly because of the dollar’s global dominance, as it sits on one side of nearly 89% of all foreign exchange trades.
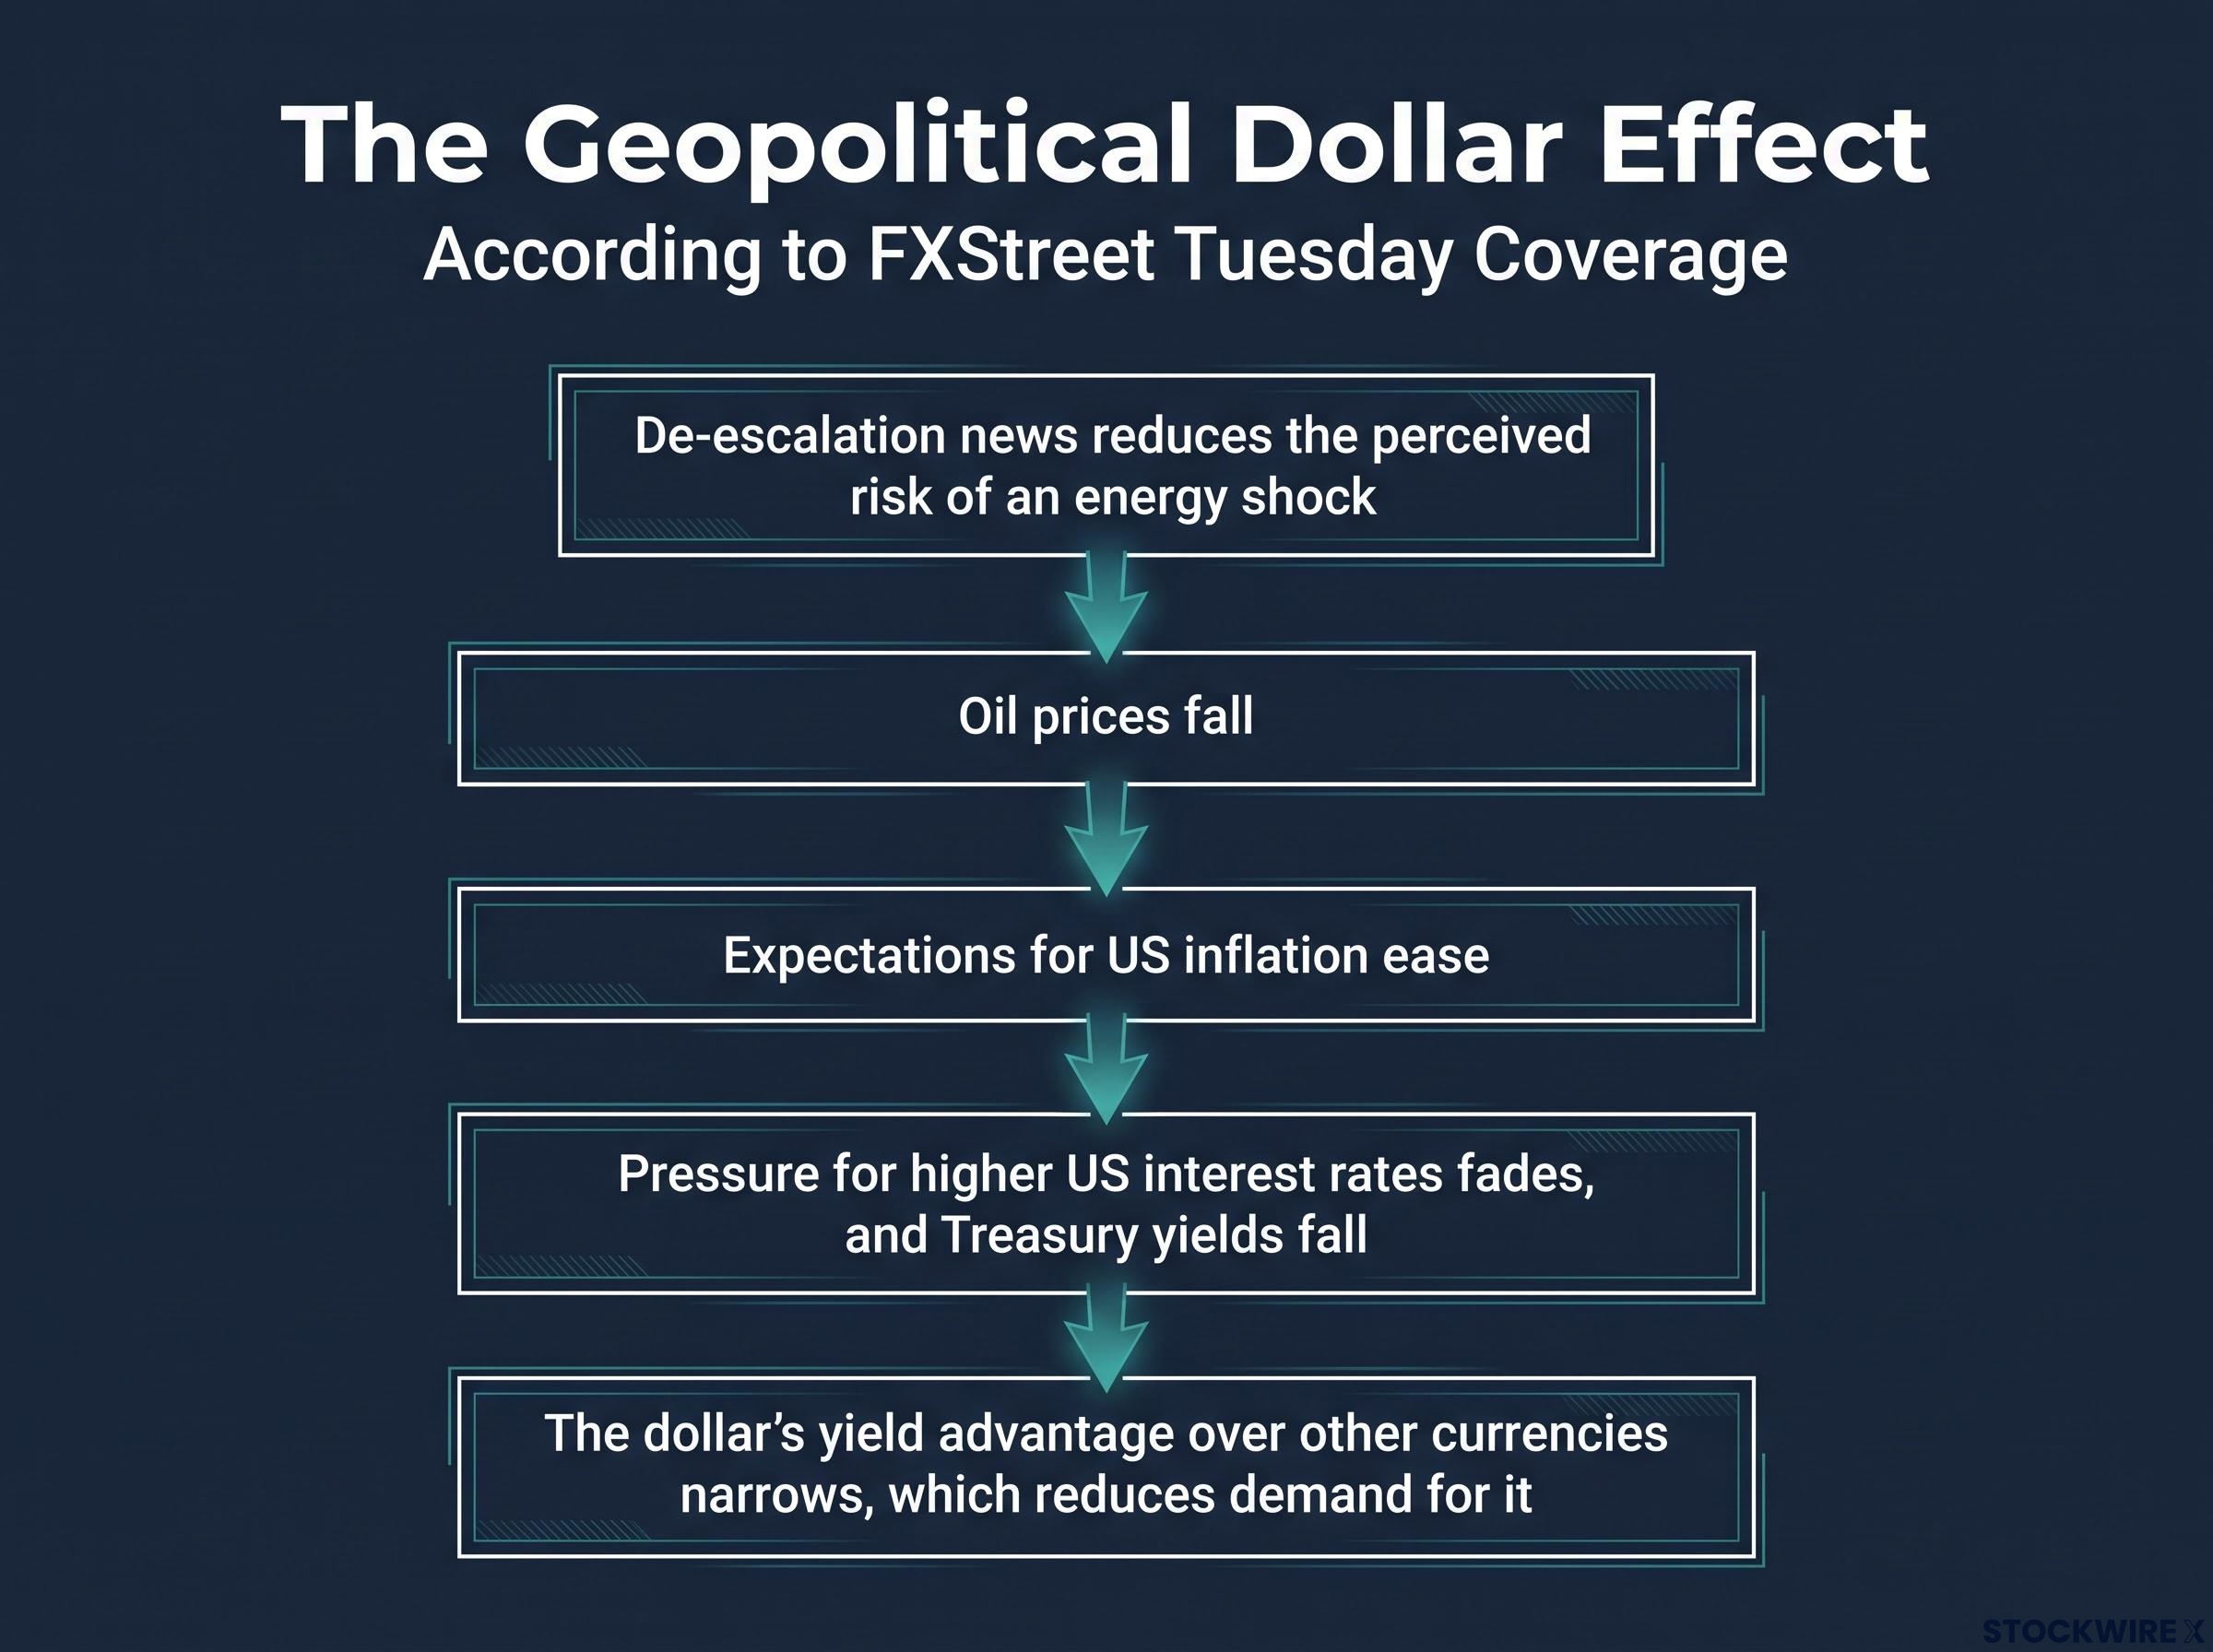
The second channel runs through oil. FXStreet set out the causal chain in its Tuesday coverage:
- De-escalation news reduces the perceived risk of an energy shock
- Oil prices fall
- Expectations for US inflation ease
- Pressure for higher US interest rates fades, and Treasury yields fall
- The dollar’s yield advantage over other currencies narrows, which reduces demand for it
There is also a terms-of-trade effect. Terms of trade compare the prices a country receives for its exports with the prices it pays for its imports. Reuters reported on 13 October that rising oil normally supports the dollar against currencies of energy importers such as the euro area and Japan, because expensive oil hurts their economies. When oil retreats, that support reverses.
The precedent is recent. On 13 October, the dollar fell from an 18-month high as oil retreated and investors judged escalation in the Middle East less likely.
| Source | Position | Mechanism emphasised |
|---|---|---|
| BNP Paribas, 13 Oct | Dollar-negative | A smaller oil-risk premium removes a catalyst for dollar gains. BNP also cites fiscal and de-dollarisation headwinds over a longer horizon. |
| Karl Schamotta, Corpay | Dollar-negative | The “US exceptionalism” trade had become overextended and was vulnerable to a technical pullback. |
| Joel Kruger, LMAX Group | Conditional | Uncertainty and higher oil drove safe-haven dollar demand, so easing stress removes part of that demand. |
Where analysts disagree
The chain does not always run in one direction. A second camp points out that higher oil can strengthen the dollar if it pushes US yields up or triggers a broad risk-off move, in which investors sell riskier assets and seek safety. Earlier Reuters reporting linked oil, rising yields and geopolitical risk with stronger dollar demand.
When you see oil and the dollar moving together, you are watching a trade driven by the risk premium. Your reading of the dollar should therefore start with the direction of oil and yields. Even then, the currency pairs do not all respond in the same way.
Which major pairs gained most, and why did the moves differ?
All four major pairs moved against the dollar on the same catalyst. Look at each one closely, however, and the pattern starts to break down.
The quotes also vary depending on when they were taken. Intraday readings captured during the headlines run higher than later end-of-day screens, so both sets of figures are shown below.
| Pair | Headline-session level | Later screen level | Key local driver |
|---|---|---|---|
| EUR/USD | Rally faltered near 1.1260 | About 1.122-1.123 | Euro-area flash Consumer Confidence |
| GBP/USD | Just above 1.3400 (five-week high) | About 1.338 | UK CPI and public sector borrowing |
| USD/JPY | Low 158.00s | Range about 158.0-158.5 | Japan Balance of Trade |
| AUD/USD | Tested 0.7000 | About 0.7000-0.7007 | Australian flash PMIs |
The euro extended its rebound but stalled. Fiscal and political concerns in Europe continued to weigh on it, limiting the gain from a weaker dollar.
Sterling reached a five-week high, although its next move depends more on domestic inflation and borrowing figures than on Tehran.
The yen barely moved. Lower oil eases the drag on Japan, which imports most of its energy, but fiscal uncertainty at home capped any gain. BNP Paribas still holds a three-month USD/JPY target of 158, almost exactly where the pair trades now.
The Australian dollar posted a third straight daily gain. Its exposure is mixed, because lower oil helps domestic inflation but removes some of the commodity-price support that the currency normally enjoys.
If you hold exposure to any of these pairs, the lesson is direct: a falling dollar index does not guarantee that your pair rises. Treat the index as a summary, then check the pair’s own fiscal and policy drivers before drawing conclusions.
Why did oil retreat while gold slipped despite a softer Dollar?
Those local frictions help explain the currencies. The commodities present a sharper puzzle.
Oil’s retreat and what it changes
Oil behaved as expected. West Texas Intermediate (WTI), the main US crude benchmark, traded above $100 earlier in the session before falling to about $95.70, according to Octa, on hopes that the Middle East crisis could end.
Cheaper oil eases inflation pressure, but the effect takes time to reach consumers. MUFG still expects UK CPI to rise to 3.5% in September because of earlier energy costs. Central banks will feel relief from oil’s fall only after a lag.
The gold puzzle
Gold should have rallied. Instead it eased towards $4,100 per ounce, from around $4,140, according to Investing.com, even though the dollar was weaker and US yields mostly fell.
FXStreet noted on 19 October that a weaker dollar alone does not guarantee a gold rally. Several explanations compete:
| View | Source | Core argument |
|---|---|---|
| Real yields | Charlotte Peuron, Crédit Mutuel AM | Long-term yields rose faster than inflation expectations, which lifted the cost of holding gold, an asset that pays no interest. |
| Forced selling | Morningstar, 19 Oct | Selling by leveraged or short-term holders can outweigh buying from ETFs and central banks. |
| Technical consolidation | TMGM | After its rebound, gold was vulnerable to a pause around $4,100. |
| Safe-haven floor | Jim Wyckoff, American Gold Exchange | Turmoil in French and US Treasury markets supports demand, which can limit declines. |
Real yields are interest rates after subtracting expected inflation. They measure what an investor actually earns from a bond, and they are what gold competes against.
The gold puzzle is not new: the relationship between gold and real yields has been structurally disrupted since 2022-2023 by central-bank buying and doubts over policy credibility, which helps explain why bullion ignores a softer dollar.
The resolution A weaker dollar and lower nominal yields normally support gold. Rising real yields, profit-taking by leveraged traders or forced selling to meet margin requirements can override that support.
Gold is not a simple mirror of the dollar. If you judge it on the index alone, you risk misreading both where support sits and how far the downside could run.
What could reverse the move, and which releases matter next?
Every part of Tuesday’s move rests on conditions that could change within days. That uncertainty can be turned into a concrete watchlist.
Reversal risks
- The deal collapses. Renewed confrontation would restore the oil risk premium and revive safe-haven demand for the dollar.
- The Fed revives the dollar. Reuters reports that traders are pricing a high probability of no immediate rate cut, with tightening priced later. Persistent US inflation could lift the dollar even without new conflict.
- Oil spikes again. OCBC’s Christopher Wong said further dollar upside depends on whether the Fed stays open to more tightening.
- Gold faces forced selling. Volatility and higher real rates could keep the metal under pressure.
The release calendar
| Release | Date | Consensus | Prior |
|---|---|---|---|
| US MBA Mortgage Applications | 21 Oct | Not available | -2.7% |
| EIA crude inventories | 21 Oct | -0.3M barrels | -8.557M barrels |
| UK CPI, September | 21 Oct | 3.5% y/y | 3.4% |
| UK Public Sector Net Borrowing | 21 Oct | GBP 23.0B | GBP 24.0B |
| Euro-area flash Consumer Confidence | 22 Oct | -17.0 | Not available |
| Japan Balance of Trade | 22 Oct (some listings 23 Oct) | JPY 250B deficit | Not available |
| Australia flash Manufacturing PMI | 23 Oct | 49.4 | 49.6 |
| Australia flash Services PMI | 23 Oct | 51.1 | 51.9 |
| Australia flash Composite PMI | 23 Oct | Not available | 51.3 |
For sterling, UK CPI carries the most weight. For the yen, it is the trade balance, and for the Australian dollar, the services PMI. Oil inventories matter most for the dollar itself.
For you, the calendar is the test. A hot UK CPI reading or a renewed climb in oil would suggest the de-escalation trade is fading, while soft data would reinforce it.
Past performance does not guarantee future results. Forecasts and consensus figures are subject to market conditions and may change.
Reading the dollar through the headlines: what holds and what does not
The slide towards 101.50 reflected three forces: unwinding safe-haven demand, cheaper oil and lower expectations for US yields and interest rates. Whether the move lasts depends on two things. The reported progress needs to become a confirmed agreement, and oil needs to stay below its recent highs.
Before treating any move in the index as a trend, check three things:
- The direction of oil
- US yields, both nominal and real
- The specific pair’s local data
The releases between 21 and 23 October offer the next evidence. They will show whether Tuesday marked a turn in the dollar or only a reaction to a headline.
Investors exploring how the rally began will find our detailed coverage of the DXY breakout above 100, which maps the support cluster that separates trend continuation from a failed breakout.
This article is for informational purposes only and should not be considered financial advice. Investors should conduct their own research and consult with financial professionals before making investment decisions.