The Canadian dollar touched a one-month high at Monday’s open, only for softer data to stop the rally. USD/CAD steadied near 1.4091 on 19 October 2026 after Canada reported weaker-than-forecast September inflation and a 68,300 job loss, leaving the near-term forecast tilted back towards the US dollar.
The pair sits between two central banks moving at different speeds. The US Federal Reserve raised rates in September, while the Bank of Canada (BoC) has held its policy rate at 2.25% all year.
That split explains why Canadian data now carries so much weight for the pair. Each release shifts expectations for the next policy decision on either side of the border.
Here is what the data tells you about why the pair stalled, where analysts see it heading, and which signals matter most over the next two months.
Why the Fed-BoC rate gap keeps the dollar in the driver’s seat
The gap between the two central banks’ rates is the starting point for any reading of this pair.
Where the policy rates stand
The rate gap: about 150 basis points in favour of the US dollar. A basis point (bp) is one-hundredth of a percentage point, so 150 bp equals 1.5 percentage points.
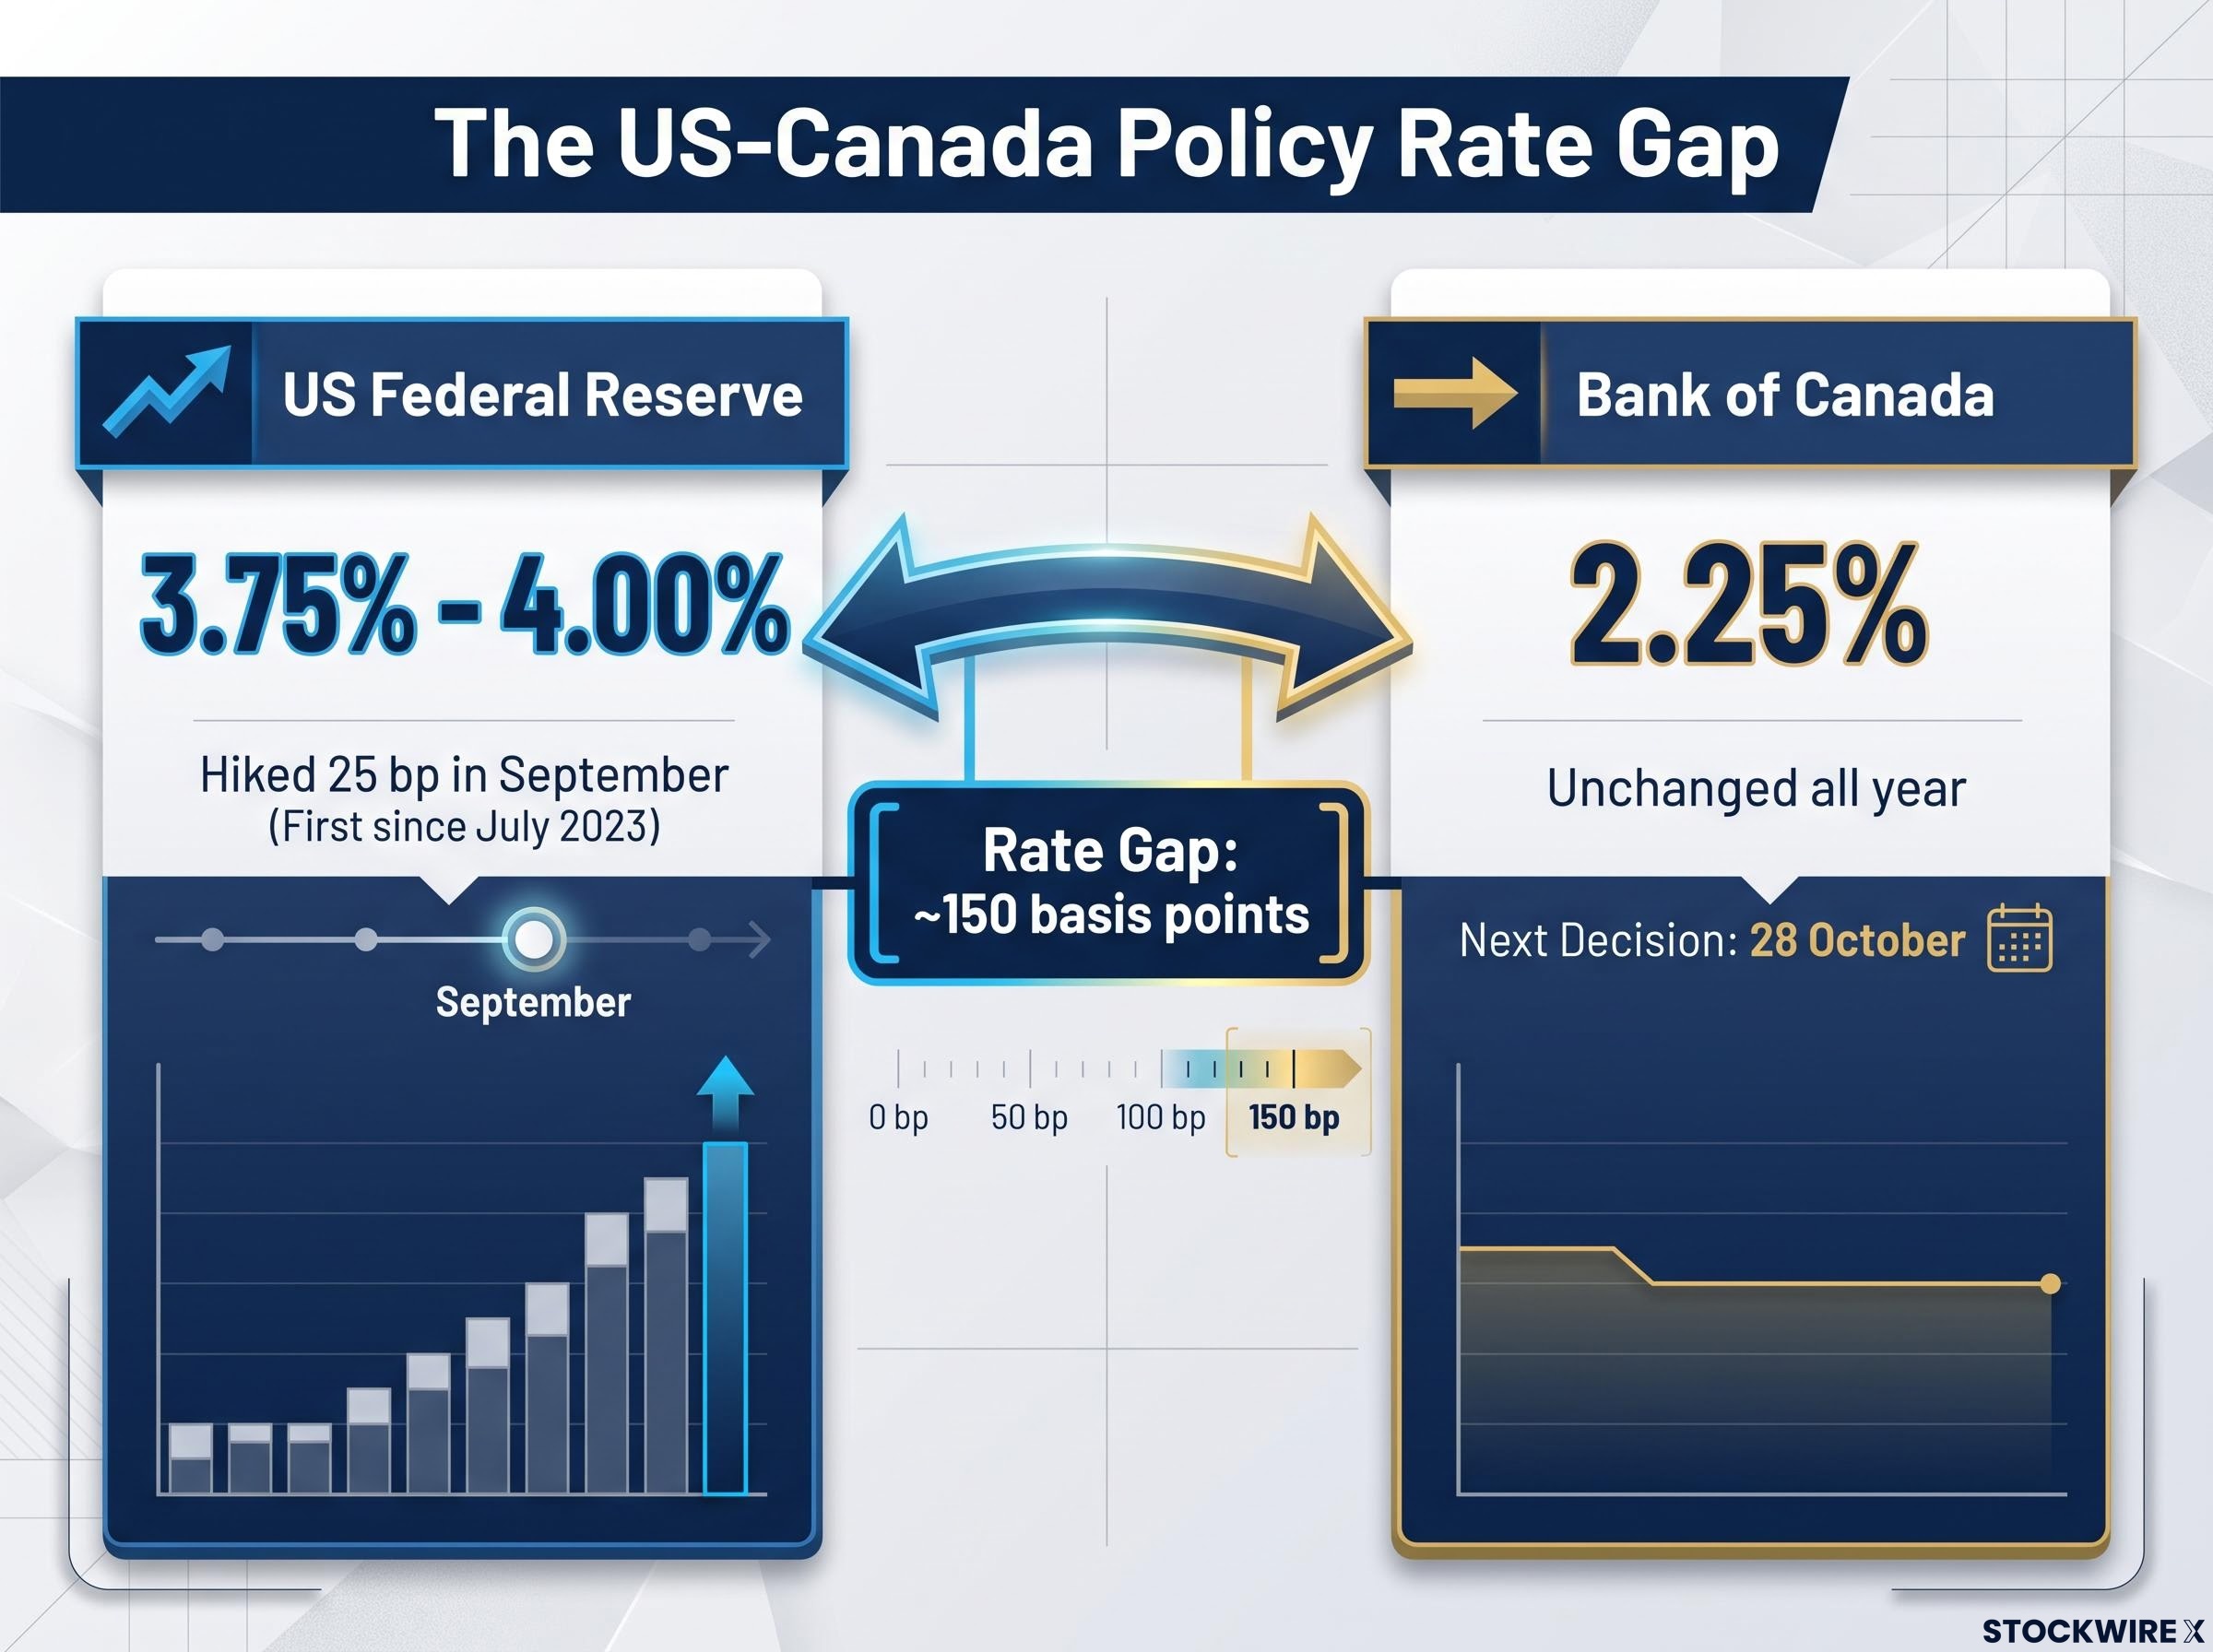
- Fed: federal funds rate at 3.75%-4.00% after a unanimous 25 bp hike in September, reported as its first since July 2023
- BoC: 2.25%, unchanged all year, with the next decision on 28 October
- Fed outlook: the median projection reportedly implies one more hike in 2026
What markets are pricing
The size of the gap matters less than the direction it is moving. CME FedWatch puts the odds of a Fed hike by December at about 89%. Sources disagree on October: the original report puts the odds at 15%, while a Reuters factbox from 15 October cited about 27%.
North of the border, ING estimated markets price about 9 bp of BoC tightening for October and a fully priced 25 bp move by December.
Recent history shows the gap drives the pair’s direction rather than setting its exact level. In late September, the two-year US-Canada yield spread reportedly widened to roughly 148-153 bp, the widest since early 2025, as the Canadian dollar slid to near seven-week lows.
The mechanism is simple. Holding US dollars currently earns more than holding Canadian dollars, so Canadian dollar rallies tend to fade unless the BoC surprises markets.
Canada-US rate differentials have historically explained more of the loonie’s moves than domestic headlines, with a one-percentage-point widening in favour of the US rate corresponding to roughly 1% Canadian dollar depreciation.
What September CPI and the jobs loss told traders about the BoC
Headline inflation rose, yet traders sold the Canadian dollar. The details beneath the headline explain why.
| Measure | Actual | Prior or Expected |
|---|---|---|
| Headline CPI (m/m) | 0.1% | 0.2% expected |
| Headline CPI (y/y) | 3.1% | 3.0% prior, 3.2% expected |
| Core CPI (y/y) | 2.2% | 2.4% prior |
| CPI-trim (y/y) | 1.8% | About 1.9% expected |
| CPI-median (y/y) | 1.9% | Not available |
Energy did most of the work. Statistics Canada data showed energy prices up about 19% year on year, with gasoline reportedly up 27.8%. Core CPI was flat on the month; one research source labels the 2.2% figure as CPI excluding gasoline rather than core.
Higher oil prices usually help the Canadian dollar through export income. This time, energy showed up as an inflation shock instead, and that is a different story for the currency.
The split between a hot headline and subdued underlying prices reflects energy-led inflation rather than broad demand pressure, which is why the Bank of Canada has limited appetite to respond with tighter policy.
The jobs report reinforced the soft read:
- 68,300 jobs lost in September
- Unemployment rate reportedly up to 6.5% from 6.4%
The Canadian dollar had already reached a one-month high before the release. USD/CAD then found a floor at 1.4070, down about 0.35% on the day.
The lesson for you is to look past the headline number. CPI-trim and CPI-median are measures that strip out the biggest price swings to show underlying inflation, and both sit near the BoC’s 2% target. That lets rate-hike expectations fade even when the headline looks hot.
USD/CAD forecast: where the pair sits and what analysts expect next
The Canadian dollar’s slide was not unusual on the day. It ranked as the second-weakest major against the US dollar, behind only the Australian dollar.
| Currency | USD change |
|---|---|
| JPY | +0.19% |
| EUR | +0.12% |
| CHF | +0.03% |
| GBP | -0.01% |
| NZD | -0.34% |
| CAD | -0.35% |
| AUD | -0.59% |
The US Dollar Index (DXY), which measures the dollar against a basket of major currencies, held near 101.85.
How the analyst views split
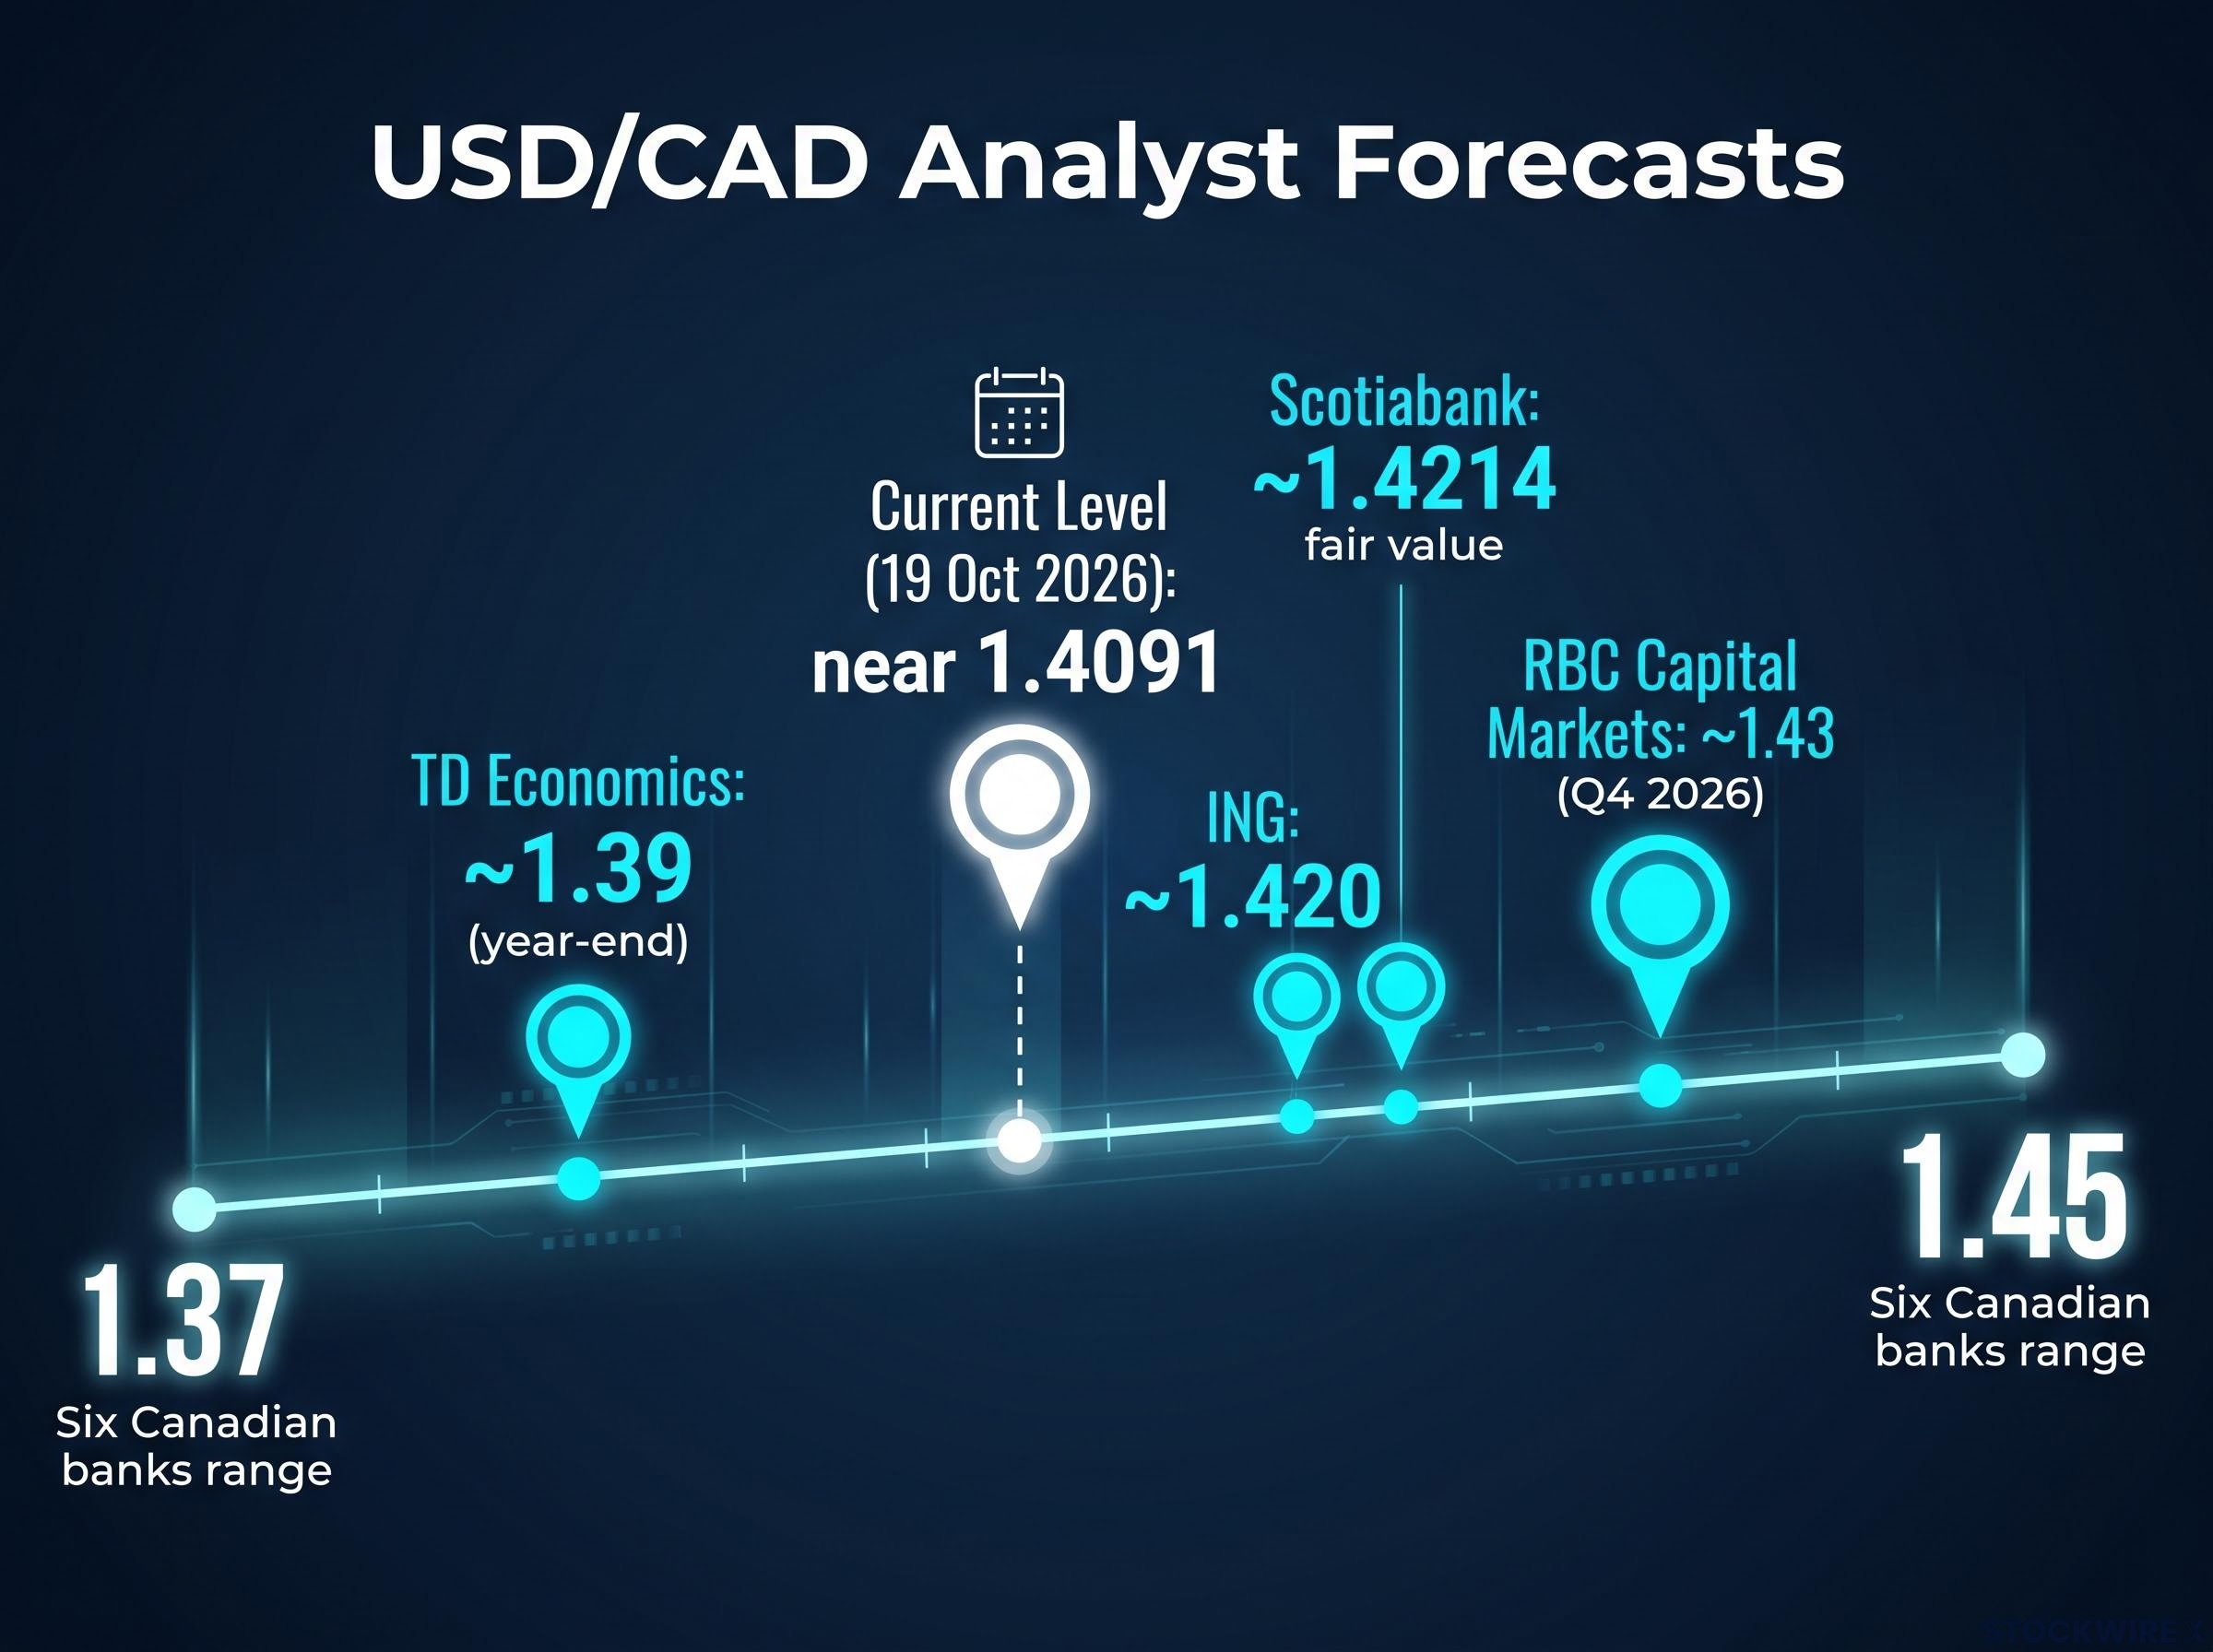
Forecasts fall into two camps. The figures below come from research that has not been independently verified.
| Source | Date | View |
|---|---|---|
| ING (Francesco Pesole) | 19 October | About 1.420 at month-end and year-end |
| Scotiabank | 13 October | Fair value about 1.4214; support near 1.41 and 1.40 |
| RBC Capital Markets | Mid-October | About 1.43 in Q4 2026 |
| TD Economics | October | About 1.39 at year-end |
| Six Canadian banks | 2 October | Year-end range 1.37-1.45 |
The near-term camp around 1.42 assumes the rate gap persists. Lower year-end calls assume it narrows. Rate differentials are only one driver, though, and risk sentiment, oil, positioning and trade flows can override them.
Rabobank reads the recent spike as an overshoot and expects yield spread compression to pull the pair into a sideways 1.41-1.42 range, a view that sits within the lower end of the near-term analyst camp.
Triggers that could change the picture
- 28 October BoC decision: ING flagged a surprise hike as the main upside risk for the Canadian dollar.
- US inflation and jobs data: hotter readings would widen the spread and push the pair higher.
- December Fed meeting: a pause could pull the pair below 1.40-1.42.
- Oil and tariffs: both could cut either way, adding volatility.
What the data changes, and what it leaves open for USD/CAD
Soft core inflation and the jobs loss took pressure off the BoC to act quickly. The rate gap still favours the US dollar, which helps explain why the Canadian dollar’s rally stalled where it did.
From here, the pair’s direction rests on two meetings: the BoC on 28 October and the Fed in December. A hawkish surprise from Ottawa or a Fed pause would favour the lower year-end forecasts. If neither happens, the near-term 1.42 camp looks better supported.
Watch US inflation and payrolls, Canada’s core measures and oil prices, and keep in mind that the rate gap is one force among several.
Investors weighing the lower year-end calls can read our detailed coverage of the 1.40 downside case, which explains why one negative trigger is enough to push USD/CAD lower.
This article is for informational purposes only and should not be considered financial advice. Investors should conduct their own research and consult with financial professionals before making investment decisions. Past performance does not guarantee future results. Financial projections are subject to market conditions and various risk factors.