
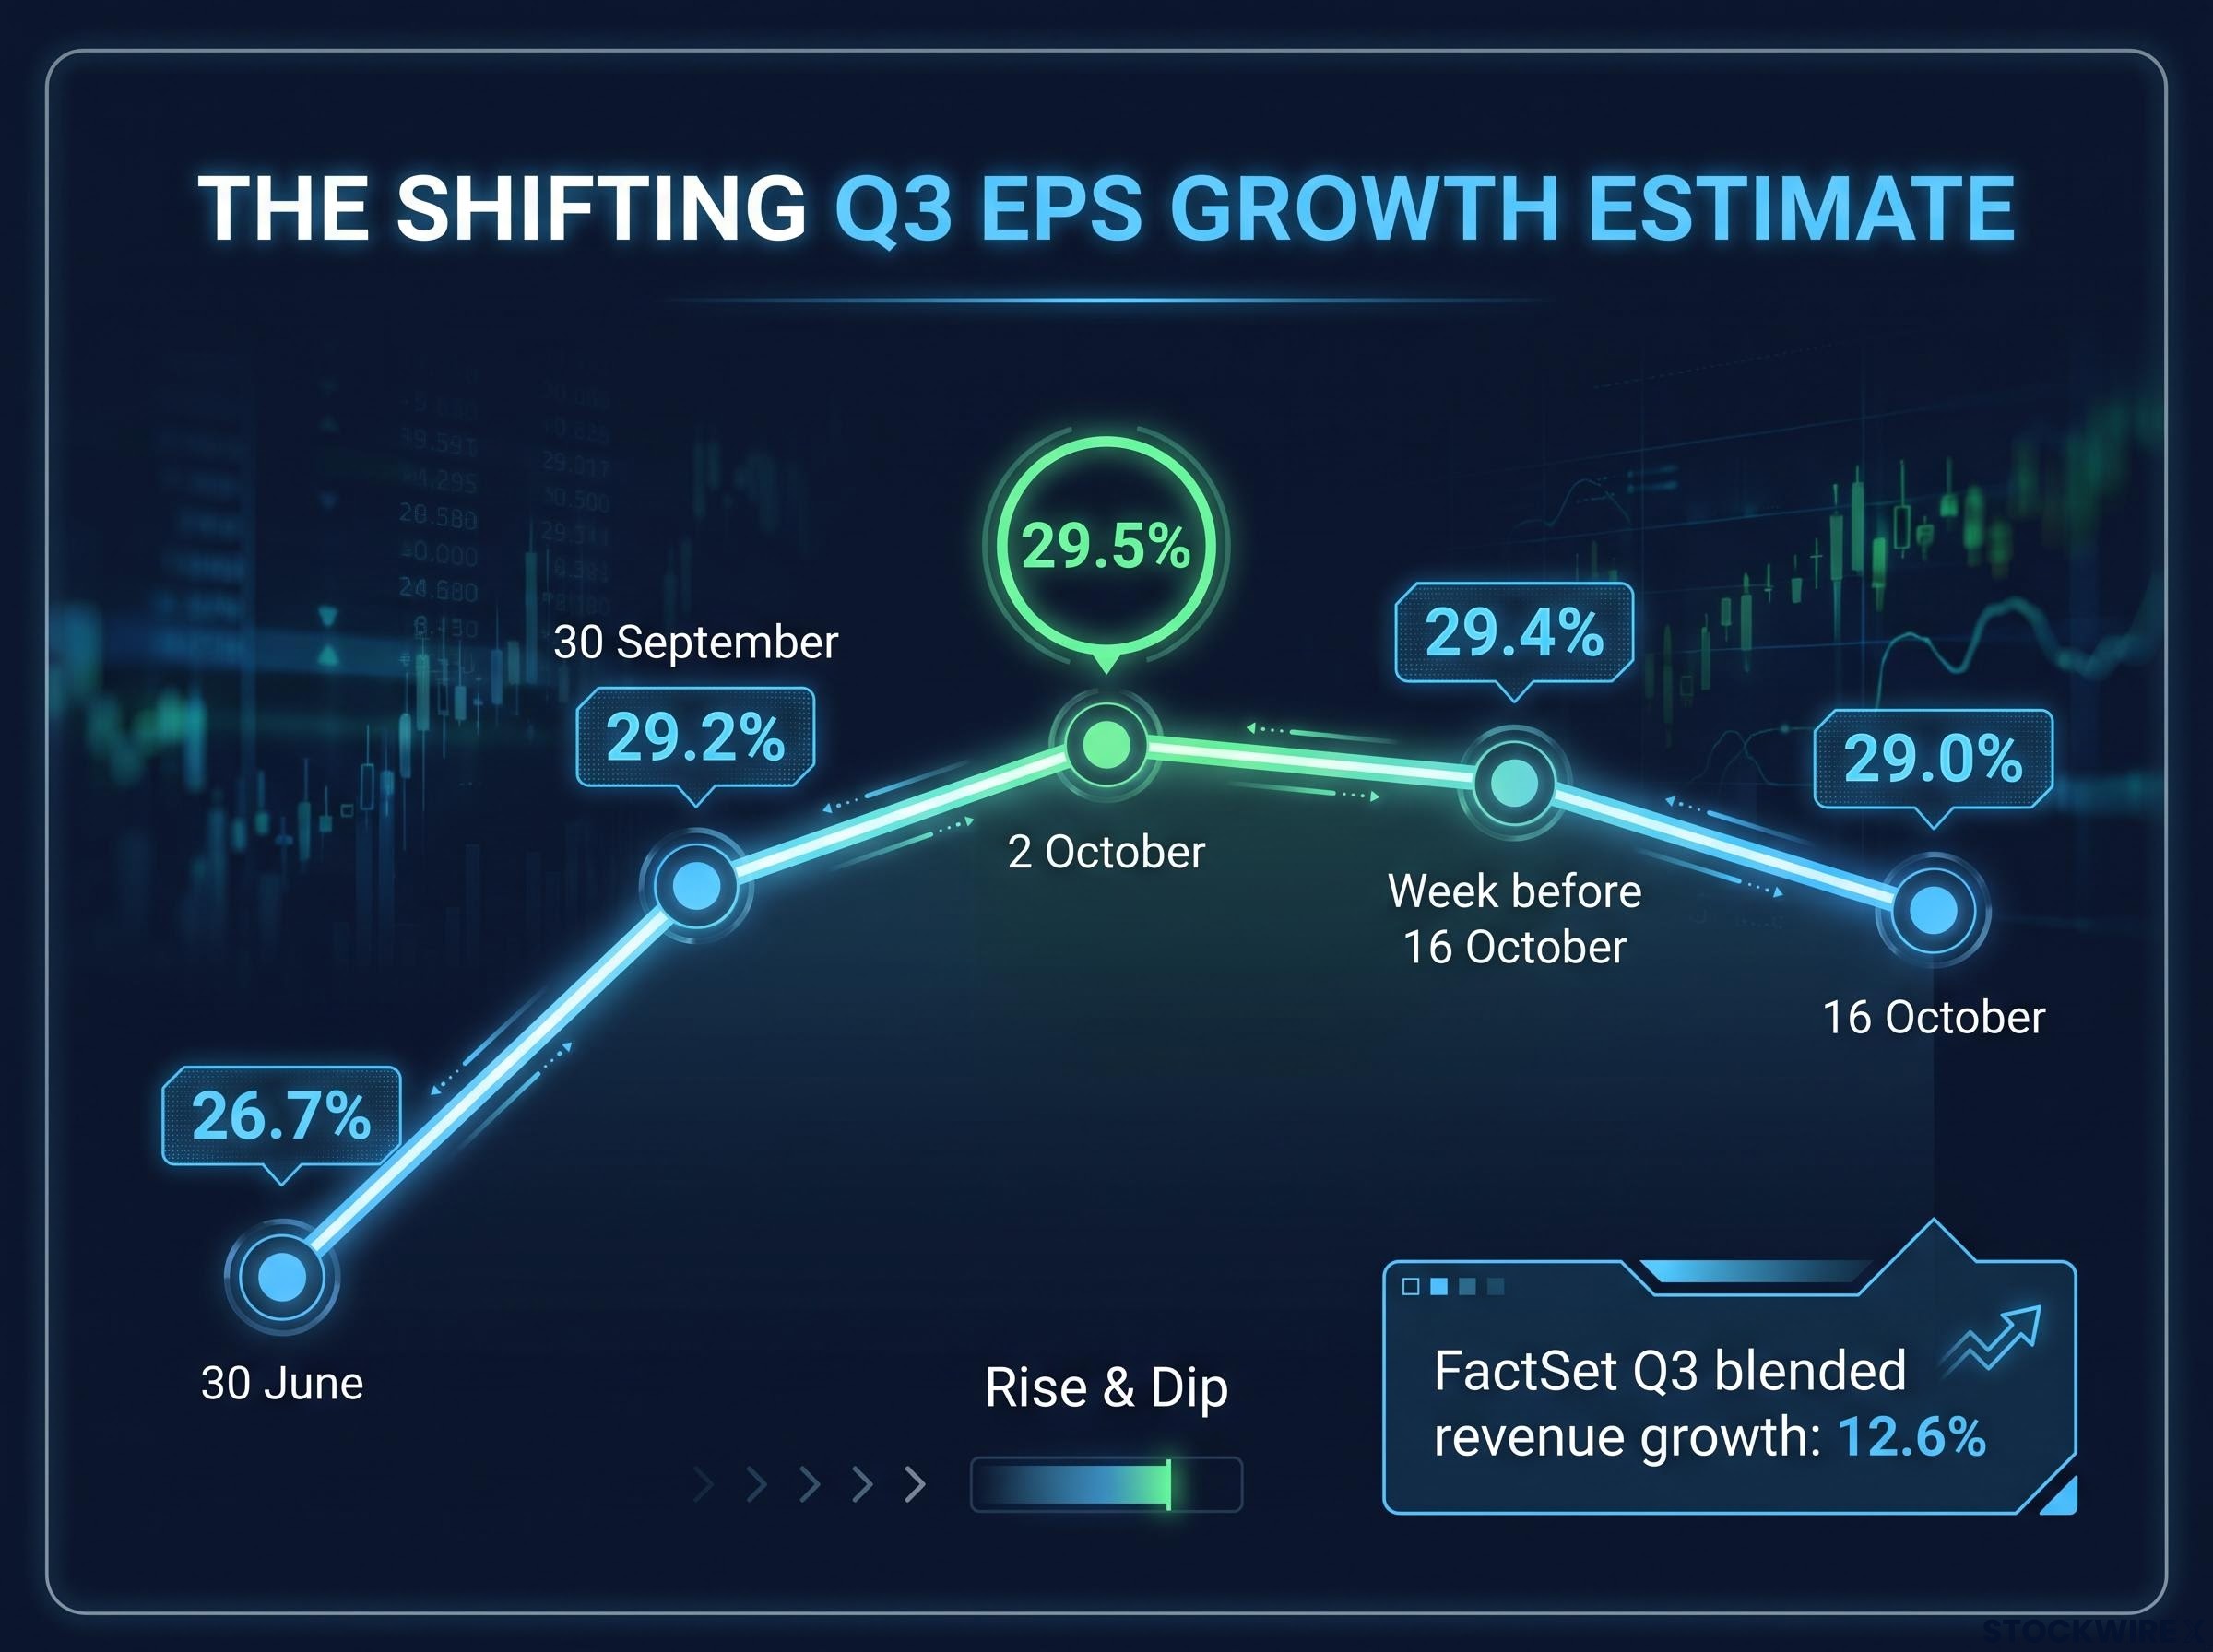
The S&P 500 sits within a percent of its record, and the profit growth forecast that helped carry it there is already slipping. FactSet’s estimate of Q3 earnings growth stood at 29.5% on 2 October. By 16 October, it had eased to 29.0%. This earnings season preview starts from one uncomfortable point: in the week ahead, a beat may not be enough.
The big banks have reported. The real test arrives on Monday and runs through next week, with Netflix, GE Aerospace, Tesla, Meta, IBM, Procter & Gamble, Valero and Lam Research all on the slate.
What you stand to gain is clarity. Some of these results will confirm a broad earnings recovery that reaches the typical company. Others will only confirm a narrow one, carried by AI giants and oil producers.
The Federal Reserve is expected to play a smaller role in the week ahead, so earnings will hold the market’s attention. Here is a checklist of signals you can hold each report against, plus the context you need to read them properly.
Why does the 29.5% growth figure need a closer look?
On its face, the number is reassuring. Profit growth near 30% from the largest US companies sounds like an economy firing on every cylinder.
The figure looks less tidy once you peel it back.
What “blended” growth actually measures
Blended earnings per share (EPS) growth combines actual results from companies that have already reported with analyst estimates for those still to come. EPS is a company’s profit divided by its number of shares. The growth rate compares the current quarter with the same quarter a year earlier.
That makes the blended figure a moving target. It shifts every time a company reports or an analyst revises a forecast, which explains the path FactSet has traced: 26.7% on 30 June, 29.2% on 30 September, 29.5% on 2 October, 29.4% a week before 16 October, and 29.0% on 16 October.
Different data providers also use different estimate pools. That is why LSEG, cited by Reuters, puts growth at roughly 30.6% while FactSet sits lower.
| Measure | Figure | Source | Date |
|---|---|---|---|
| Q3 blended EPS growth (latest) | 29.0% | FactSet | 16 October |
| Earlier Q3 EPS growth estimate | 29.5% | FactSet | 2 October |
| Q3 blended revenue growth | 12.6% | FactSet | 16 October |
| Q3 EPS growth | ~30.6% | LSEG via Reuters | October 2026 |
The gap between profit growth and revenue growth of 12.6% tells you the gains come from margins as much as from sales.
Where the growth is concentrated
Every one of these figures is an S&P 500 aggregate. It is not a measure of the typical company, and a handful of very large firms can lift the whole number.
Growth is spreading from banks into technology, energy and industrials, but AI-linked megacaps and energy are doing most of the lifting. Lipper Alpha reportedly put growth excluding energy at about 11.5%, a figure not independently confirmed. Even among the banks, results split: Goldman Sachs posted a large beat while JPMorgan missed.
The bar is high State Street said on 12 October that the strong outlook raises the performance bar for the market, implying that good results may already be in share prices.
For you, that means a company can beat forecasts and still fall. Judge each report against its own expectations and guidance, not against the index number.
The expectations gap explains why you can watch a company beat forecasts and still see its shares fall, because prices respond to results relative to what the market already assumed.
When big ASX news breaks, our subscribers know first
Will AI spending pay off? What Tesla, Meta, IBM and Lam Research must show
The biggest swing factor inside that aggregate is AI spending. To read these reports well, you need to see how money spent today is meant to become profit later.
Capital expenditure, or capex, is money a company spends on long-lived assets such as chips and data centres. The path from capex to earnings runs in four steps:
- Capex adds computing capacity: chips, data centres and networking.
- That capacity supports better ad targeting, cloud and software revenue, AI services and automation.
- Operating leverage, where revenue grows faster than costs, turns that revenue into earnings growth.
- Suppliers such as Lam Research benefit first through equipment orders, while platforms such as Meta must later prove the returns.
Where a company sits on that chain changes how you should read its beat. A supplier’s strong quarter shows spending is happening. A platform’s strong quarter has to show the spending is paying.
The three ways to read AI spending
The earnings-driver view treats AI capex as productive investment that will lift revenue across ads, enterprise software and equipment. The cost-risk view points out that costs land immediately as depreciation, power and infrastructure commitments, while revenue may take years. The bubble-risk view argues share prices already assume years of AI growth, so even a beat can disappoint.
The scale makes the debate urgent. Goldman Sachs-related coverage put combined capex for five AI hyperscalers, including Meta, at about $1.2 trillion next year, a figure not independently confirmed. Investing.com framed the central question on 16 October as whether profits can outgrow AI capex.
Hyperscaler AI capex is now absorbing an estimated 93-94% of operating cash flow, which is why returns, not spending levels, decide whether platforms like Meta can justify their outlay.
One question for each company
| Company | Report date | Consensus EPS | Consensus revenue | Key question |
|---|---|---|---|---|
| Meta | 21 October, after close | $6.77 | $63.29B | Are ad returns keeping pace with spending? |
| Tesla | 21 October, after close | $0.45 | $28.11B | Can autonomy, robotics and software offset vehicle pressure? |
| Lam Research | 21 October, after close | $2.17 | Not widely published | Is equipment demand holding up? |
| IBM | Not confirmed | Not widely published | Not widely published | Is enterprise AI lifting software revenue? |
Tesla estimates vary by provider, ranging from $0.43 to $0.46. IBM’s report date and consensus could not be confirmed, so check the company’s investor relations page before you plan around it.
The signal you want is not the EPS beat. Watch whether guidance, capex plans and margins suggest returns are arriving before costs squeeze free cash flow, the cash left after running the business and funding investment.
What do Netflix, P&G, Valero and GE Aerospace reveal about pricing power, demand and oil?
AI is only half the story. The other four names test whether profit growth reaches consumers, factories and refineries, and each carries a trap for the unwary reader.
Consumer: pricing power versus demand
Netflix reports on 20 October after the close, with consensus at $0.82 EPS and $12.87B revenue. The company’s own guidance reportedly called for about $12.86B revenue and a 33.2% operating margin, though that is not independently confirmed. Expectations are high, which leaves little room for disappointment.
Procter & Gamble is the quieter test. Its report date and consensus were not located, but the question is clear: can price rises keep supporting sales while shoppers trade down to cheaper goods?
Pricing power, meaning the ability to raise prices without losing customers, only shows up when you read volumes and margins together. Higher prices with falling volumes is a warning, not a win.
Energy and industrials: what oil does and does not tell you
Reuters has described oil and Treasury yields swinging sharply as stocks hovered near records. You might assume high crude means a bumper quarter for Valero. It does not follow.
Refiners earn the crack spread, which is the gap between the price of crude oil and the price of the fuels made from it. Utilisation rates, feedstock costs and inventory effects matter more than the headline oil price. Valero’s report date and consensus were not located.
GE Aerospace reports on 20 October before the open, with Zacks consensus at $2.02 EPS and $12.70B revenue (other coverage cites about $2.00 and $12.84B). It is your industrial read on whether growth is broadening beyond tech and finance.
Valuation also shapes the reaction. Cracker Barrel rose 30.82% in October and Kohl’s gained 18.45%, with Kohl’s posting EPS of $1.28 against $0.57 expected while trading near 8x earnings.
Cracker Barrel’s surprise Q4 adjusted EPS came in at $0.99, against expectations of roughly $0.10-$0.26.
Here is what each of the four must show:
- Netflix: revenue and margin in line with or above its own guidance.
- P&G: price rises without sharp volume losses.
- Valero: healthy refining margins, regardless of crude headlines.
- GE Aerospace: demand that signals growth outside tech and finance.
Big beats from cheap starting points can spark rallies. A beat from a richly valued stock carries no such promise.
Your signal checklist: how to score each report against the 29.5% benchmark
Everything above condenses into a scorecard you can keep beside your screen on Tuesday night. Before the reports land, remember the starting point: the S&P 500 sat about 0.6% below its record before the reporting wave (Reuters, 6 October).
With expectations that high, guidance will likely move shares more than the headline beat. Score each report on these seven signals:
- Beat size: how far did results clear expectations, not just whether they did?
- Revenue versus EPS: did sales beat too, or did cost cuts do the work?
- Forward guidance: did management raise, hold or cut its outlook?
- Margins: are they widening or narrowing?
- Capex commentary: for AI names, is spending rising faster than returns?
- Pricing versus volume: for consumer names, are price rises costing customers?
- Share reaction: did the market reward the result, and does the reaction match the numbers?
The banks offer a calibration. These results were reported by Investing.com and not independently confirmed.
| Company | Result | Takeaway |
|---|---|---|
| Goldman Sachs | EPS $17.01 vs about $13.09; shares up about 4.65% premarket | A big beat can drive a strong reaction |
| JPMorgan | EPS about $5.75 vs $5.93 | A miss matters even in a strong season |
| Wells Fargo | Small EPS beat, revenue shortfall | A thin beat does not erase revenue concerns |
Keep rates in mind as well. Rising oil and Treasury yields can hit long-duration AI stocks, whose value rests on profits far in the future, even when results are good.
The breadth caveat Lipper Alpha reportedly put Q3 growth excluding energy at about 11.5%. The figure is not independently confirmed, but it shows how much the headline depends on a few sectors.
Your scorecard tells you whether a result confirms broad profit growth or only the narrow AI and energy story. That determines how much weight you should give the headline number.
Past performance does not guarantee future results. Forecasts and consensus estimates are subject to market conditions and may change before or after each report.
What the week ahead can confirm, and what it cannot
The coming reports can show whether profit growth is broadening beyond banks, AI and energy, or staying narrow. They cannot settle the AI return question in a single quarter. Keep the latest figure in view too: FactSet’s blended estimate is 29.0%, not the 29.5% that framed the early season.
Your next step is practical. Pick two or three reports that matter most to your portfolio, run each through the checklist, and weigh guidance above the headline beat. Before you plan around IBM, P&G or Valero, confirm their dates on each company’s investor relations page.
This article is for informational purposes only and should not be considered financial advice. Investors should conduct their own research and consult with financial professionals before making investment decisions.