A strangle that wins more often should feel safer. The numbers say otherwise.
In a tastylive study of short strangles, the win rate climbed from about 67% to about 84% as the strike delta fell from 40 to 5. Over the same range, the worst single loss grew from about 2.3x to about 7.5x the credit collected.
Both numbers are true at once, and they matter more than usual for US options sellers. The tariff shock in April 2025 and the energy and geopolitical spike in March 2026 showed how quickly a quiet premium-selling environment can turn. If you trust one comforting metric, one bad cycle can cost you far more than it appears to.
Low delta strangles are a popular way to collect option premium with a high hit rate. Here is how to read win rate, buying power, delta and theta together, so a reassuring statistic stops hiding the tail.
Why does a higher win rate come with bigger losses?
A short strangle means selling an out-of-the-money put and an out-of-the-money call on the same underlying. You keep the premium if the price stays between the two strikes. Delta, in this setting, roughly estimates the chance an option finishes in the money, so a 5-delta strike sits far from the current price.
Delta is only a rough proxy for probability of profit, and early-exit rules such as closing at 50% of maximum profit can lift the realised win rate well above what the entry delta implies.
The tastylive research team sold strangles at 45 days to expiration (DTE), managed them at 21 DTE, and tested deltas from 40 down to 5. They ran about 1,600 cycles per delta on data from 2020 through 2026.
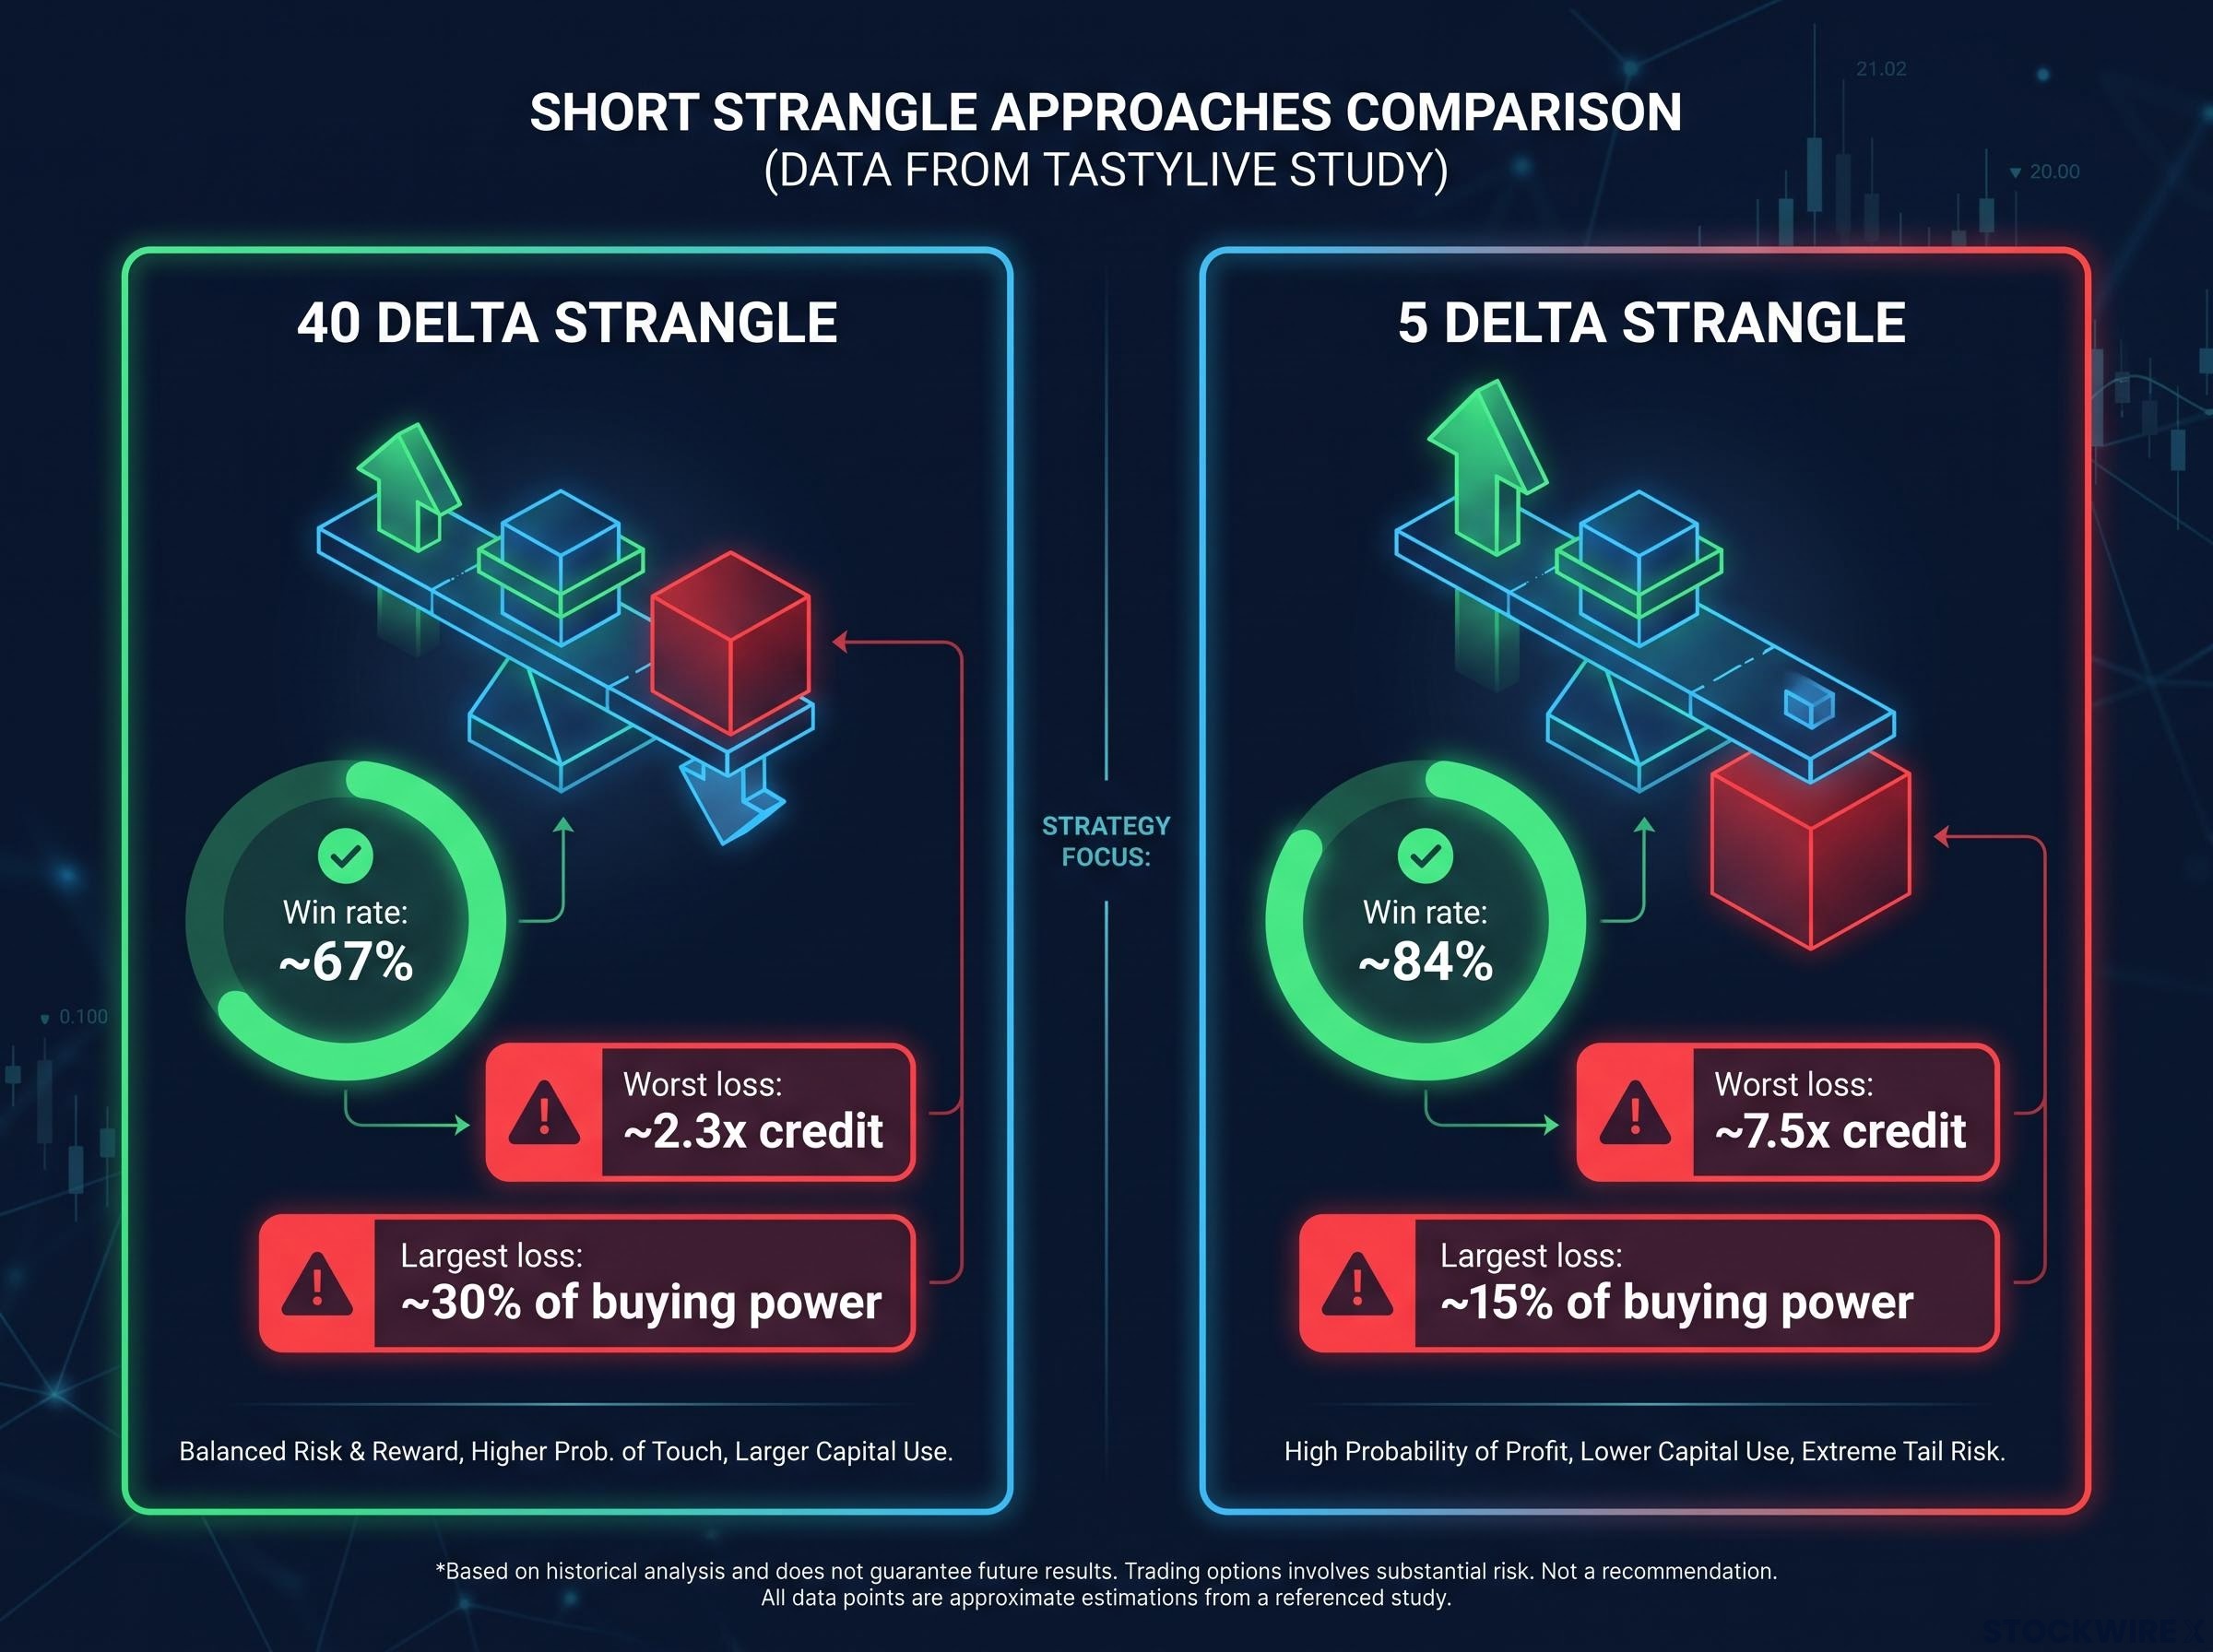
| Strike delta | Win rate | Worst loss (multiple of credit) | Largest loss (% of buying power) |
|---|---|---|---|
| 40 | ~67% | ~2.3x | ~30% |
| 5 | ~84% | ~7.5x | ~15% |
The reason is the denominator. If your credit falls from $1.00 to $0.25 while a stress loss stays at $2.00, the loss jumps from 2x to 8x credit, even though the dollar loss never quadrupled. Five forces push the multiple higher as delta falls:
- Farther strikes collect much less credit.
- A large move travels through a 5-delta strike just as it does a nearer one, so the loss does not shrink in proportion.
- Gamma speeds up the damage near the strike and near expiration.
- Rising implied volatility lifts the value of the options you sold.
- The smaller credit shrinks the denominator, inflating the multiple.
Key figure: Worst loss rose from about 2.3x credit at 40 delta to about 7.5x at 5 delta.
The gamma and volatility channels
Gamma measures how fast delta changes as price moves. As expiration approaches and price nears your strike, a small unrealised loss can grow into several times your credit within days. Implied volatility, the market’s priced expectation of future movement, can also climb and push your short options higher before any strike is touched.
Cboe and Meketa Investment Group describe the volatility risk premium as steady pay for sellers that compensates for tail losses standard volatility and Sharpe statistics under-capture. A rising win rate tells you the strategy loses less often, not that it loses less. Treat the multiple-of-credit figure as the real cost of one bad cycle.
When big ASX news breaks, our subscribers know first
Why does buying power make low-delta trades look safer than they are?
Look at the last column of that table again. Largest loss as a share of buying power fell from about 30% to about 15%. On your account screen, the 5-delta trade looks half as dangerous.
That comfort comes from a collateral formula, not a loss forecast. Buying power is the margin your broker sets aside under specified stress assumptions. Distant strikes score low in those formulas, but your premium falls too, so risk per dollar of credit climbs.
| Product or rule | Calculation | Source and date |
|---|---|---|
| Broad-based index option, uncovered | 100% of option value plus 15% of underlying, less out-of-the-money amount; floor of 10% of index value (calls) or put exercise price (puts) | Cboe, updated 2 October 2026 |
| Short strangle at tastytrade | Greater uncovered side plus other leg’s premium, e.g. $910 + $120 = $1,030 | tastytrade, updated 12 October 2026 |
| Portfolio margin | Greatest projected loss across simulated price and volatility scenarios (OCC TIMS) | Cboe, 2 October 2026; OCC, 14 February 2025 |
Cboe notes these are exchange minimums, and clearing firms can set higher ones. Portfolio margin models do not cover every gap or liquidity outcome either.
When a spike changes the rules mid-trade
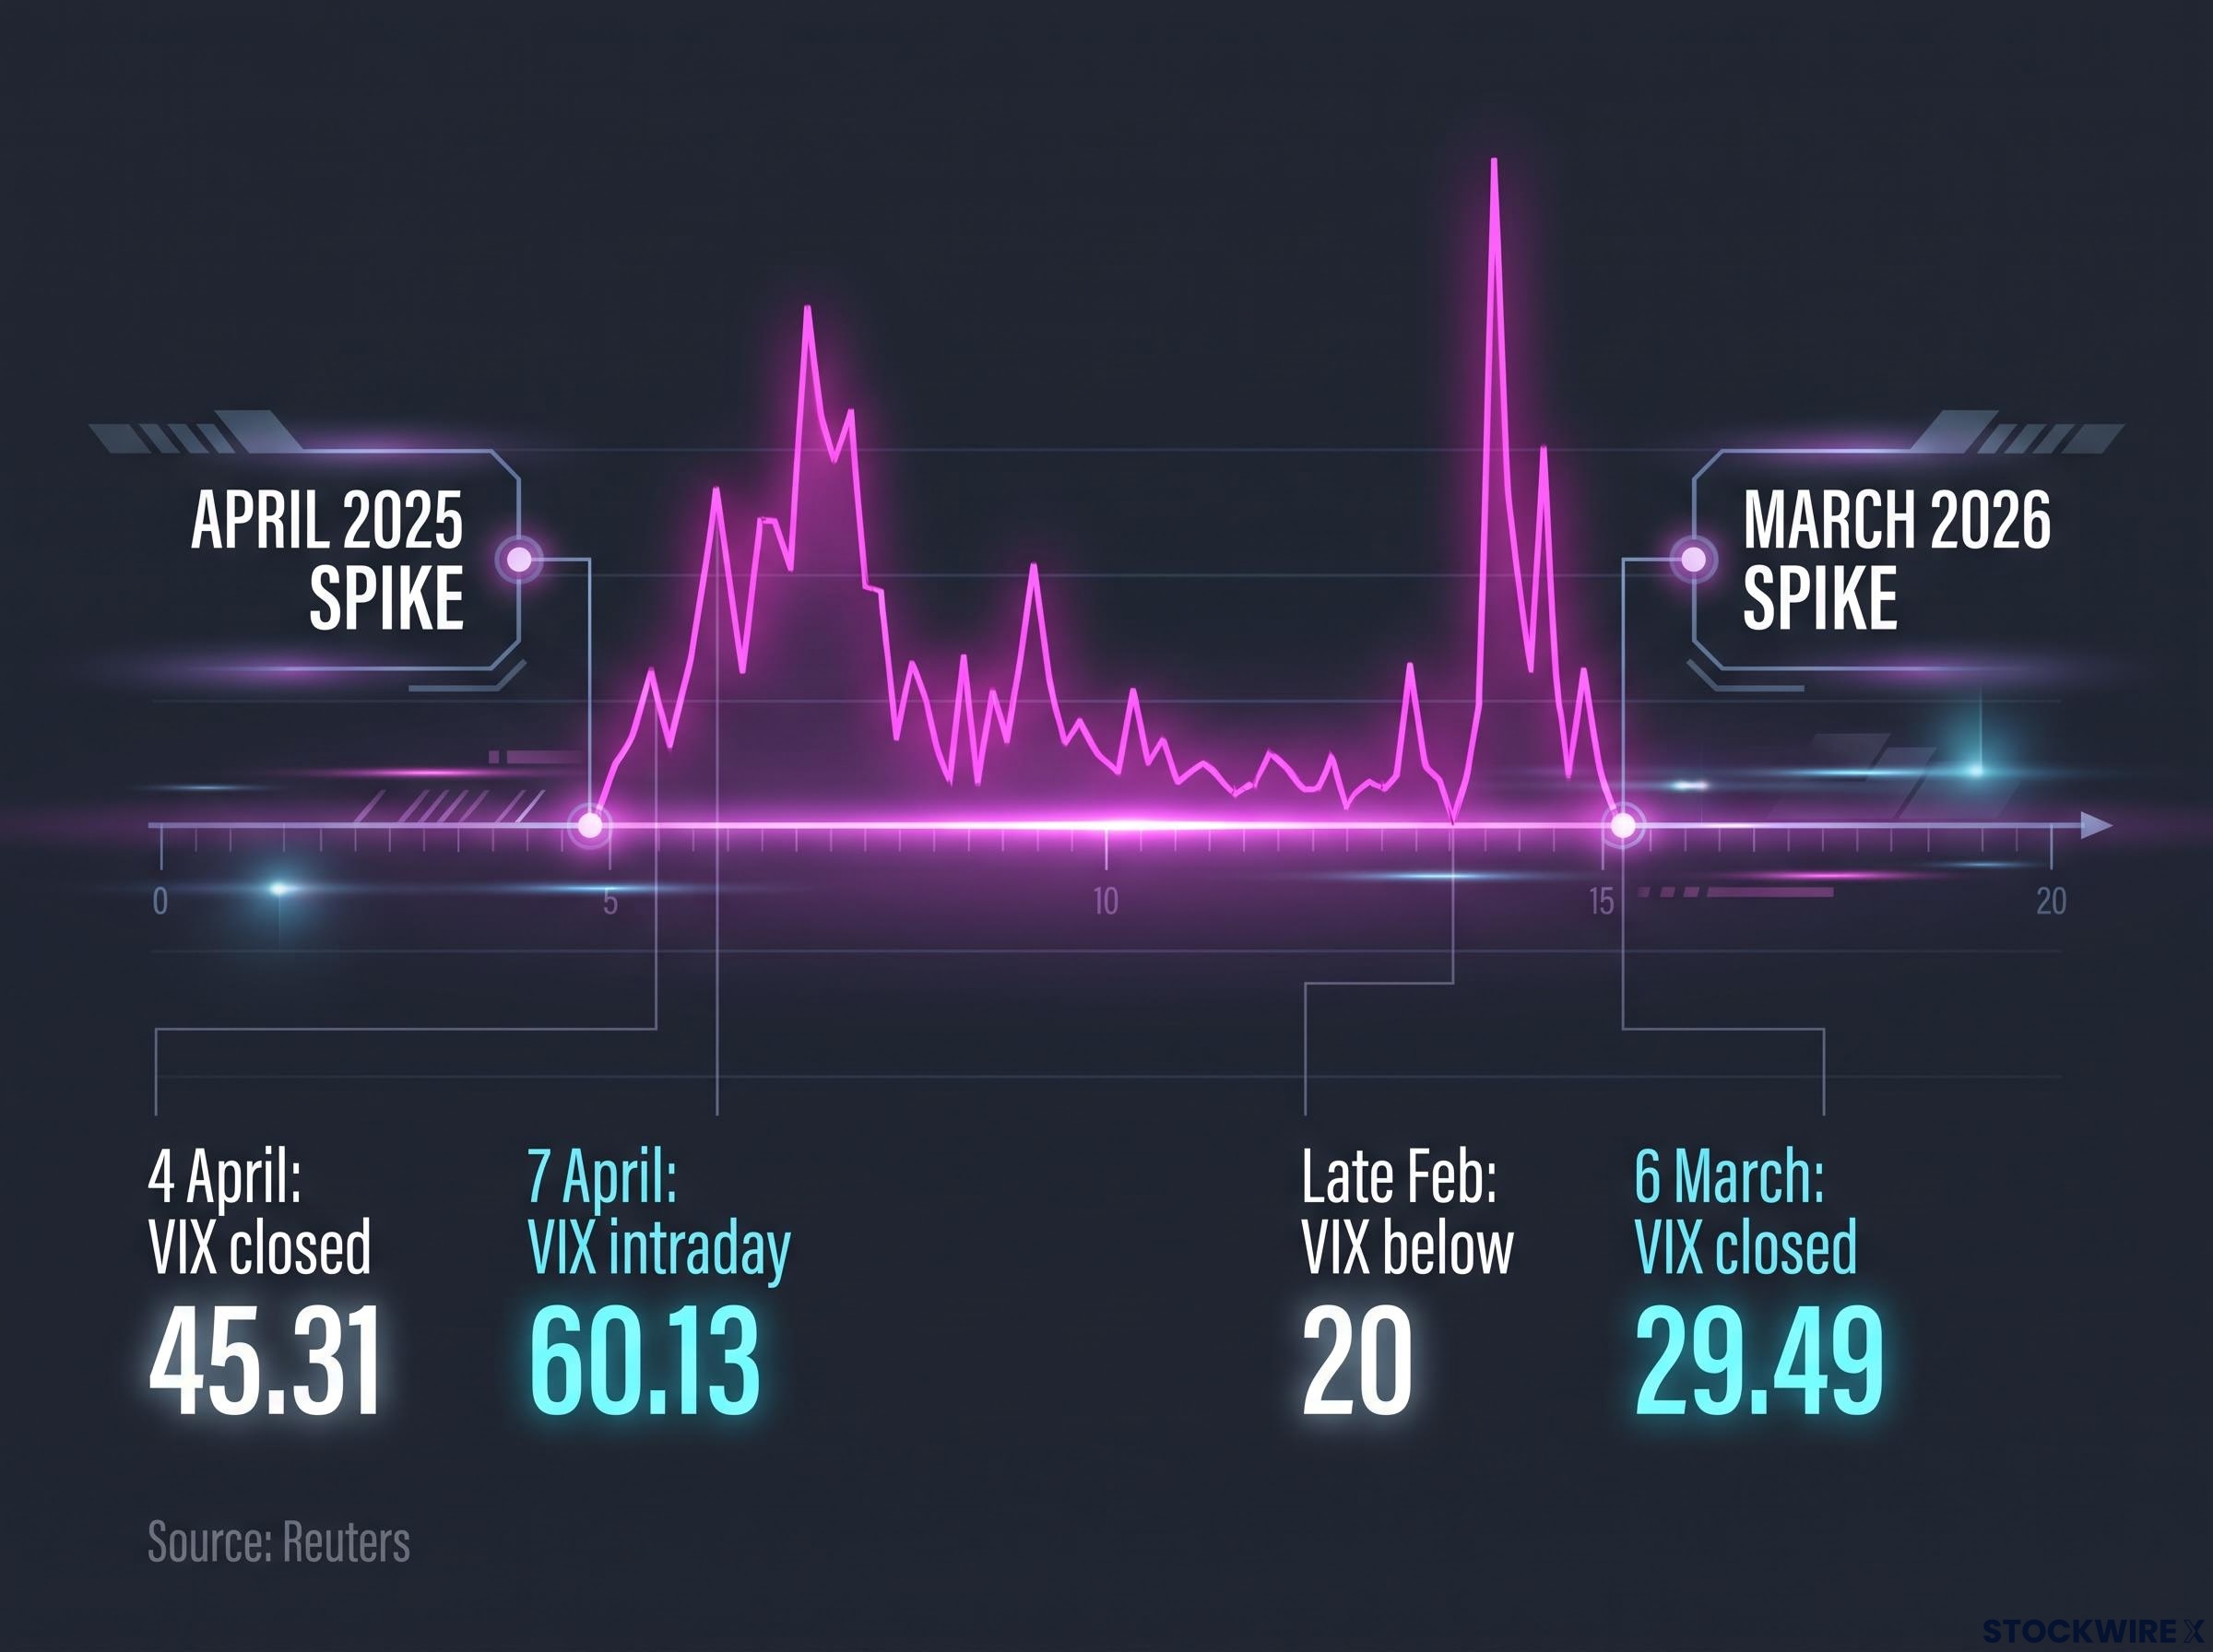
On 4 April 2025, the VIX closed at 45.31, then hit an intraday 60.13 on 7 April, according to Reuters. In March 2026, it closed at 29.49 on 6 March, up from below 20 in late February.
Events like these hit you through several channels at once: price approaches a strike, implied volatility reprices, spreads widen, and gamma rises. Brokers can also raise requirements mid-spike, forcing you to cut positions just as losses peak. A low buying-power reading tells you the formula sees little immediate risk, not that your tail exposure per dollar of premium has fallen.
The same pattern shows up in single-sided trades: naked short puts earned roughly three times the bull-market returns of put spreads, yet produced about 1.7 times the losses in each major drawdown, including April 2025.
How should you compare strategies fairly? Premium, contracts and sample years
Headline backtests feel definitive. Two traps can quietly break them.
Match the premium, not the contract count
Collecting $1,000 of credit takes about 5.6 five-delta strangles versus a single 25-delta strangle, according to the tastylive team. For identical premium, risk with the low-delta approach is roughly 2.2x higher. When comparing, say, an iron condor with a strangle, match the premium and use skewed iron condors to balance delta exposure.
Check the years before trusting the average
In the tastylive data, 2020 rewarded lower deltas because premiums were rich, and 2025 showed a milder version. 2026 reversed it: average P&L as a percent of credit rose down to about 16 delta, then turned negative at 5 delta (about -2%). Single events in April 2025 and March 2026 dented otherwise good years.
Methodology changes the levels too. An Options Bench SPY backtest (30 DTE, held to expiration, 2010-2023) is not interchangeable with the tastylive study:
| Delta | Win rate | Average P&L | Worst loss |
|---|---|---|---|
| 5 | 95.8% | $9.38 | -$6,632 |
| 16 | 78.4% | $212 | -$8,343 |
| 30 | 67.1% | $450 | -$9,045 |
The 5-delta win rate reads about 84%, 98% (a tastylive 6 May 2025 50%-profit-target study) or 95.8%, depending on exit rules, DTE and years. Keep these caveats in view:
- Management rules (expiry, profit targets, 21-DTE exits) change results
- Overlapping cycles can share one shock yet count as separate trades
- Mid-price fills and omitted slippage flatter returns
- Testing many settings raises the chance the best one is luck
If a backtest does not match premium, hold exit rules constant and disclose its years, you cannot tell a real edge from an artefact. Ask those three questions of every comparison, including the ones here.
How do delta, theta and buying power work together in practice?
Each metric answers a different question. Delta covers probability and directional exposure; theta, the daily time decay you earn, shows credit per day relative to risk; buying power shows collateral. Loss as a multiple of credit shows what one bad cycle costs.
Run this check before your next strangle:
- Find the worst historical loss as a multiple of credit.
- Match premium when comparing alternatives.
- Stress your margin for a spike in requirements.
- Test results across calm and crisis years.
- Price a defined-risk version of the same trade.
| Approach | Trade-off |
|---|---|
| Size by buying power | Simple, but can overstate low-delta safety |
| Size by credit or expected shortfall | More conservative; caps modelled stress loss |
| Naked strangles | Keeps premium and capital efficiency for large accounts (Option Alpha), with theoretically unlimited risk |
| Iron condors | Capped loss, but lower credit, extra costs and execution complexity |
The evidence leans toward the middle. Tastylive flagged 16-20 delta as a balance of profit and risk, and its May 2025 study showed about $18 average P&L at 5 delta versus about $77 at 40. Cboe research finds that since 1987 investors have overpaid for downside protection, which makes far out-of-the-money puts less attractive per unit of risk than probability suggests.
Entry timing helps at the margin: tastylive’s 7 January 2025 work found entries with IV rank (current implied volatility relative to its past year) above 30 succeeded about 70% of the time at roughly 3:1 risk/reward. Yet years of gains can vanish fast. In February 2018, a short-volatility ETN that gained over 1,000% from 2010 to 2017 reportedly fell more than 90%.
Research on 16-delta strangles shows that entry timing after 3% down days more than doubled average P&L, but the largest single loss grew alongside it, so you still need to size down as implied volatility rises.
Principle: Do not rely on one metric. If win rate, loss multiple, theta and margin impact do not all tell a tolerable story, the position is too large for your account.
Reading the whole risk picture before your next trade
As delta falls, win rate rises, but loss as a multiple of credit rises faster, and buying power can disguise that shift.
Carry three habits forward. Compare strategies at equal premium. Check which years a result covers. Weigh delta, theta and buying power together with the loss multiple.
Which metric do you lean on most today? Run your open positions through the multiple-of-credit lens and see whether the answer still feels comfortable.
Backtest results are historical, depend heavily on methodology and do not guarantee future outcomes. Past performance does not guarantee future results.
This article is for informational purposes only and should not be considered financial advice. Investors should conduct their own research and consult with financial professionals before making investment decisions.