
As of mid-October 2026, Westpac trades on a lower earnings multiple and pays fully franked dividends. Yet ANZ shares are up about 7.7% this year while Westpac shares have fallen roughly 9% to 11%. When comparing ANZ vs Westpac shares, the bank that looks cheaper on paper is the one losing ground.
Both banks carry market capitalisations of about $118b, and both offer cash dividend yields of roughly 4.3% to 4.5%. For anyone with $5,000 to put into one of them, the headline numbers barely separate the two.
That similarity is a trap. If you choose on headline yield alone, you could miss a meaningful franking gap, or misread a share price rally that rests on promises rather than delivered results.
Here is a framework for weighing valuation, after-tax income and momentum against each other. The Motley Fool Australia author who prompted this comparison preferred ANZ. That is the author’s opinion, and this analysis does not endorse either bank.
Two big banks, one close race: how the numbers compare
ANZ took its current form in 1969 and now serves more than 8.5 million customers across 30 international markets. Westpac is Australia’s oldest bank. It started as the Bank of New South Wales in 1817 and today runs brands including St.George, Bank of Melbourne, BankSA and BT.
The figures below come from Motley Fool Australia, used here as one consistent comparison set.
| Metric | ANZ | Westpac |
|---|---|---|
| Share price | $39.01 (close 15 Oct 2026) | $33.72 (16 Oct update); $34.66 (15 Oct update) |
| YTD return | +7.68% | -10.7% (16 Oct); -8.8% (15 Oct) |
| Market cap | $117.65B | $118.55B (15 Oct) |
| P/E | 19.41 | 16.62 (16 Oct); 16.97 (15 Oct) |
| Indicative yield | about 4.3%-4.5% | about 4.4%-4.5% |
| FY25 dividend per share | 166c | 153c |
The P/E, or price-to-earnings ratio, is the share price divided by earnings per share. It tells you how many dollars investors are paying for each dollar of annual profit. One small caveat: Westpac’s official FY25 dividend total is 153c, while the Motley Fool source lists $1.54. The 1c gap remains unexplained.
The year-to-date split ANZ is up about 7.7% in 2026. Westpac is down about 9% to 11%, depending on the update date.
Similar market caps and matching yields mean size and headline income cannot settle this choice for you. The answer sits in what lies beneath those numbers.
Why the figures differ between sources
Closing dates, update times and calculation methods all move the reported price, market cap and P/E. Treat the latest dated figures as current, and check live prices before you act.
When big ASX news breaks, our subscribers know first
Franking credits, EPS and P/E: reading the fine print
Look closer and the signals start to conflict. Sources disagree on ANZ’s franking level, and ANZ’s earnings figure does not sit neatly beside its P/E. Both puzzles can be solved once you see how they work.
What franking means for your after-tax income
A franking credit is a tax credit attached to a dividend, reflecting company tax the bank has already paid at the 30% rate. A $1.00 fully franked dividend grosses up to $1.4286 for tax purposes. At 75% franking, the same dollar grosses up to $1.3214, about 10.71c less in credits.
The 30/70 grossing-up formula behind these figures multiplies the cash dividend by 30 and divides by 70, which is why a fully franked $1.00 payment carries about 42.86c of credit attached.
ANZ’s franking figure is contested. The comparison article reports 75%, but ANZ’s official FY25 release shows the 83c final dividend as 70% franked. The bank’s own document is the stronger source, and the gap is slightly wider than the table below shows.
| Marginal tax rate | Fully franked, net tax per $1.00 | 75% franked, net tax per $1.00 |
|---|---|---|
| 0% | about $0.4286 refund if eligible | about $0.3214 refund if eligible |
| 30% | about $0 | about $0.0786 |
| 37% | about $0.10 | about $0.1672 |
| 45% | about $0.2143 | about $0.2643 |
On a $5,000 holding, ANZ pays roughly $215 to $225 a year in cash and Westpac roughly $220 to $225. With cash yields this close, Westpac delivers more grossed-up value. Complying super funds taxed at 15% benefit substantially from full franking, and retirement-phase funds may benefit more. If you are on a higher marginal rate or invest through super, Westpac’s income is worth more to you than the matching headline yield suggests.
These figures are simplified and exclude offsets, thresholds, the Medicare levy and eligibility rules. They are not personal tax advice.
Why EPS and P/E can look inconsistent
Earnings per share (EPS) is net profit divided by the number of shares. ANZ’s listed EPS of about $1.973 against a P/E near 19.4 does not reconcile cleanly, because providers use different bases:
- Statutory EPS: profit under accounting standards (IFRS). ANZ’s FY25 statutory profit was $5.891b; Westpac’s was $6.916b.
- Cash or adjusted EPS: strips out one-off, restructuring and regulatory items. ANZ’s cash profit was $5.787b after $1.109b of significant items; Westpac’s adjusted profit was $6.972b.
- Provider-calculated EPS: websites may use trailing, forecast or normalised figures.
A single website’s multiple is not reliable on its own. Compare both banks on the same forward cash or normalised basis.
Why ANZ is outperforming despite the pricier multiple
If Westpac wins on income and valuation, the market must be paying for something else at ANZ. Part of the answer is the starting point: ANZ entered the rally on a forward P/E of about 15.1x, against roughly 25x for Commonwealth Bank (CBA).
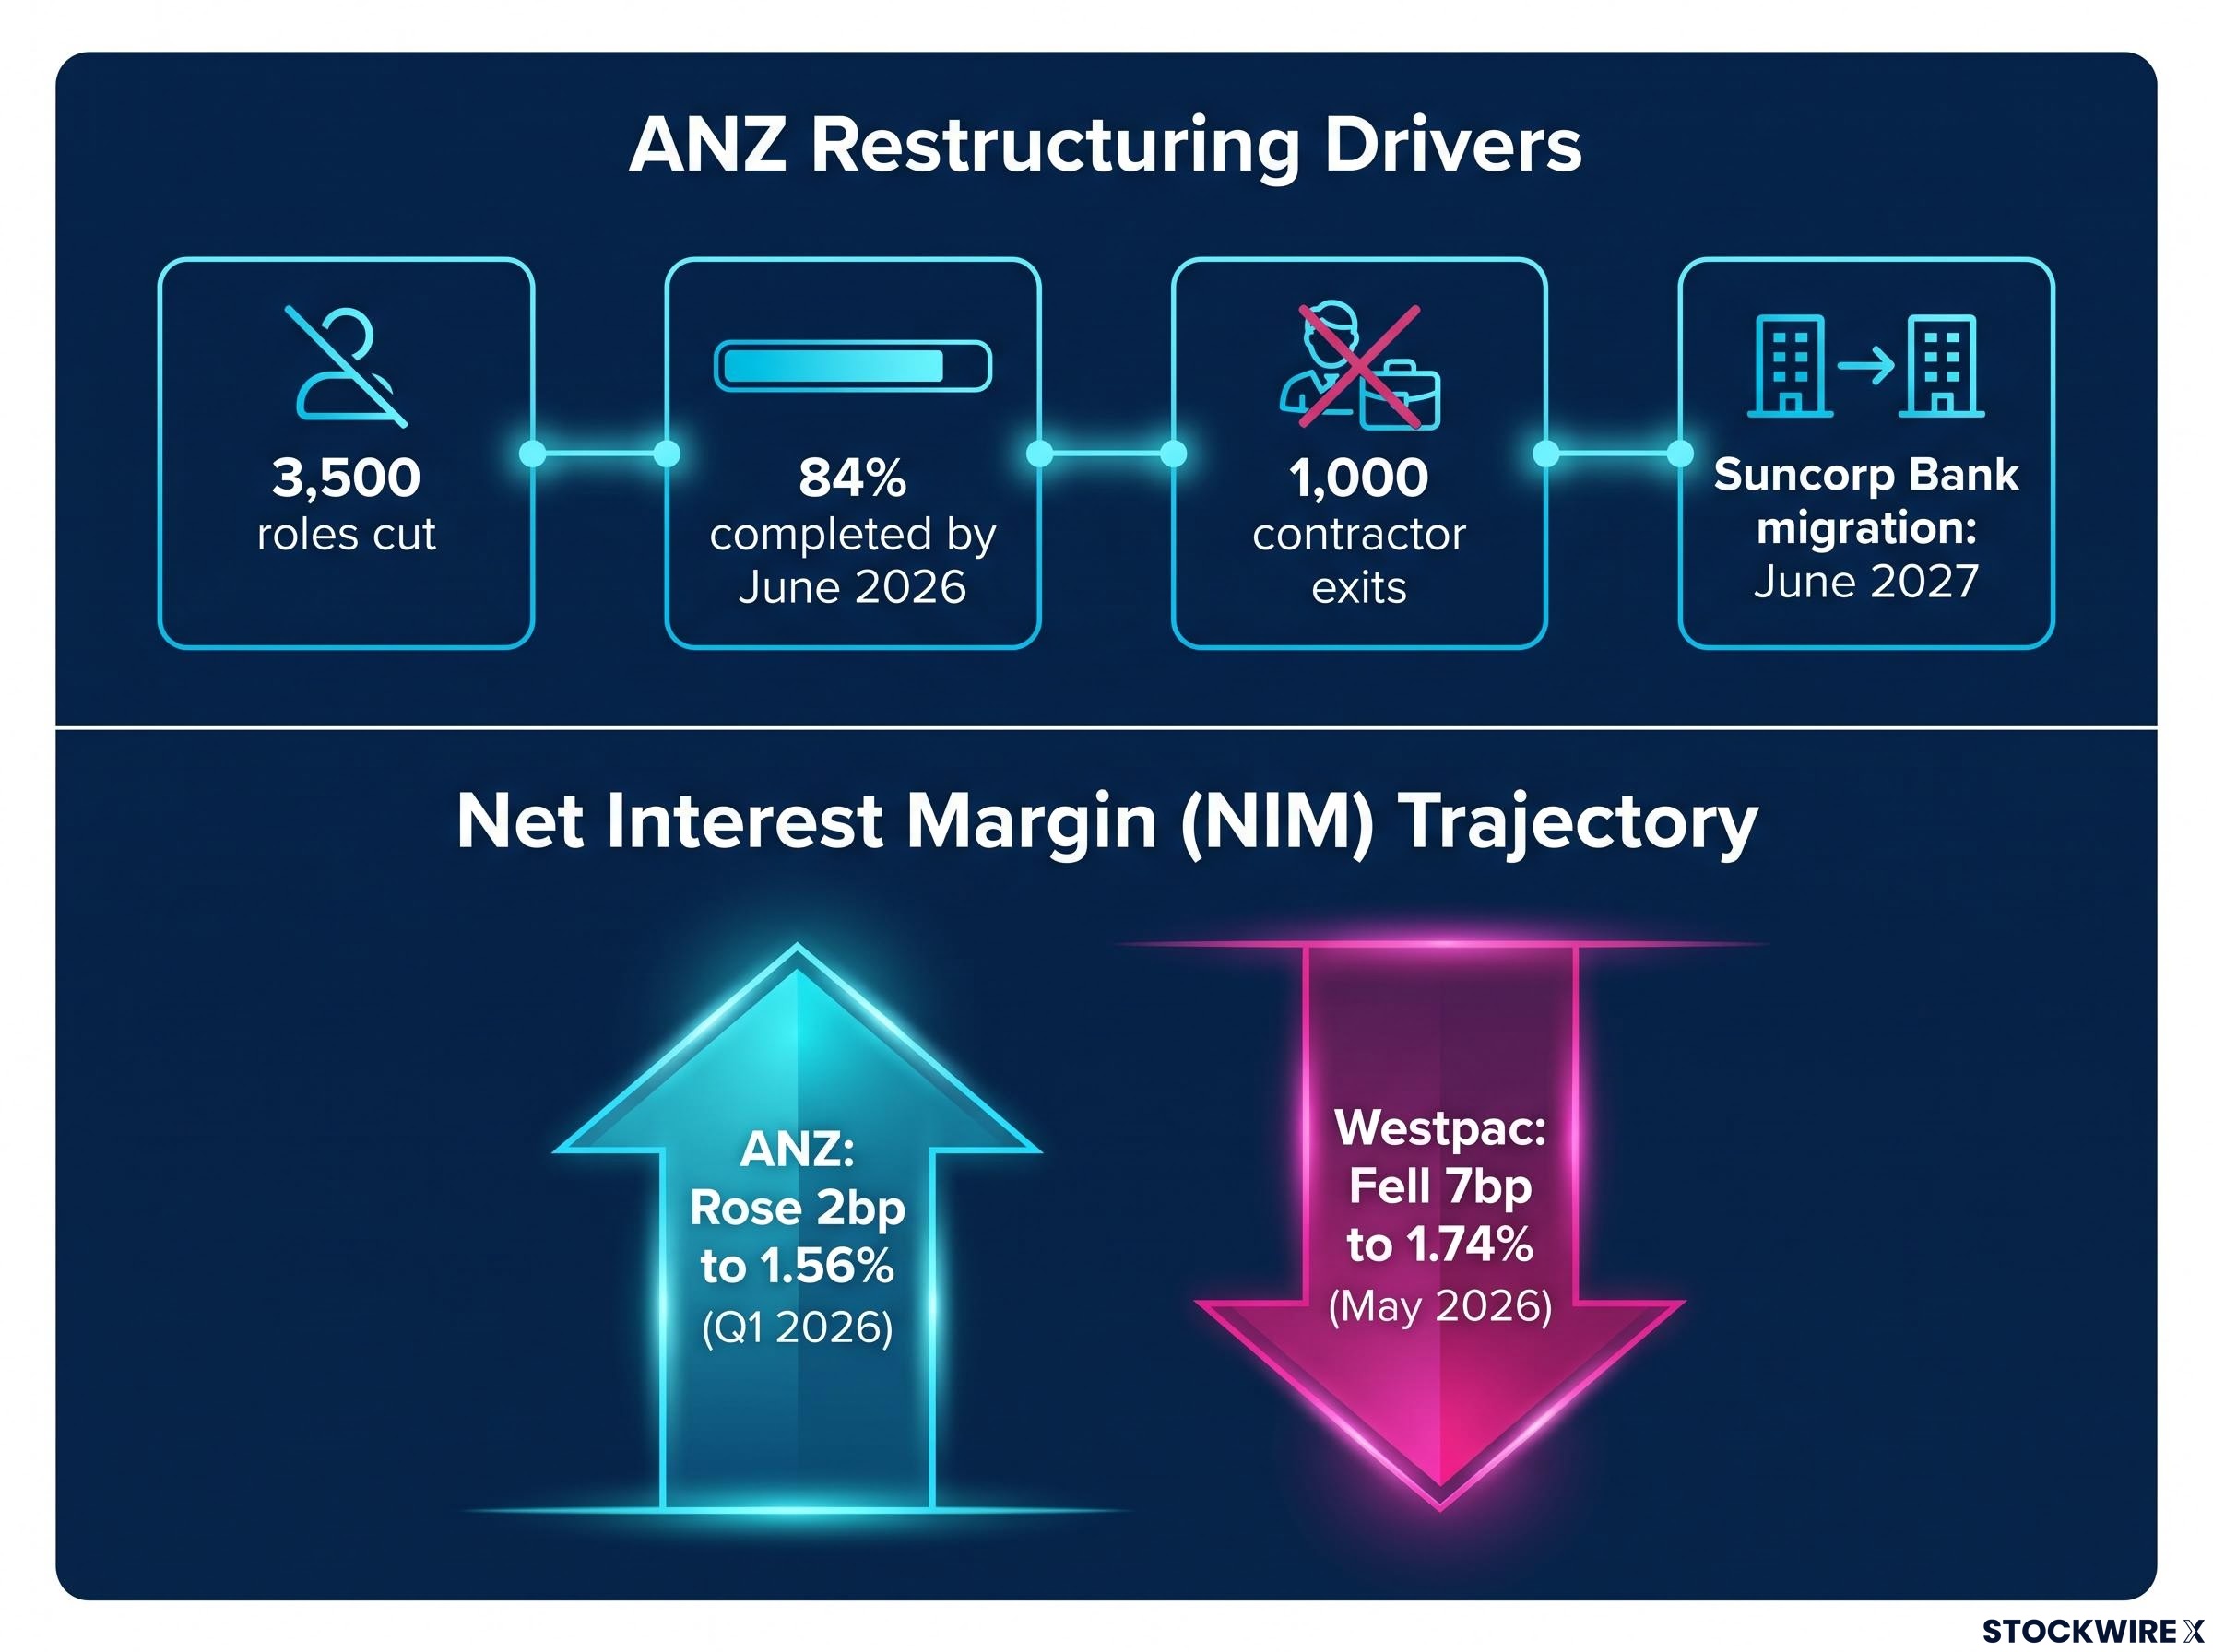
The rest is restructuring. ANZ is cutting 3,500 roles, with 84% of the FTE programme completed by June 2026, plus about 1,000 contractor exits. Suncorp Bank customer migration is targeted for June 2027. Margins have moved in ANZ’s favour too: its net interest margin (NIM), the gap between what a bank earns on loans and pays on funding, rose 2bp to 1.56% in Q1 2026, while Westpac’s fell 7bp to 1.74% at the May 2026 half-year.
Net interest margin pressure is sector-wide rather than bank-specific, with all four majors now expecting the RBA to hold at 4.35% through 2026, which limits how far any margin differences between ANZ and Westpac can persist.
ANZ’s capital ratio (CET1) sits near 12.4%, even after it halted the remaining roughly $800m buyback. Both banks also carry regulatory costs: ANZ a reported $240m ASIC-related penalty within FY25 significant items plus a $40m hardship penalty, and Westpac a $26m hardship penalty.
The drivers split two ways:
- Cyclical: mortgage competition, RBA rates, funding costs and housing demand, which affect both banks.
- Structural: restructuring, Suncorp integration and technology simplification, which could lift ANZ’s cost base and return on equity over several years.
| Source | ANZ view | Westpac view |
|---|---|---|
| Morgan Stanley | Sole Buy among the Big Four | Underweight |
| Citi | Buy; target about $39.25-$41.00 | No current note found |
| Morningstar | Valued below the priciest major banks | $30 fair value retained |
A valuation warning Morgan Stanley’s Richard Wiles cautioned that the major banks trade at high valuations relative to post-COVID averages despite less favourable conditions.
The ANZ rally means the market is paying today for savings that still have to arrive. If you buy ANZ, you are buying an execution story, not a proven earnings lead.
A framework for choosing between two near-identical banks
Rather than a verdict, apply three lenses to your own situation:
- Valuation: ANZ trades near 19.4x earnings; Westpac near 16.6x to 17.0x.
- After-tax income: on $5,000, ANZ pays about $215 to $225 at 70% to 75% franking; Westpac about $220 to $225, fully franked.
- Momentum and execution risk: ANZ has the price strength, but it depends on delivery.
| Lens | ANZ leans | Westpac leans |
|---|---|---|
| Valuation | Higher multiple | Cheaper on earnings |
| After-tax income | Partial franking | Fully franked |
| Momentum and execution | Positive momentum, turnaround upside | Weaker momentum, margin pressure |
If your tax rate and income needs reward franking, Westpac’s profile fits. If you can tolerate execution risk for recovery upside, ANZ’s case is stronger. The source author’s ANZ preference is one opinion; this analysis backs neither bank.
Term deposit alternatives paying 5.00-5.10% currently exceed both banks’ cash yields, so the case for either share rests on franking benefits, tax bracket and the liquidity that fixed-term products cannot provide.
Risks that apply to both banks
- Valuation: forecasts often assume unusually low bad debts.
- Credit quality: Reuters reports mortgages make up about 60% of the Big Four’s combined credit books, and arrears and provisions are rising from benign levels.
- Mortgage competition: discounting wins volume but cuts new-business margins. Westpac’s payout ratio of about 76% also leaves less buffer.
- Concentration: one $5,000 position ties you to a single balance sheet. Splitting across both reduces bank-specific risk, but not sector risk.
Weighing turnaround upside against franked income
Westpac offers a cheaper valuation and fully franked income. ANZ offers momentum and recovery potential, at a higher multiple and with lower franking.
A cheaper bank is not automatically the better short-term investment, since valuations can stay depressed while margins are questioned. Strong momentum can also reverse if promised savings fail to appear.
The markers to watch are ANZ’s cost-saving delivery and Suncorp migration through June 2027, both banks’ net interest margins, and credit-quality trends. Before investing, check live prices, confirm franking levels in each bank’s own announcements, and weigh your personal tax position or seek licensed advice.
This article is for informational purposes only and should not be considered financial advice. Investors should conduct their own research and consult with financial professionals before making investment decisions. Past performance does not guarantee future results. Financial projections are subject to market conditions and various risk factors.