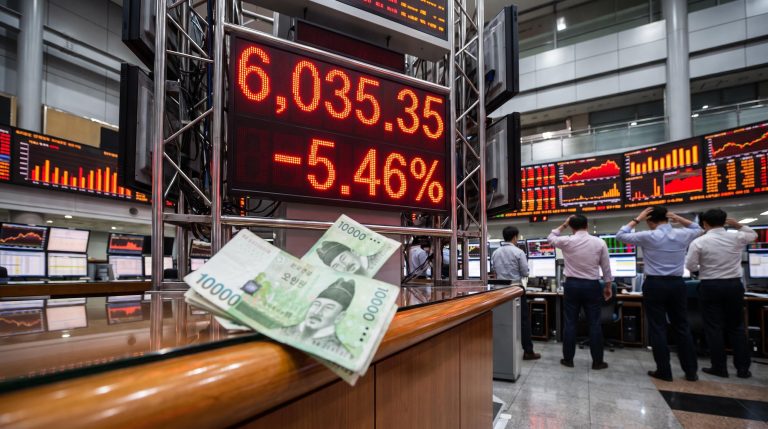
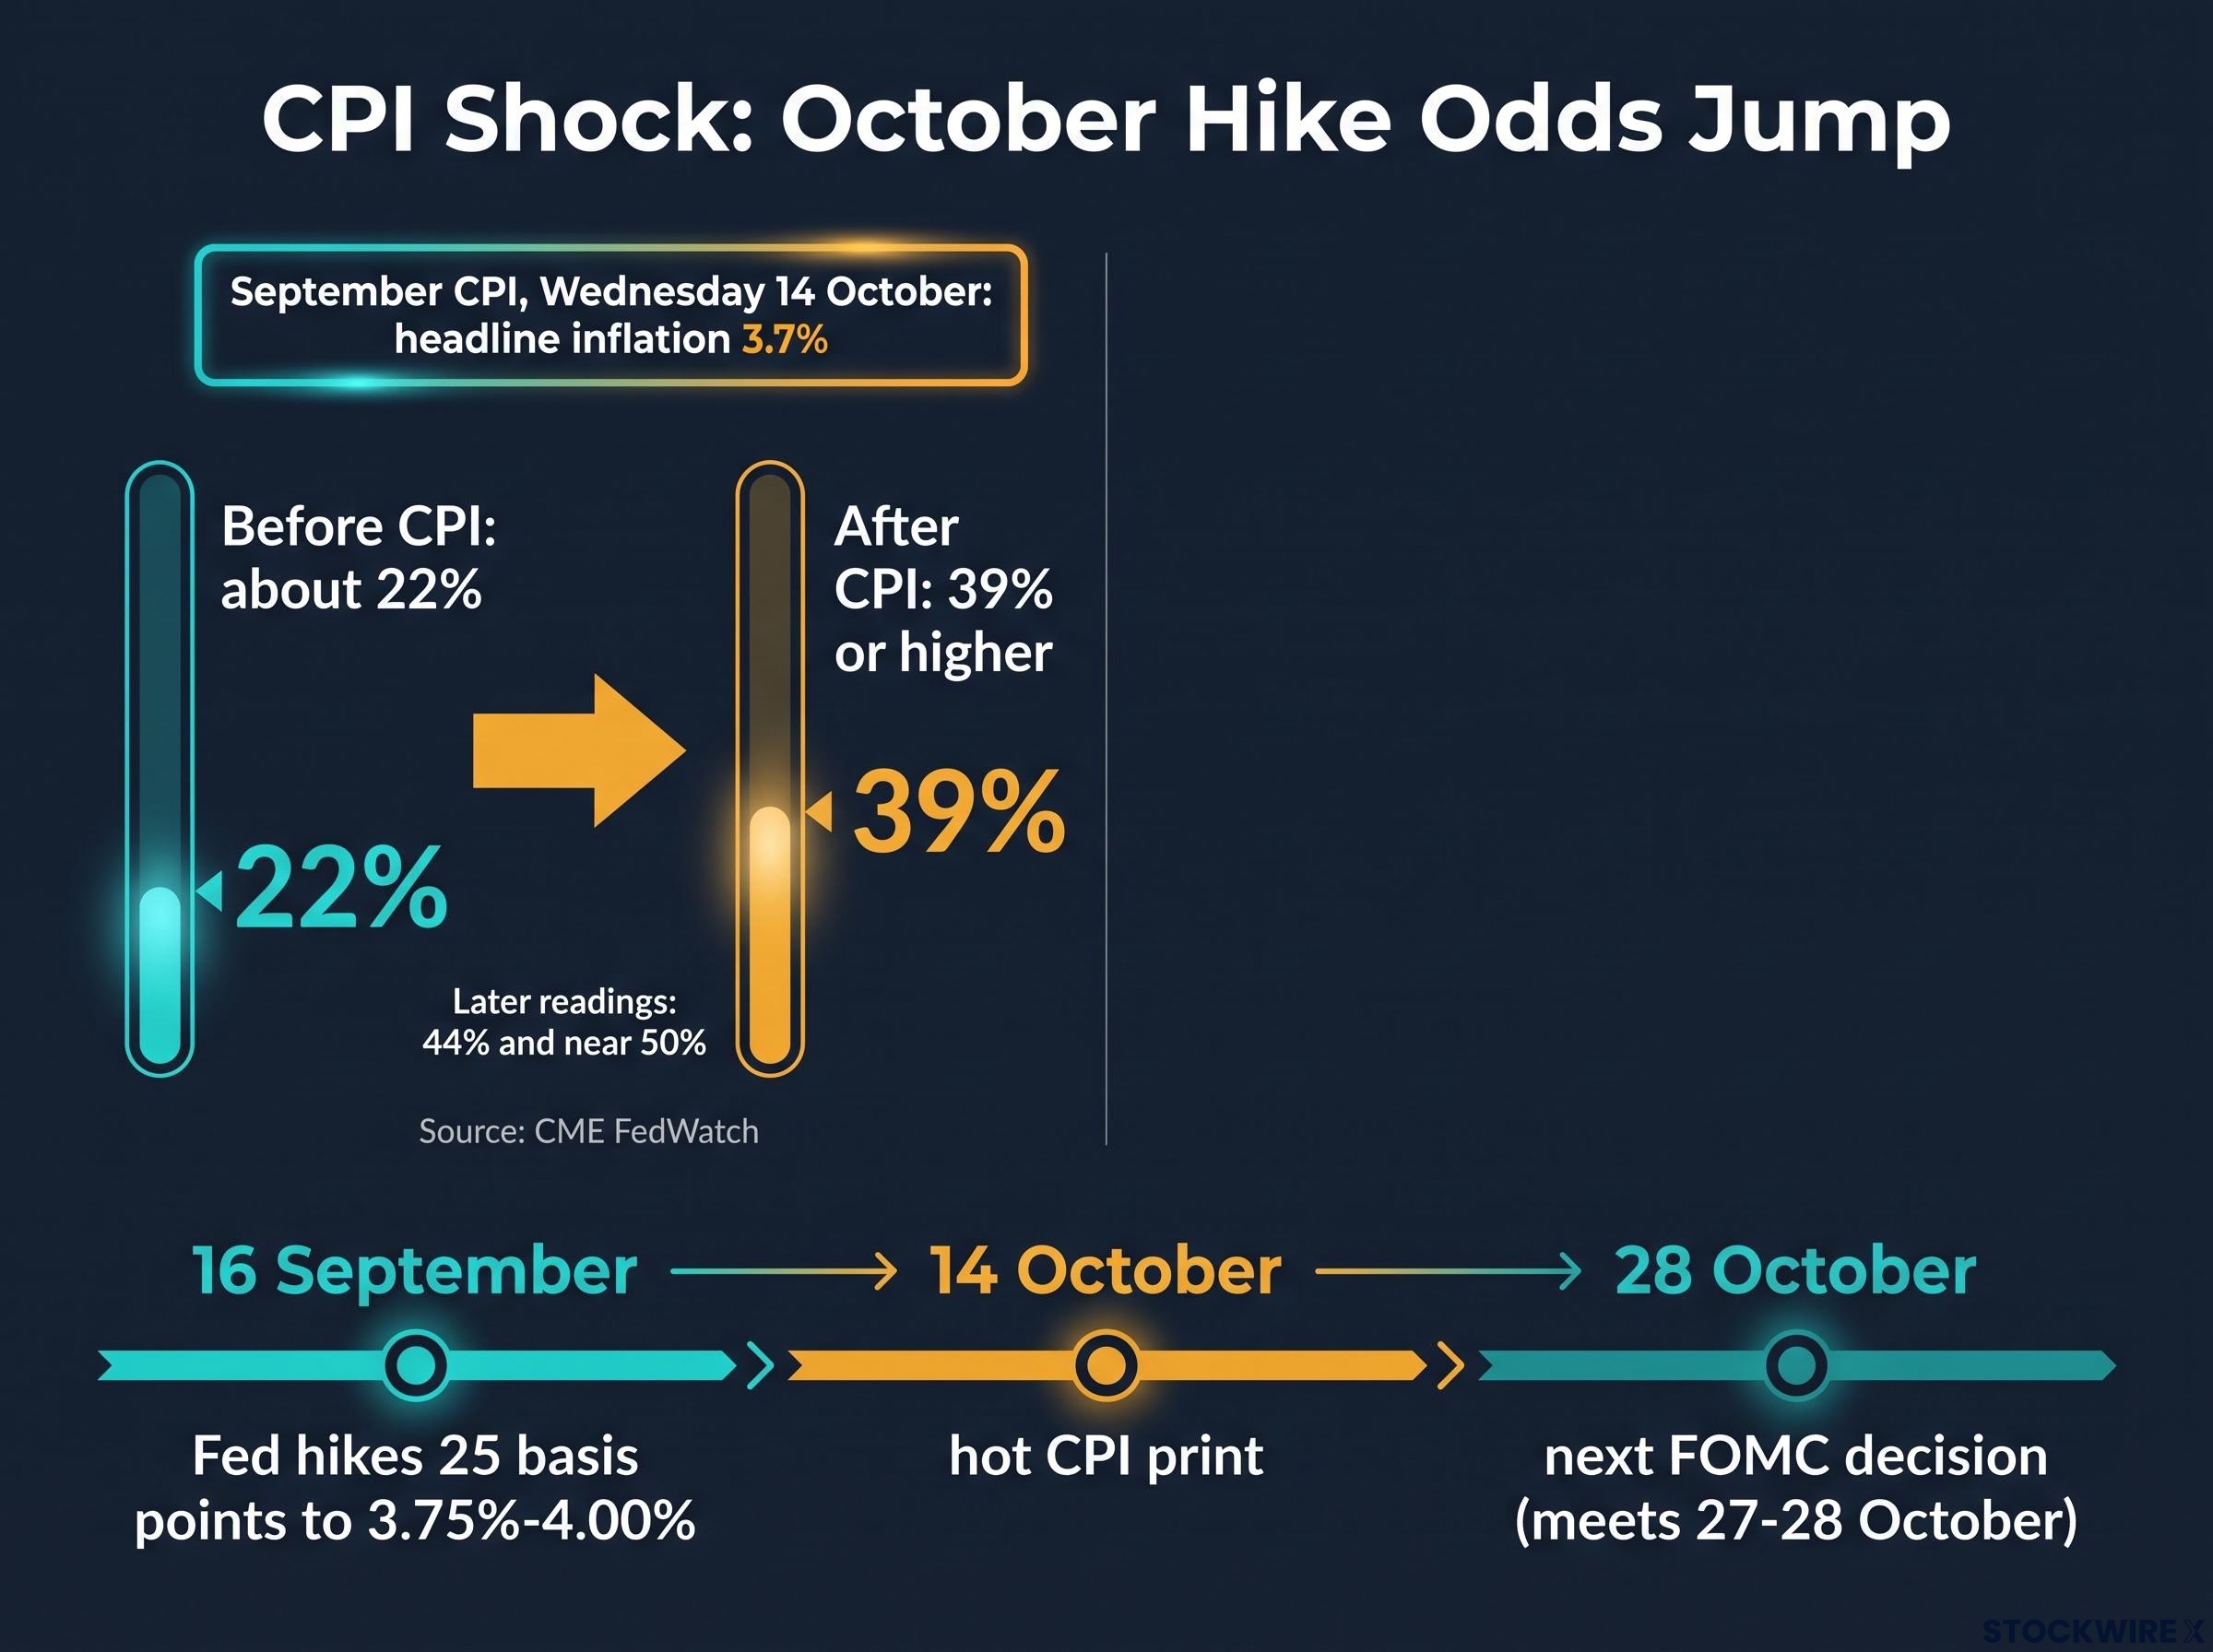
A hotter-than-expected September CPI report on Wednesday 14 October roughly doubled the market’s odds of a Federal Reserve rate hike this month. Headline inflation climbed to 3.7%, and futures-implied odds of an October hike jumped from about 22% to roughly 39% or higher within hours.
The timing matters. The Fed raised rates by 25 basis points on 16 September to a range of 3.75%-4.00%. A basis point is one hundredth of a percentage point. The next decision lands on 28 October.
Until this morning, the argument for a pause looked comfortable. September payrolls had barely grown, and the Fed’s preferred inflation gauge had cooled.
This covers what the Consumer Price Index (CPI) actually showed, how the Fed’s options have shifted, and what the reading could mean for your bond and stock holdings.
How did markets react to the hot inflation print?
Everything moved at once. Stock futures turned negative as soon as the Bureau of Labor Statistics (BLS) published the data, the S&P 500 opened lower, Treasury yields climbed and the US dollar pushed to an 18-month high.
The signal that mattered most came from rate futures. According to CME Group’s FedWatch tool, odds of an October hike had drifted down in previous weeks after softer growth, inflation and jobs figures. That retreat reversed in a single morning.
The Nasdaq’s steeper fall stands out. When technology shares drop harder than the broad market, investors are treating the data as a rates story. Higher yields hit long-duration growth stocks hardest, because their value rests on profits expected years from now.
Rising yields hit equities through the discount-rate channel, which shrinks the present value of future cash flows and lowers price-to-earnings multiples even when earnings are unchanged.
| Asset or measure | Reported reaction | Source / note |
|---|---|---|
| S&P 500 | Down about 0.9%-1% | CNBC reported 0.9% |
| Nasdaq Composite | Down about 1.1%-1.3% | CNBC reported 1.3% |
| 10-year Treasury yield | 5.248%-5.314% | Investing.com 5.248% early (up 3.1 bp); CNBC 5.293%; Reuters-related 5.314% |
| US dollar index | Up about 0.55% to 102.75 | 18-month high |
| October hike probability | From about 22% to 39%-50% | CME FedWatch via Investing.com 39% early; later CME/LSEG readings 44% and near 50% |
The spread of figures does not mean anyone got it wrong. Yields and probabilities shift minute by minute, and each vendor captured a different moment. The direction is not in doubt. The precise number depends on when you looked.
When big ASX news breaks, our subscribers know first
Hike or hold: what the Fed now has to weigh before 28 October
The Federal Open Market Committee (FOMC), the Fed’s rate-setting body, meets on 27-28 October. It faces a harder call than it did a day ago.
With the Fed having dropped forward guidance, inflation prints now carry more weight in setting rate expectations, which helps explain why one CPI report could double hike odds in a single morning.
The case for another hike
Core CPI strips out volatile food and energy prices, and it refused to cool. It rose 0.3% for the month against 0.2% expected, and 2.6% annually against 2.5%.
- Core held firm: The underlying trend shows no clear disinflation, a point Joseph Brusuelas of RSM US made after the release.
- Shelter accelerated: Housing costs rose faster than in August, suggesting services inflation has not settled.
- Energy could spread: Robert Sockin of PGIM warned that persistent oil prices may feed into non-energy categories.
- Credibility: Brusuelas expects one more 25 bp hike before year end, while Robin Brooks of Brookings said an October move is back in play.
The case for holding
The opposing camp argues that the inflation driving this print sits largely outside the Fed’s reach.
- Gasoline dominance: Fuel accounted for over half the monthly headline rise, and interest rates cannot produce more oil.
- A weak jobs market: Payrolls rose just 29,000 in September after a revised 133,000 in August.
- Softer PCE: August headline personal consumption expenditures (PCE) inflation slowed to 3.4% from 3.7%, and core PCE eased to 3.0% from 3.3%.
- Supply shocks: Ross Gerber of Gerber Kawasaki said higher rates will not stop energy-driven inflation, and Charlie Ripley of Allianz Investment Management cautioned against a more aggressive Fed.
Jamie Cox of Harris Financial framed the risk as the Fed repeating its earlier “transitory” mistake in reverse. And the Fed’s own officials had leaned towards patience just before this data arrived.
New York Fed President John Williams said after the September increase that there was “no need for urgency,” and that policymakers had time to gather more information.
With strong arguments on both sides, treat the hike odds as a moving estimate rather than a forecast. The next round of jobs and inflation data could swing them either way.
Is this just gasoline, or is inflation broadening?
At first glance, the answer looks simple. Energy prices jumped 5.2% in September, and gasoline alone rose 9.1%, contributing 0.337 percentage points to the monthly headline gain.
Headline CPI reached 3.7% annually, above the 3.6% forecast and up from 3.4% in August. The index rose to 336.940.
The fuller picture is less tidy. Shelter, used cars and airfares all firmed, and those categories kept core at 0.3%.
Energy costs can also leak into core through airfares, delivery charges and imported goods, which CPI classifies outside the energy category, so the gasoline-versus-broad-inflation split may understate the energy effect.
| Category | Monthly change | 12-month change | Contribution to headline |
|---|---|---|---|
| Energy | +5.2% | +20.4% | 0.377 pp |
| Gasoline | +9.1% | +34.2% | 0.337 pp |
| Shelter | +0.4% (from 0.3%) | +3.2% | 0.138 pp |
| Used cars and trucks | +0.7% | -1.5% | 0.018 pp |
| Airline fares | +1.2% | +22.4% | 0.013 pp |
Ripley put shelter’s contribution at roughly 0.15 points, but that figure measures the core print. The BLS 0.138 figure measures the headline, so the two are not in conflict.
Analysts split on what the mix means:
- Charlie Ripley (Allianz Investment Management): Gasoline drove the headline, and he does not see shelter as a lasting trend.
- Danni Hewson (AJ Bell): Gasoline was the main driver.
- Jeffrey Roach (LPL Financial): Pressures are widening, and the “last mile” back to target could stay difficult.
- Robert Sockin (PGIM): Oil may seep into non-energy prices.
- Joseph Brusuelas (RSM US): Trade, energy and AI supply shocks are pushing inflation up.
The honest reading is mostly energy, but not only energy. If gasoline is the main story, inflation could fade when oil does. If shelter and services keep firming, you should expect rates to stay higher for longer regardless of oil.
What the hot print means for bonds, stocks and your portfolio
The mechanics run through yields. With the 10-year Treasury above 5.25% and reported near 5.31%, borrowing gets more expensive and future profits are worth less in today’s dollars.
Jeff Schulze of the Franklin Templeton Institute described the report as a modest headwind for risk assets. He pointed to higher rate expectations at the long end, a stronger dollar and pressure on valuations.
The main sensitivities to weigh against your holdings:
- Bonds: Longer-dated bonds lose more value as yields rise.
- Equity valuations: Higher discount rates compress price-to-earnings multiples.
- Growth and tech: The Nasdaq’s underperformance shows where yield pressure bites first.
- Earnings: Energy, transport and financing costs could squeeze margins. Hewson said cost-of-living pressure is already appearing in corporate results.
- Consumers: Pricier fuel cuts real income and discretionary spending.
- Policy error: A hike could hurt demand if the energy surge fades, while a hold could let inflation entrench.
- Politics: This is the last major consumer-price report before the midterms, and Hewson noted President Trump will be aware of rising yields.
Analysts are testing a 1970s-style scenario in which energy inflation spreads into wages and expectations. No named commentator cited a specific prior hiking cycle as a guide.
Positioning themes analysts are discussing
Market moves have favoured shorter-duration fixed income, caution on highly valued growth stocks and selective exposure to companies with pricing power or energy links. No single allocation suits every investor, and this is not a recommendation. Conditions could change before 28 October.
Either path carries risk, so you should expect volatility around the decision whichever way it goes.
For readers wanting a defensive framework, our full explainer on positioning around Fed hike odds covers shortening bond duration into T-bills ahead of a decision.
What to watch between now and the 28 October decision
The September CPI report showed an energy-led headline, but core and shelter firmed enough to reopen a decision that had looked settled. The evidence still points both ways.
Four variables will move the odds over the next two weeks: further inflation and jobs data, the path of oil prices, comments from Fed speakers and shifts in futures-implied hike probabilities. Probabilities and yields will keep varying by source and time, so focus on the direction rather than any single reading.
Your exposure to long-duration bonds and highly valued growth stocks is the part of your portfolio most tied to how the Fed weighs these signals.
This article is for informational purposes only and should not be considered financial advice. Investors should conduct their own research and consult with financial professionals before making investment decisions. Past performance does not guarantee future results. Financial projections are subject to market conditions and various risk factors.