The US dollar jumped about 0.69% to roughly 102.90 on Wednesday, its strongest level since April 2025. The dollar index rally followed a September consumer price report that ran hotter than forecast in the place the Federal Reserve watches most closely.
The repricing was fast. Traders roughly doubled the odds of a Fed rate hike at the 28 October meeting, from about 22% before the release to between 40% and more than 50% at points during the session.
The timing is what makes the move stand out. A day earlier, New York Fed President John Williams said one more hike was likely in 2026 and none would be needed in 2027. Within 24 hours, futures traders were pricing a faster path than that guidance implied.
Here is what drove the move, how durable it looks on the charts, and which releases between now and the October Fed meeting could confirm or undo it.
Why did a 0.3% core reading move the dollar this much?
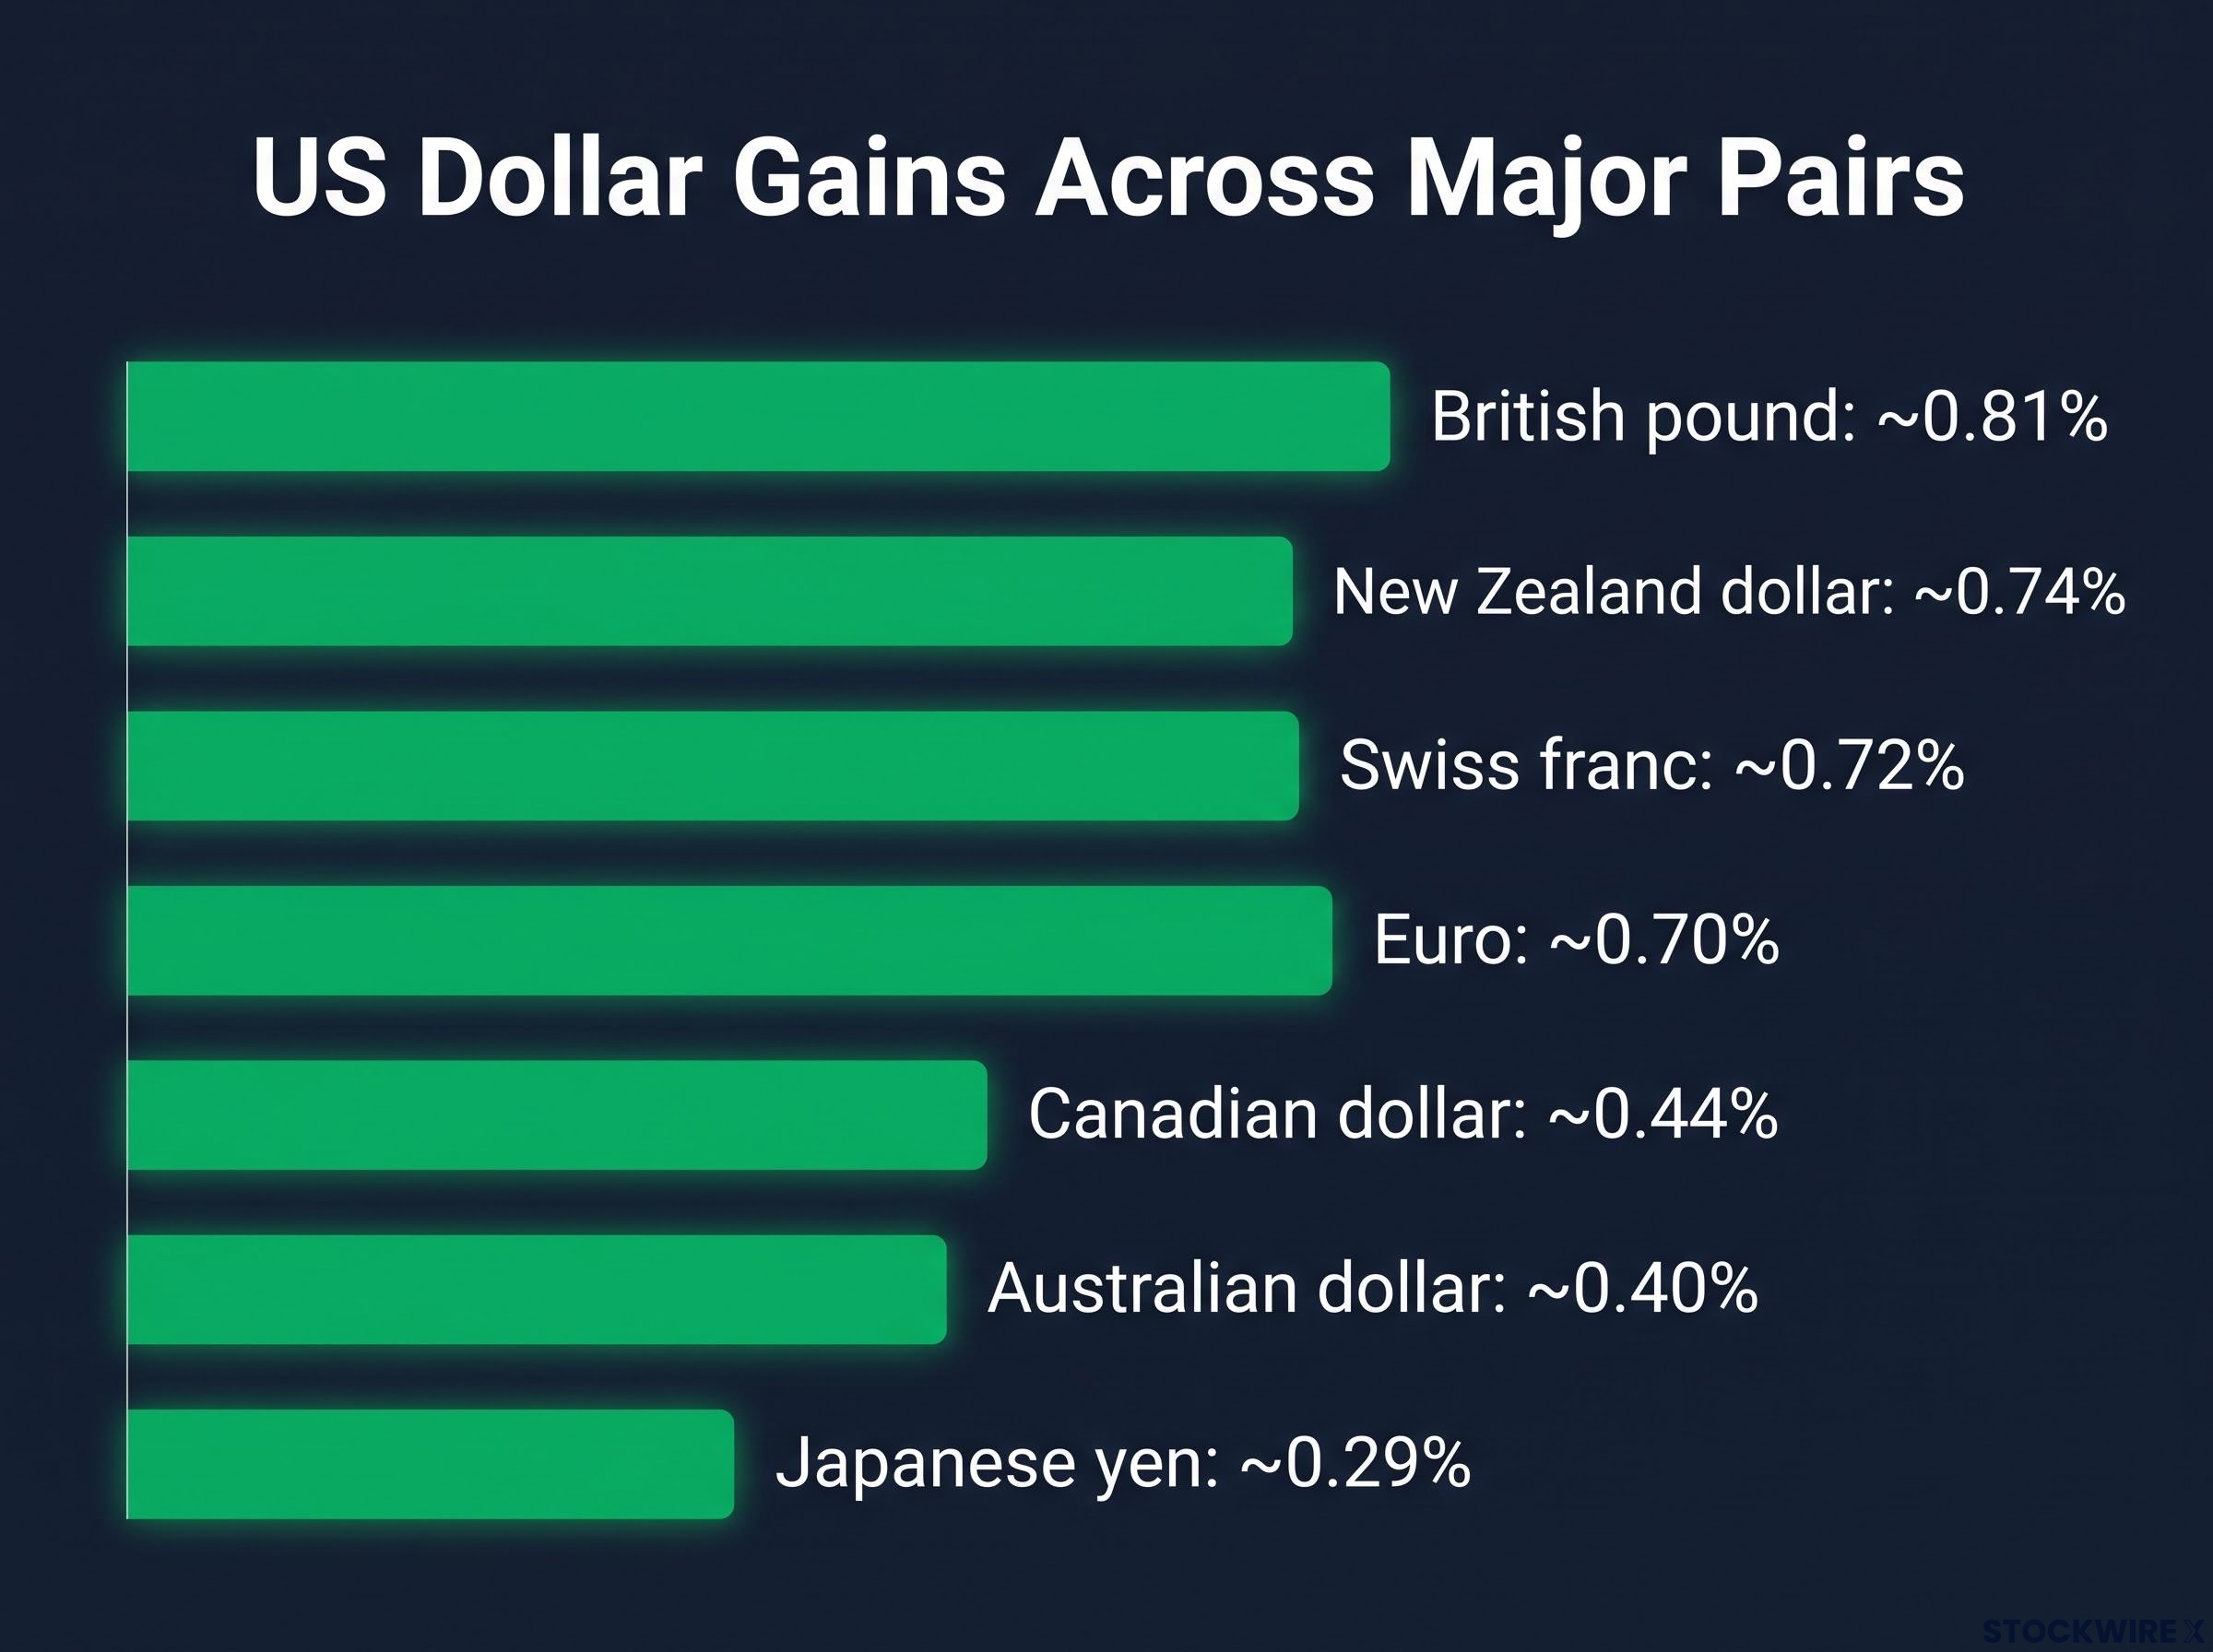
The move showed up across every major pair. The US Dollar Index (DXY), which tracks the dollar against a basket of six major currencies, gained ground against all of them.
- British pound: ~0.81%
- New Zealand dollar: ~0.74%
- Swiss franc: ~0.72%
- Euro: ~0.70%
- Canadian dollar: ~0.44%
- Australian dollar: ~0.40%
- Japanese yen: ~0.29%
Behind that breadth sat a miss of just one-tenth of a percentage point. The Consumer Price Index (CPI) measures changes in the prices households pay. Headline CPI matched forecasts on the month, and the surprise came in core CPI, which strips out volatile food and energy prices.
| CPI measure | September | Consensus | August |
|---|---|---|---|
| Headline, m/m | +0.6% | +0.6% | +0.4% |
| Headline, y/y | +3.7% | +3.6% | +3.4% |
| Core, m/m | +0.3% | +0.2% | +0.3% |
| Core, y/y | +2.6% | +2.5% | +2.4% |
That one-tenth matters to you because the Fed sets policy around underlying inflation, not swings in petrol prices. Markets read the core beat as a signal about policy rather than a one-off.
The Fed policy framework, built on a 2% PCE inflation target and a 12-member voting committee, explains why a single core CPI tenth can reshape rate expectations so quickly across futures markets.
Where the surprise sat: energy versus core
Energy did the heavy lifting in the headline. It rose 5.2% on the month and added 0.377 percentage points, while gasoline jumped 9.1% and accounted for more than half of the monthly increase. That is the part of the report most likely to reverse.
Core told a stickier story. Shelter rose 0.4%, up from 0.3% in August, and contributed 0.138 points. Used vehicles gained 0.7% on the month but remain 1.5% lower than a year ago. Food was flat on the month and up 2.5% year on year, so it shaped the annual rate rather than September’s surprise.
When big ASX news breaks, our subscribers know first
How hot CPI turned into Fed hike bets and higher Treasury yields
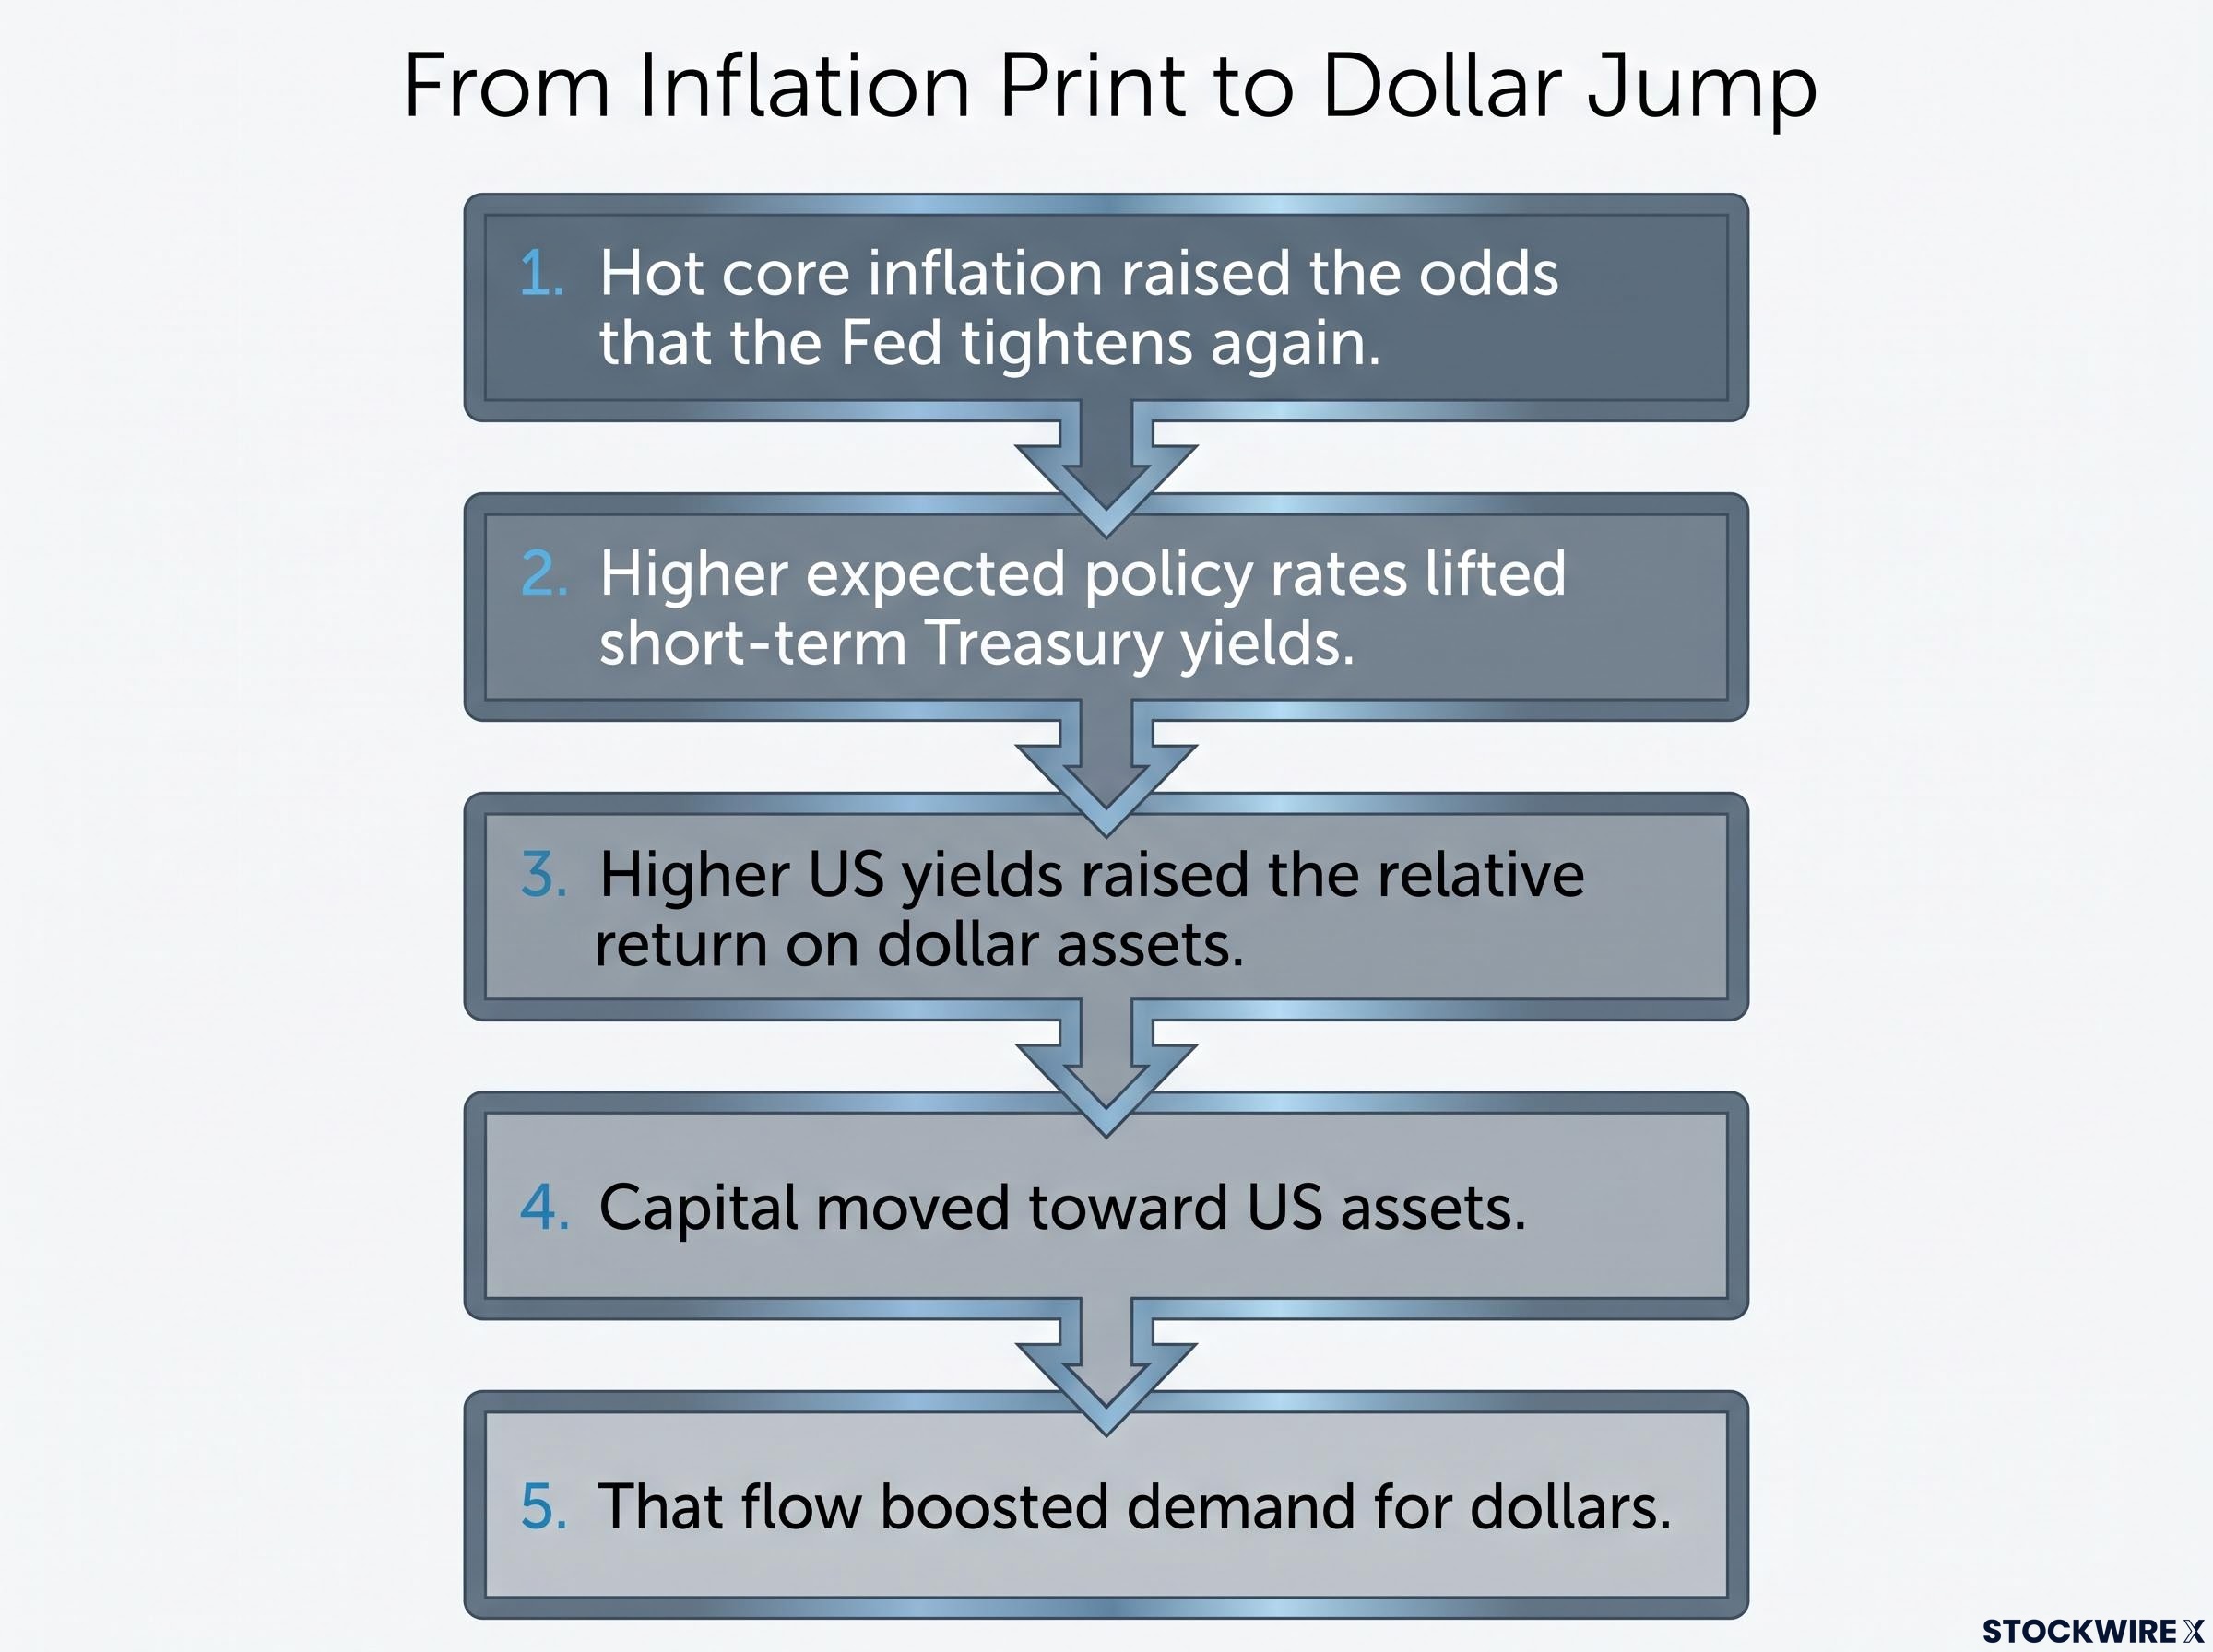
The dollar’s jump was the final link in a chain that started with the inflation print.
- Hot core inflation raised the odds that the Fed tightens again.
- Higher expected policy rates lifted short-term Treasury yields.
- Higher US yields raised the relative return on dollar assets.
- Capital moved toward US assets.
- That flow boosted demand for dollars.
The second step moved fastest. According to CME FedWatch data cited by CNBC, October hike odds rose to 43.7% from 22.1% the previous day.
October hike odds From roughly one-in-five before the release to 40%-50%+ afterward.
Estimates differed because fed funds futures, contracts that let traders bet on the Fed’s policy rate, repriced throughout the session.
Futures pricing swings of this size are not unusual, with October hike odds having moved from under 9% in late August to a 73% peak in September before Williams’s remarks pulled them back.
| Source | 28 October hike probability |
|---|---|
| CME FedWatch (via CNBC) | 43.7%, up from 22.1% |
| MarketWatch/Bloomberg | 45%-46% |
| CNBC, later intraday | 53.7% |
| Prime Terminal | About 42%, up from about 22% |
CNBC also put the probability of at least one more hike before year-end above 95%, with about 40% odds that rates finish the year 50 basis points higher. A basis point is one-hundredth of a percentage point. Prime Terminal data suggested traders priced 54 basis points of tightening for 2027, though no independent source has confirmed that figure.
Yields followed. Charles Schwab put the two-year Treasury yield near 4.89%, and MarketWatch reported a rise of more than 10-12 basis points. The ten-year climbed about 7 basis points to roughly 5.27% from 5.20%. Prime Terminal snapshots showed smaller moves, likely because they were taken at different times.
The two-year moved more because it is most sensitive to near-term Fed decisions. That tells you the dollar is resting on a rate-differential story: the gains depend on Fed expectations holding, not on any confirmed shift in inflation. Williams has not commented since the release.
Is the dollar index rally overbought, and where is support?
On the charts, the trend looks strong. According to AI-assisted technical analysis from FXStreet, the index sat at 102.87, well above the cluster of 50, 100 and 200-day simple moving averages (SMAs, the average closing price over those periods) near 100.25.
| Technical level | Value | Role |
|---|---|---|
| Medium-term trend line | 102.87 | Immediate support being tested |
| Long-term trend line | 101.84 | Next support below |
| 50/100/200-day SMA cluster | ~100.25 | Possible deeper pullback target |
| RSI(14) | 71.85 | Overbought signal |
The caution sits in that last line. The Relative Strength Index (RSI) measures the speed of recent price changes, and readings above 70 are considered overbought.
- Support: 102.87, then 101.84
- Deeper target: ~100.25
- Reference high: strongest level since April 2025
An overbought reading tells you the move has run ahead of the data. A soft print or Fed pushback could trigger a sharp giveback. These levels are technical context, not a forecast.
Overbought readings can persist for weeks when rate differentials drive the move, as in 2014-2015 and 2022, so the RSI signal alone says little about timing of any reversal.
What could extend or reverse the move before the October FOMC
The rally is done for the day. Whether it holds depends on what comes next.
| Event | Date | Why it matters |
|---|---|---|
| Beige Book | 14 October, 2:00 p.m. | Regional read on prices and activity |
| Warsh discussion with IMF’s Kristalina Georgieva | 15 October | Fed commentary after the hot print |
| FOMC meeting | 27-28 October | The hike decision itself |
| FOMC press conference | 28 October, 2:30 p.m. | Guidance on the path ahead |
Producer prices, retail sales, jobless claims and more Fed speakers are also due before the meeting, though exact dates have not been confirmed. MUFG had flagged that a repeat 0.3% core reading would revive expectations of back-to-back hikes.
The Fed rate hike outlook was already split before the CPI release, with sixteen of 18 officials pencilling in another increase this year while futures leaned toward an October hold.
The case against the rally is real:
- One month of data, with energy supplying over half the headline gain
- Gasoline could reverse quickly
- Used cars remain lower year on year
- Russell Investments strategist BeiChen Lin‘s pre-release baseline was an October skip and a December hike
- Williams still sees no 2027 hikes
A stronger dollar also has knock-on effects. It partly offsets import inflation, tightens financing for emerging markets and dollar borrowers, and makes US exports less competitive. The debate is whether this is a durable inflation shift or energy volatility plus a noisy core month, so watch core components rather than the headline.
What the dollar’s jump settles, and what it leaves open
The market’s verdict on September CPI was clearly hawkish: higher hike odds, a sharper rise in two-year yields and a dollar at its highest level since April 2025. What it does not settle is durability.
That depends on core inflation, labour data and how Fed officials frame the print before 27-28 October. If upcoming releases show firm core and shelter readings, the rate-differential support may persist. Softer data or Fed pushback could test the support levels that overbought conditions already leave exposed.
This article is for informational purposes only and should not be considered financial advice. Investors should conduct their own research and consult with financial professionals before making investment decisions. Past performance does not guarantee future results. Market pricing and projections are speculative and subject to change based on economic data and policy developments.