Paul Tudor Jones did not say stocks are too expensive. His warning that 2027 could be “really, really challenging” for the stock market, delivered on CNBC’s Squawk Box on 13 October 2026, rests on something more mechanical: the number of shares available to buy. One figure sits at the centre of that tension, roughly $1.7 trillion of stock that becomes eligible for sale as post-IPO lockups expire next year.
The timing matters. The S&P 500 closed near 7,805 on 13 October, a short distance from records around 7,844 set earlier in the month. Peaks are when famous warnings travel fastest, and they are also when headlines are hardest to separate from evidence.
The useful response is neither alarm nor dismissal. Here is a data-based method for judging any market warning, applied to the supply estimates behind Jones’s call and to what December 2027 options are actually pricing.
What is Paul Tudor Jones actually warning about, and how does equity supply work?
Jones’s claim in context
Jones, who built his reputation shorting the 1987 Black Monday crash and still runs Tudor Investment, framed the last four years of the bull market as a supply story. Buybacks and mergers absorbed shares faster than companies issued them, so share counts shrank and prices had support.
He expects that to reverse in 2027. The new supply, in his telling, comes from AI listings such as Anthropic and OpenAI, the SpaceX offering completed in June 2026, secondary raises to fund AI infrastructure, and lockup expiries. CNBC reported he also flagged a possible future reckoning over the widening US fiscal deficit.
Some outlets compared his view to the poor equity-flow conditions of roughly 2000-2002, though that comparison varied and has not been independently confirmed.
The five levers that move share supply
Five forces decide whether the pool of tradable shares grows or shrinks:
- New issuance: companies sell fresh shares, so investors must find extra capital.
- Lockup expiry: restricted shares held by insiders become tradable, raising the float (the shares available to trade) without raising new money.
- Buybacks: companies repurchase their own stock, shrinking supply.
- Cash M&A: a cash takeover retires the target’s shares from public markets.
- Stock-financed M&A: paying with shares adds supply and can cancel out buyback effects.
The net supply formula Net supply ≈ new issuance + shares released from lockup and actually sold, minus buybacks, minus shares removed through cash M&A.
Some drivers are structural, such as AI’s appetite for capital to fund data centres and chips. Others are cyclical: buybacks rise when profits and confidence are strong and fade when cash is redirected. Lockups typically end 90-180 days after an IPO, which creates a second wave. In 1999, IPOs approached 400 and, according to GMO, peaked near 5% of market capitalisation, a precedent that remains unverified.
What this gives you is a tool. Supply is a flow, and flows can be counted, so you can test Jones’s warning with numbers rather than accept or reject it on his reputation.
A swing from negative to positive net equity supply removes a structural price support that has underpinned US valuations for over a decade, and Bloomberg analysts already see Alphabet’s capital programme moving that balance.
When big ASX news breaks, our subscribers know first
How big is the 2027 supply wave, and can buybacks absorb it?
The most detailed counting so far comes from Goldman Sachs strategist Ben Snider, whose research was reported between 9 and 13 October 2026.
| Measure | 2026 | 2027 |
|---|---|---|
| Gross buybacks | ~$1.5T | ~$1.7T |
| Primary equity issuance | Earlier estimate ~$700B (superseded) | ~$600B (~0.8% of market cap) |
| IPO component | Not provided | ~$175B |
| Follow-ons, convertibles, SPAC-related | Not provided | ~$425B |
| Lockup value eligible for sale | Not provided | ~$1.7T |
| Net public-equity supply | Roughly flat | Largest increase since 2000 |
An August Goldman-related report put 2026 buybacks near $1.4 trillion; the October figure of $1.5 trillion is more recent.
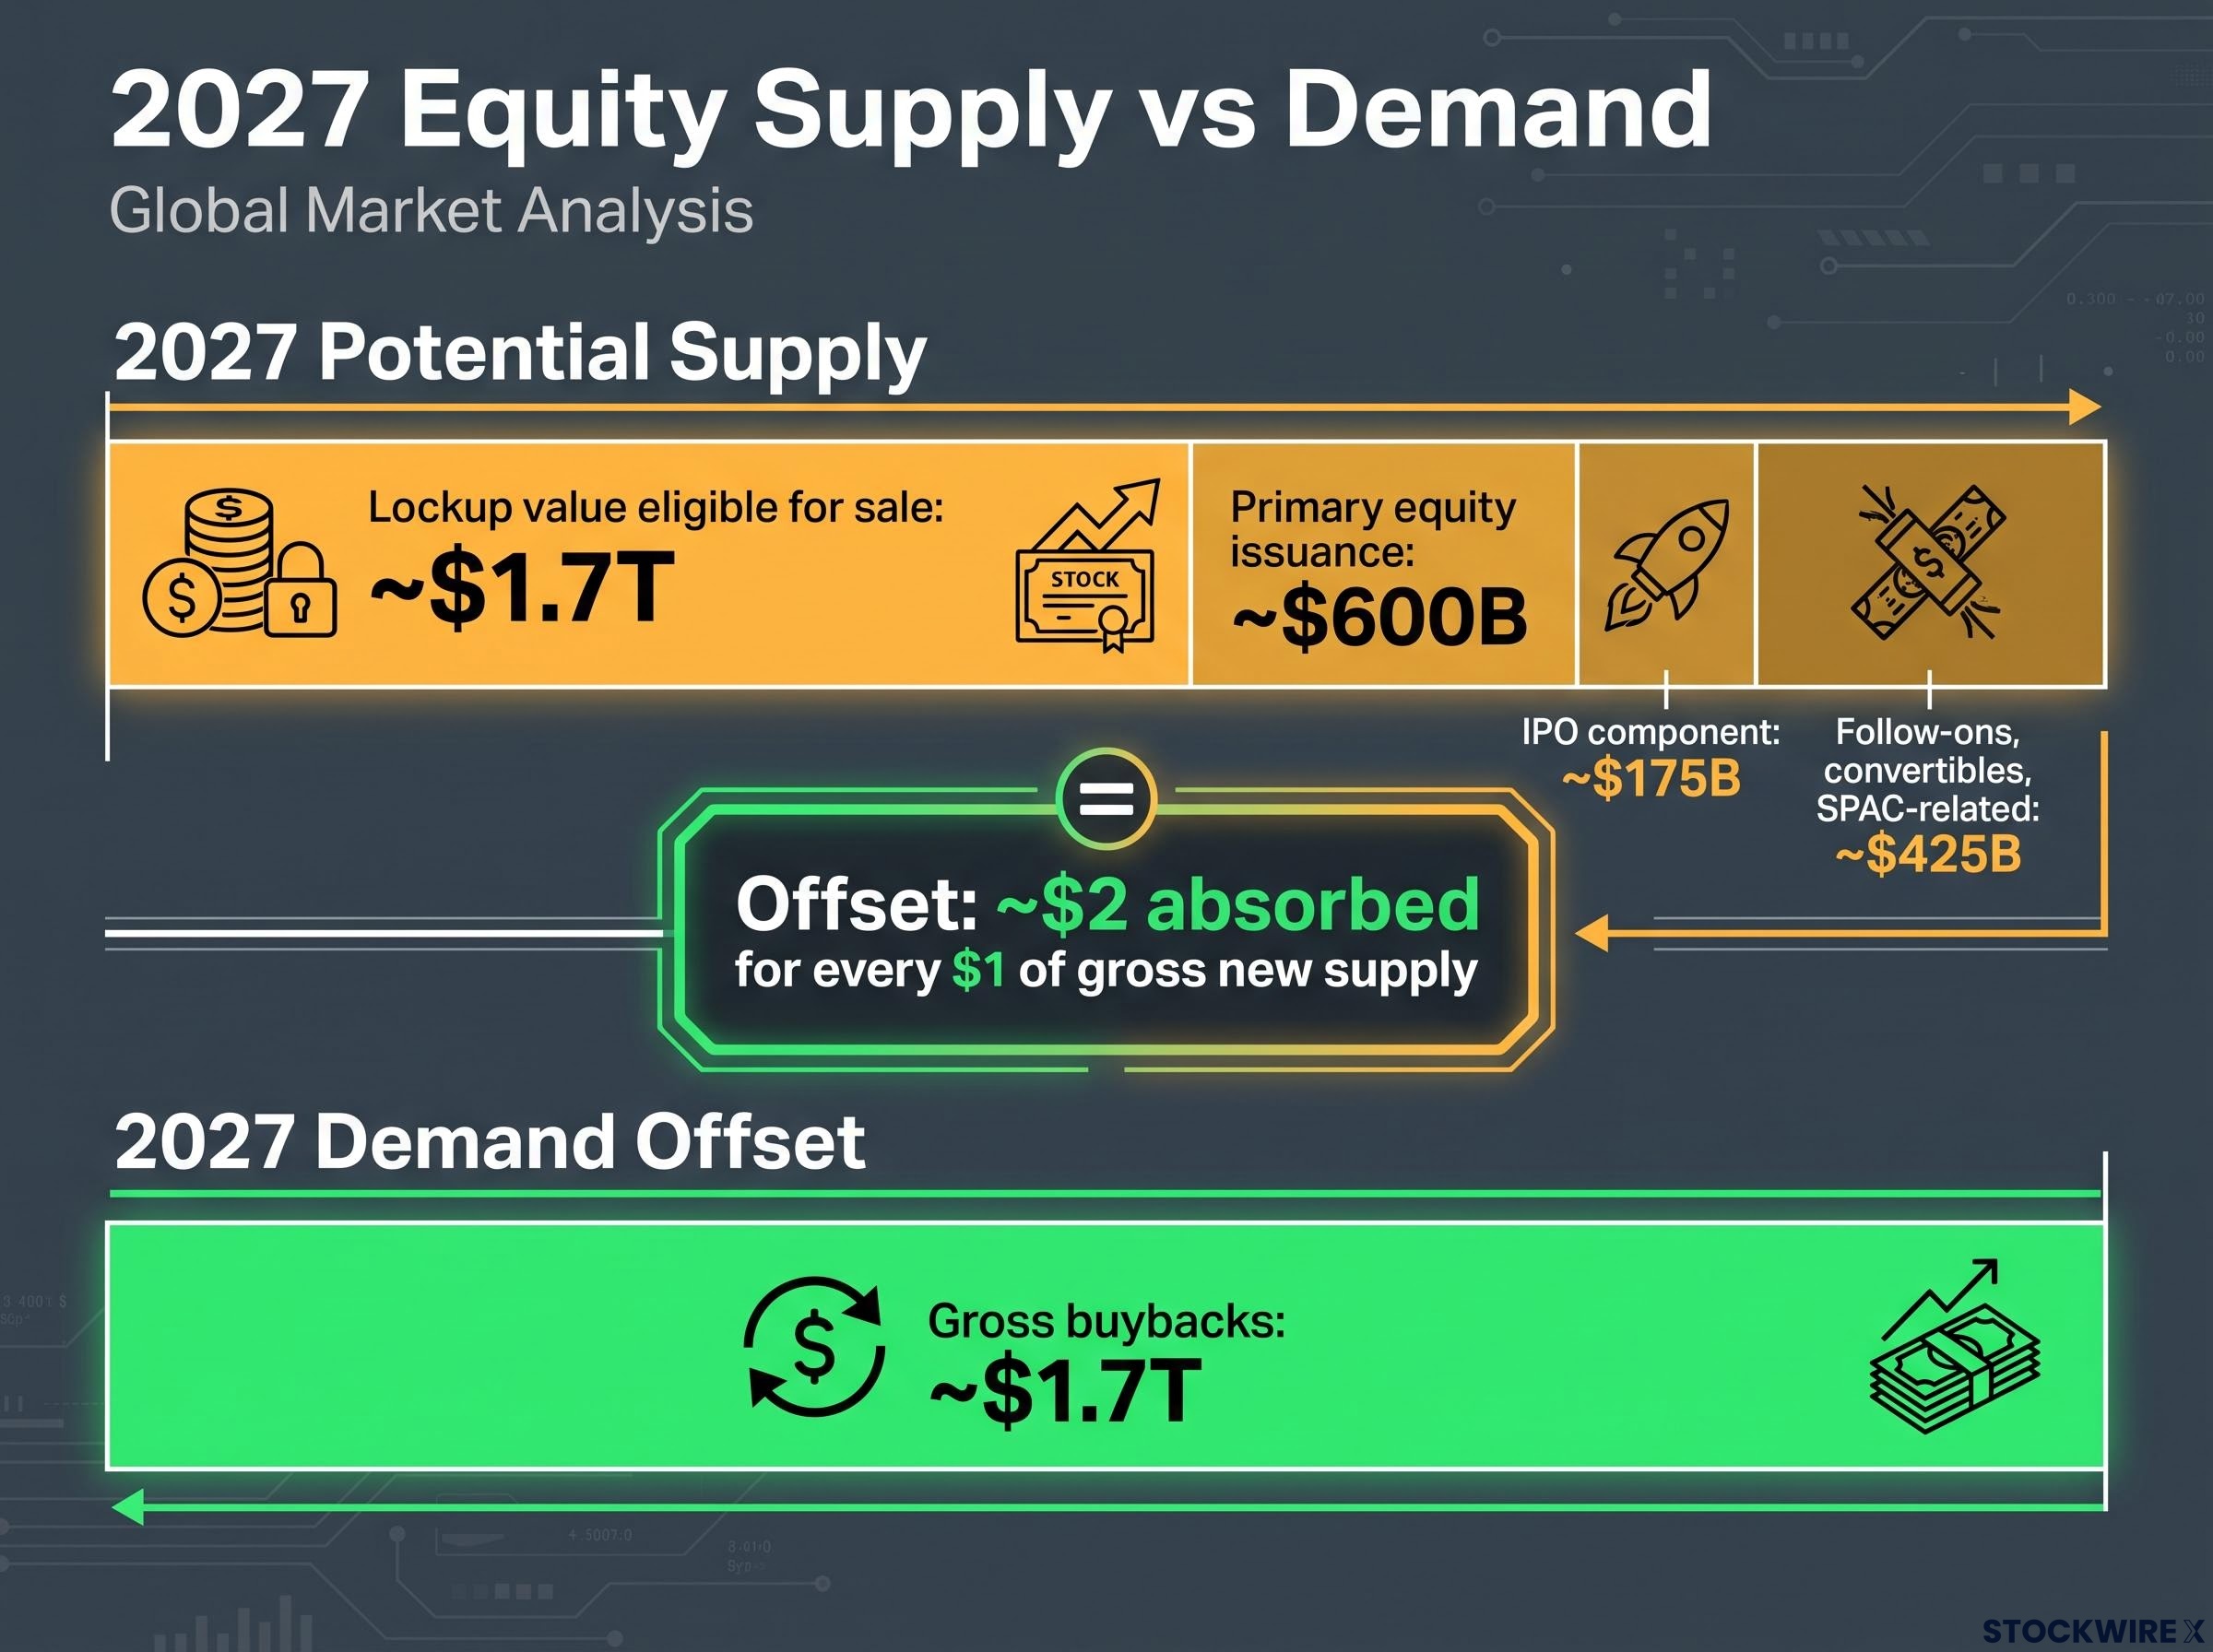
Read in sequence, the scale lands first. Goldman still expects the biggest rise in net public equity since 2000 once lockups are counted.
Then the offset arrives. Buybacks alone should exceed primary issuance by about $1.1 trillion in 2027, before cash M&A, which works out to roughly $2 absorbed for every $1 of gross new supply.
The lockup caveat The $1.7 trillion measures shares that can be sold, not shares that will be sold. Founders, employees and venture investors may hold, sell slowly or hedge.
Deal count is not the worry either. About 60 US IPOs had occurred by Goldman’s July analysis, against a 25-year median near 100 (unverified). The risk sits in dollar size, driven by a few very large listings.
GMO’s Q3 2026 analysis reads the same backdrop more darkly, suggesting supply may swing from shrinking about 1% a year to growing 5% or more. It also links a 1-percentage-point rise in IPOs’ market share to a roughly 4% price decline, a historical finding that is unverified.
The read for you: the wave is large in dollars but modest against market capitalisation. The real question is how much locked stock gets sold, and who is on the other side.
Which companies could swing the balance: SpaceX, OpenAI, Anthropic and the capex squeeze?
Aggregates hide concentration, and a handful of names can drag the total away from the tidy averages.
| Company | Role | Key figure | Status |
|---|---|---|---|
| SpaceX | Supply | ~$75B raised at ~$1.75T valuation; 12.9B shares scheduled for release by mid-2027 | Listed June 2026; figures unverified |
| OpenAI | Supply | Reported valuation target up to ~$1T | Confidential filing; terms undisclosed |
| Anthropic | Supply | Reportedly raised at least $130B for compute | Confidential filing; listing unconfirmed |
| Alphabet | Demand | 2026 capex ~$195-205B vs $91.45B in 2025 | Q2 buyback pause after ~$15.07B in Q1 unverified |
| Meta | Demand | 2026 capex ~$130-145B | Unverified |
SpaceX’s first lockup expiry reportedly more than doubled its public share count, with further tranches staggered into mid-2027. OpenAI and Anthropic could add more, though their size and timing remain unconfirmed.
The demand side is where the pressure shows. LSEG estimates for five major tech firms’ 2026 capex reportedly climbed from about $485 billion in January to about $730 billion in July, and flexibility to keep funding buybacks is shrinking.
That is the uncomfortable overlap. The firms doing most of the repurchasing are the same firms spending most heavily on AI, so the offset Goldman counts on may be thinnest exactly where supply is rising.
Big Tech buybacks have already weakened, with hyperscaler repurchase allocation falling from 27% to roughly 15% of cash spending, which suggests the offset Goldman counts on is thinner in practice than the aggregate figures imply.
You do not need to track the whole market. Three indicators carry most of the signal:
- Selling behaviour around SpaceX’s staggered lockup dates
- Quarterly buyback execution at Alphabet and Meta against their capex guidance
- Any public filing that sets terms for the OpenAI or Anthropic IPOs
What do December 2027 S&P 500 options say about the size of the move, and why is direction missing?
How the range is built
Implied volatility (IV) is the annualised volatility that option prices imply. From it you can derive an expected move, a one-standard-deviation range that covers roughly two-thirds of outcomes if returns behaved normally.
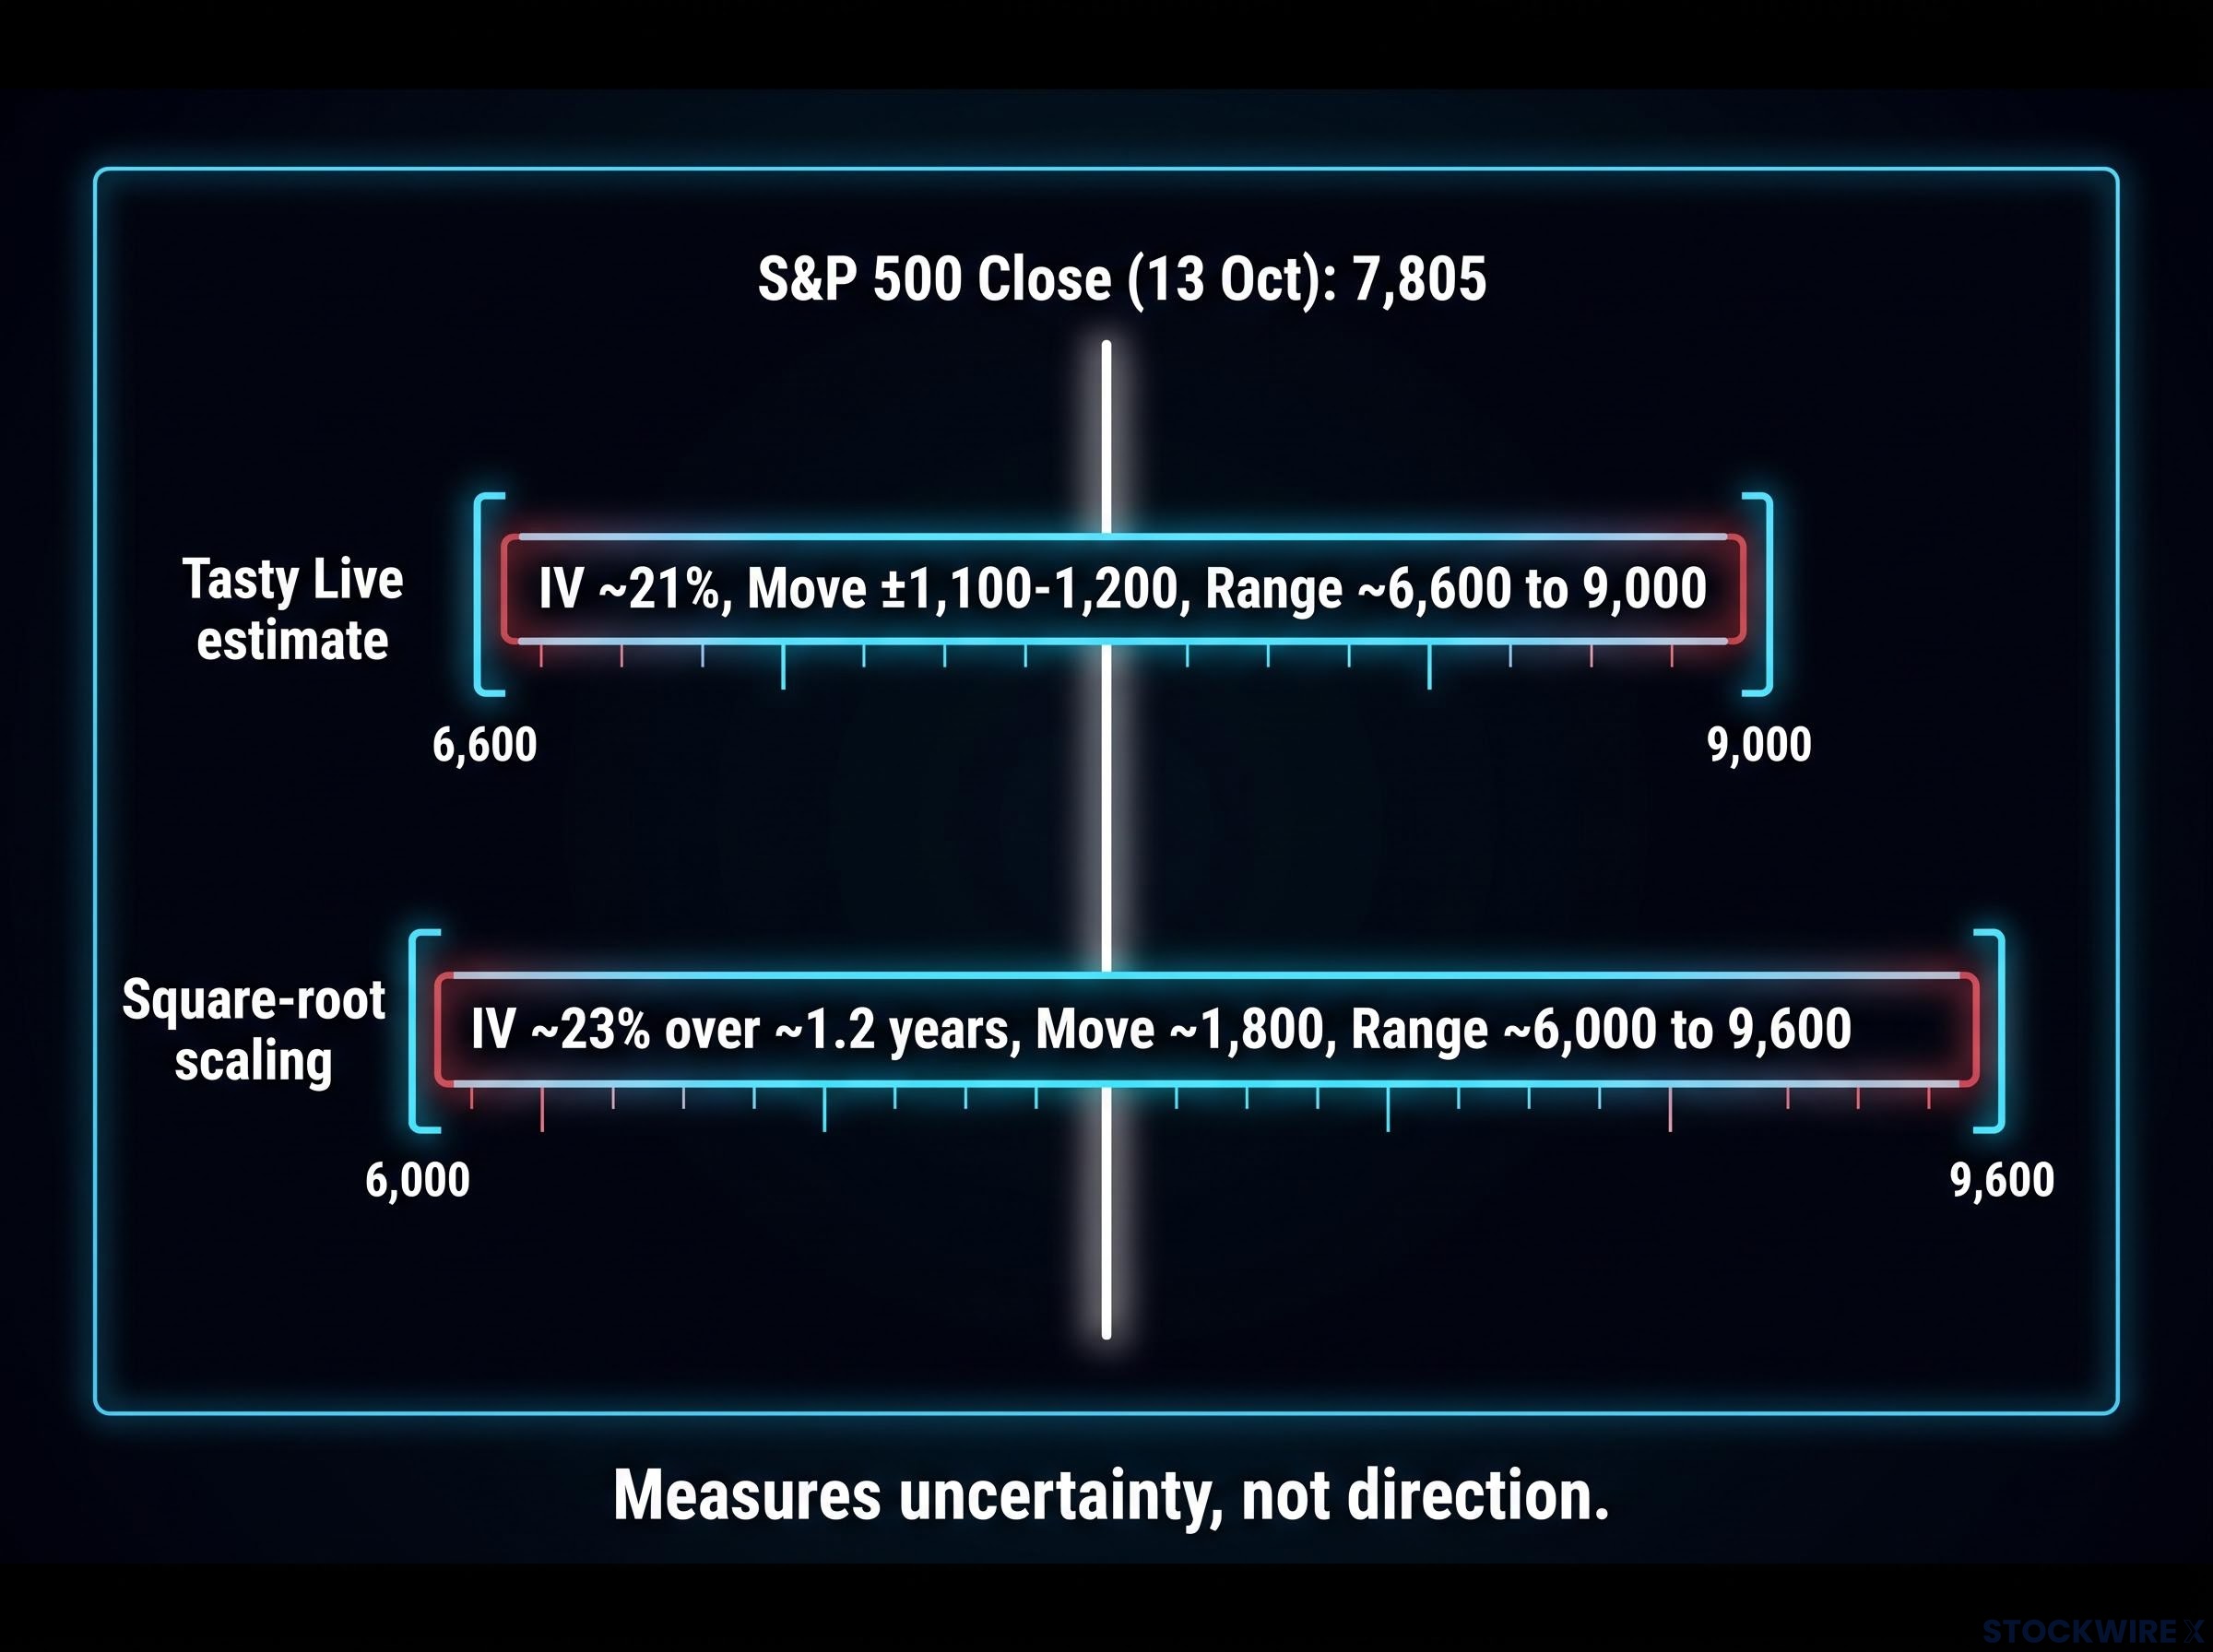
A Tasty Live presenter, using platform data, put the December 2027 expected move at about ±1,100-1,200 points with IV near 21%, a range of roughly 6,600 to 9,000. Scaling 21% by the square root of about 1.2 years gives nearly 23%, or roughly 1,800 points, stretching the range to about 6,000 and 9,600. A 6,000 reading would revisit levels last seen in mid-2025.
A separate snapshot muddies the picture. It used a reference level of 6,623.57, which does not match the 7,805.45 close, so treat it as a data inconsistency rather than a forecast.
| Method | IV | Move | Low | High |
|---|---|---|---|---|
| Tasty Live estimate | ~21% | ±1,100-1,200 | ~6,600 | ~9,000 |
| Square-root-of-time scaling | ~23% over period | ~1,800 | ~6,000 | ~9,600 |
| Conflicting snapshot (unverified) | ~17.83% | ±1,184.69 (15.17%) | ~5,438.88 | ~7,808.26 |
Magnitude, not direction A 15-23% expected move does not mean a 15-23% chance of decline. It measures how uncertain the market is, nothing more.
What skew does and does not tell you
Skew describes how downside puts usually price richer than equally distant calls. Around the 6,600 strike, 16-delta options show IV near 22%, and open interest is heavier on lower puts than upper calls.
That reads as demand for crash insurance, not a prediction. Cboe research shows S&P 500 implied volatility tends to exceed the volatility that later materialises, so part of any long-dated range is simply the price of protection.
The options market neither confirms nor refutes Jones. Any bearish or bullish reading of that range is one you add yourself.
Where does each side of the argument break down?
With the numbers laid out, both cases deserve the same pressure test.
Weaknesses in the bear case:
- Shares eligible for sale are not shares sold, and Goldman warns against treating $1.7 trillion as immediate supply
- Issuance of $600 billion is only about 0.8% of market capitalisation
- Demand can grow through household, foreign and institutional inflows, earnings and lower rates
- IPO counts sit far below 1999 levels
Weaknesses in the buyback offset:
- Repurchases cluster in a few large tech and financial firms, not the stocks seeing issuance
- Buybacks are pro-cyclical, falling just when a selloff needs support
- AI capex competes directly for the same cash
- Authorisations do not guarantee execution, and blackout periods delay buying
- Cash M&A is uncertain, while stock-funded deals add supply
Two further signals cut against comfort. A wave of insider listings may suggest insiders see public valuations as attractive, and a few mega-deals can dominate the aggregate even when deal counts look normal.
The argument turns on three variables:
- How much stock released from lockup is actually sold
- Whether AI capex suppresses buybacks at the largest repurchasers
- Whether investor demand grows fast enough to absorb the gap
The evidence supports a real shift in supply conditions, not a confirmed bearish outcome. That makes Jones’s warning a variable for you to track rather than a timing signal to act on.
Historical precedent is mixed rather than damning: 40 years of IPO data covering about 12,000 listings link elevated volumes to weaker forward returns, yet only around 20% of major waves coincided with market peaks.
What to watch before 2027 turns the warning into data
Jones has identified a real and measurable change in share supply. Goldman accepts the scale but disputes the consequence, and the options market prices a wide 2027 range without choosing a direction.
That leaves you with a short watch-list rather than a verdict:
- Whether lockup holders sell or hold as release dates arrive
- Buyback execution at Alphabet, Meta and other major tech firms
- IPO timetables for OpenAI and Anthropic
- Shifts in December 2027 implied volatility or put skew
The same test applies to the next headline warning: what can be measured, what offsets it, and what the market is already pricing.
Investors exploring the portfolio angle can read our deep-dive into the SpaceX IPO, including how newly listed stocks have lagged established peers by 3.3% a year.
This article is for informational purposes only and should not be considered financial advice. Investors should conduct their own research and consult with financial professionals before making investment decisions. Past performance does not guarantee future results. Financial projections are subject to market conditions and various risk factors.