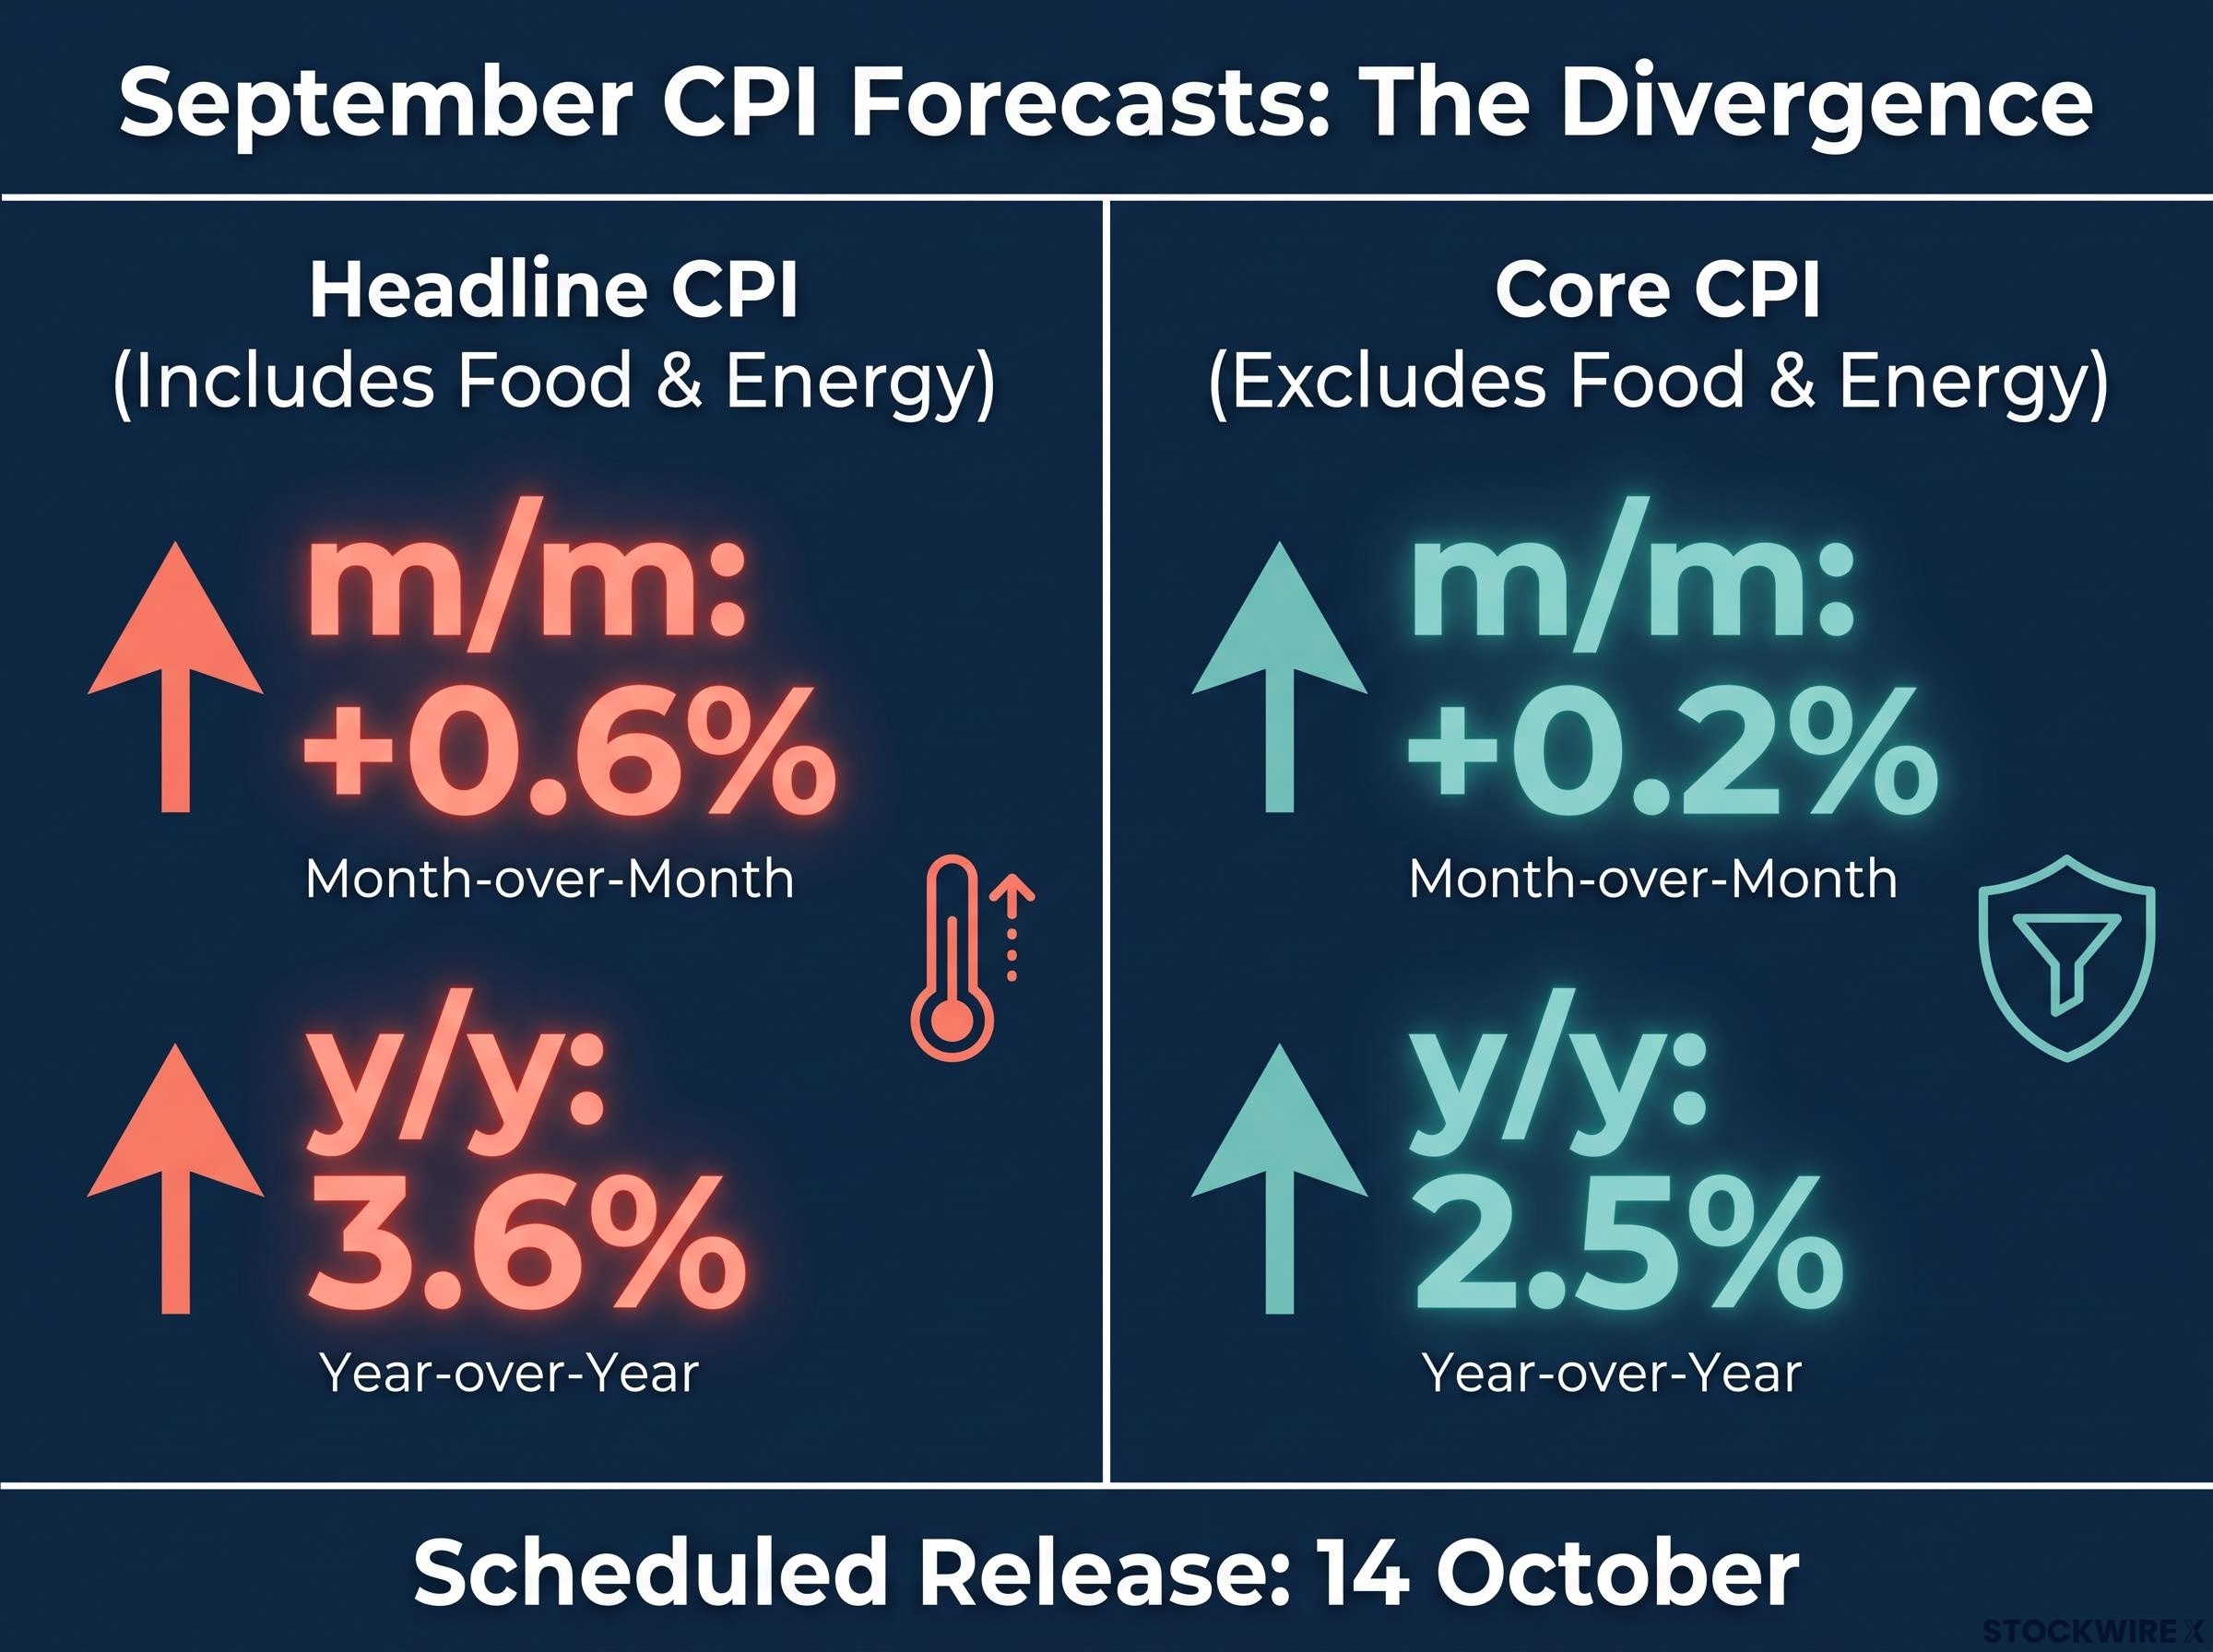
A hot headline inflation number this week may not mean what it looks like. Forecasts point to headline consumer prices rising to 3.6% year on year in September, up from 3.4%. Core prices, which strip out food and energy, are expected to climb just 0.2% for the month. If you read the first figure and assume inflation is reaccelerating across the economy, the second figure suggests you could be misreading the CPI week inflation picture.
The stakes are high. The Federal Reserve raised rates unanimously in September to a range of 3.75%-4.00%. It now faces four tests in one week: the Consumer Price Index (CPI), producer prices, retail sales and a public appearance from Fed Chair Kevin Warsh.
September CPI is scheduled for 8:30 a.m. ET on 14 October. Every reading below is a forecast unless confirmed, because the Bureau of Labor Statistics (BLS) had not yet published the actual print at the time of writing.
This guide shows you how to sort the week’s releases into signal and noise. It also shows you how to judge what each outcome could mean for interest rates, share prices and your own borrowing costs.
What to expect from CPI, PPI and retail sales this week
Start with the calendar, because the order of releases tells a story. CPI shows what consumers are paying. The Producer Price Index (PPI), which measures prices businesses receive for their goods and services, shows pressure building further up the supply chain. Retail sales then show how shoppers are responding.
| Indicator | Release date | Forecast | Previous |
|---|---|---|---|
| Headline CPI, m/m | 14 October | +0.6% | +0.4% |
| Headline CPI, y/y | 14 October | 3.6% | 3.4% |
| Core CPI, m/m | 14 October | +0.2% | +0.3% |
| Core CPI, y/y | 14 October | 2.5% | 2.4% |
| Headline PPI, m/m | 15 October | +0.5% | +0.4% |
| Core PPI, m/m | 15 October | +0.3% | +0.2% |
| Retail sales, m/m | 16 October | +0.3% | +1.2% |
| Core retail sales, m/m | 16 October | +0.5% | +1.4% |
Forecasts per Investing.com preview, as of 14 October 2026.
Warsh is also scheduled to speak with IMF Managing Director Kristalina Georgieva later in the week, which gives markets a chance to hear how the Fed reads the numbers.
The forecasts agree with each other. A separate FactSet survey expects headline CPI of +0.5% and core of +0.2%, while the Cleveland Fed’s nowcast (a real-time model estimate) sits near +0.53% headline and +0.20% core. When three sources line up like that, the split between energy and core is the consensus view, not a fringe call.
The line to watch closely may be retail sales. A slowdown from +1.2% to +0.3% would tell you consumers are absorbing higher fuel bills by cutting back elsewhere. That matters more for growth than the CPI headline does.
Why the headline and core readings diverge
Trading Economics attributes most of the expected headline jump to fuel costs, which are tied to supply disruption from the US-Iran conflict. Energy prices can spike quickly and fall just as fast.
Core components behave differently. Services, shelter and core goods tend to move slowly and persist, which is why the Fed weighs them heavily. Shelter is cooling, but tariffs and vehicle prices remain upside risks to core even if energy fades.
When big ASX news breaks, our subscribers know first
How a hawkish Fed will read the numbers
The Fed has already shown its hand. At its 15-16 September meeting it lifted rates 25 basis points to 3.75%-4.00% in a 12-0 vote, after a dissent in July. Its Summary of Economic Projections (SEP), the forecasts published by policymakers, put the median rate at 4.1% for both end-2026 and end-2027, implying one more hike this year.
Markets think the Fed will need to go further. Futures price about 50 basis points more tightening in 2027 than the SEP does. Financial Times Institutional reported roughly a 17% probability of an October hike and 78% for December, though those figures have not been independently confirmed.
Cleveland Fed President Beth Hammack made the hawkish case on 12 October.
Fed view Hammack said inflationary pressures are broad and that restrictive policy may be needed to stop an “inflationary mindset” from becoming entrenched.
The counter-argument is that a fuel-driven rise is a supply shock the Fed can look through. August data complicates both sides: headline PCE (personal consumption expenditures, the Fed’s preferred inflation gauge) ran at 3.4% year on year, with core PCE also at 3.4%.
Here is how each outcome could move the debate:
- Hot headline, hot core: The most hawkish result. It would likely reinforce December hike expectations and push short-term Treasury yields higher.
- Hot headline, soft core: The consensus case. It supports the energy-shock reading and could limit the rise in long yields, though it keeps the hike debate alive.
- Soft across the board: It could lower expected peak rates and ease pressure on rate-sensitive shares.
The expectations data explains why a hot print could hit harder than the numbers alone justify.
| Expectations measure | Reading | Source |
|---|---|---|
| One-year expectations | 4.7% | University of Michigan (Oct prelim) |
| Five-year expectations | 3.5% | University of Michigan (Oct prelim) |
| 10-year expected inflation | 2.57% | Cleveland Fed (11 Sept) |
| 10-year breakeven | about 2.36% | Bond market (6 Oct) |
A breakeven rate is the inflation level bond investors are pricing in over a set period. Households fear far more inflation than bond markets expect. That gap tells you the Fed is weighing a risk of expectations drifting loose that markets are not yet pricing, which is why one hot print could move rate expectations sharply.
What Q3 earnings, GDPNow and PCE reveal about underlying strength
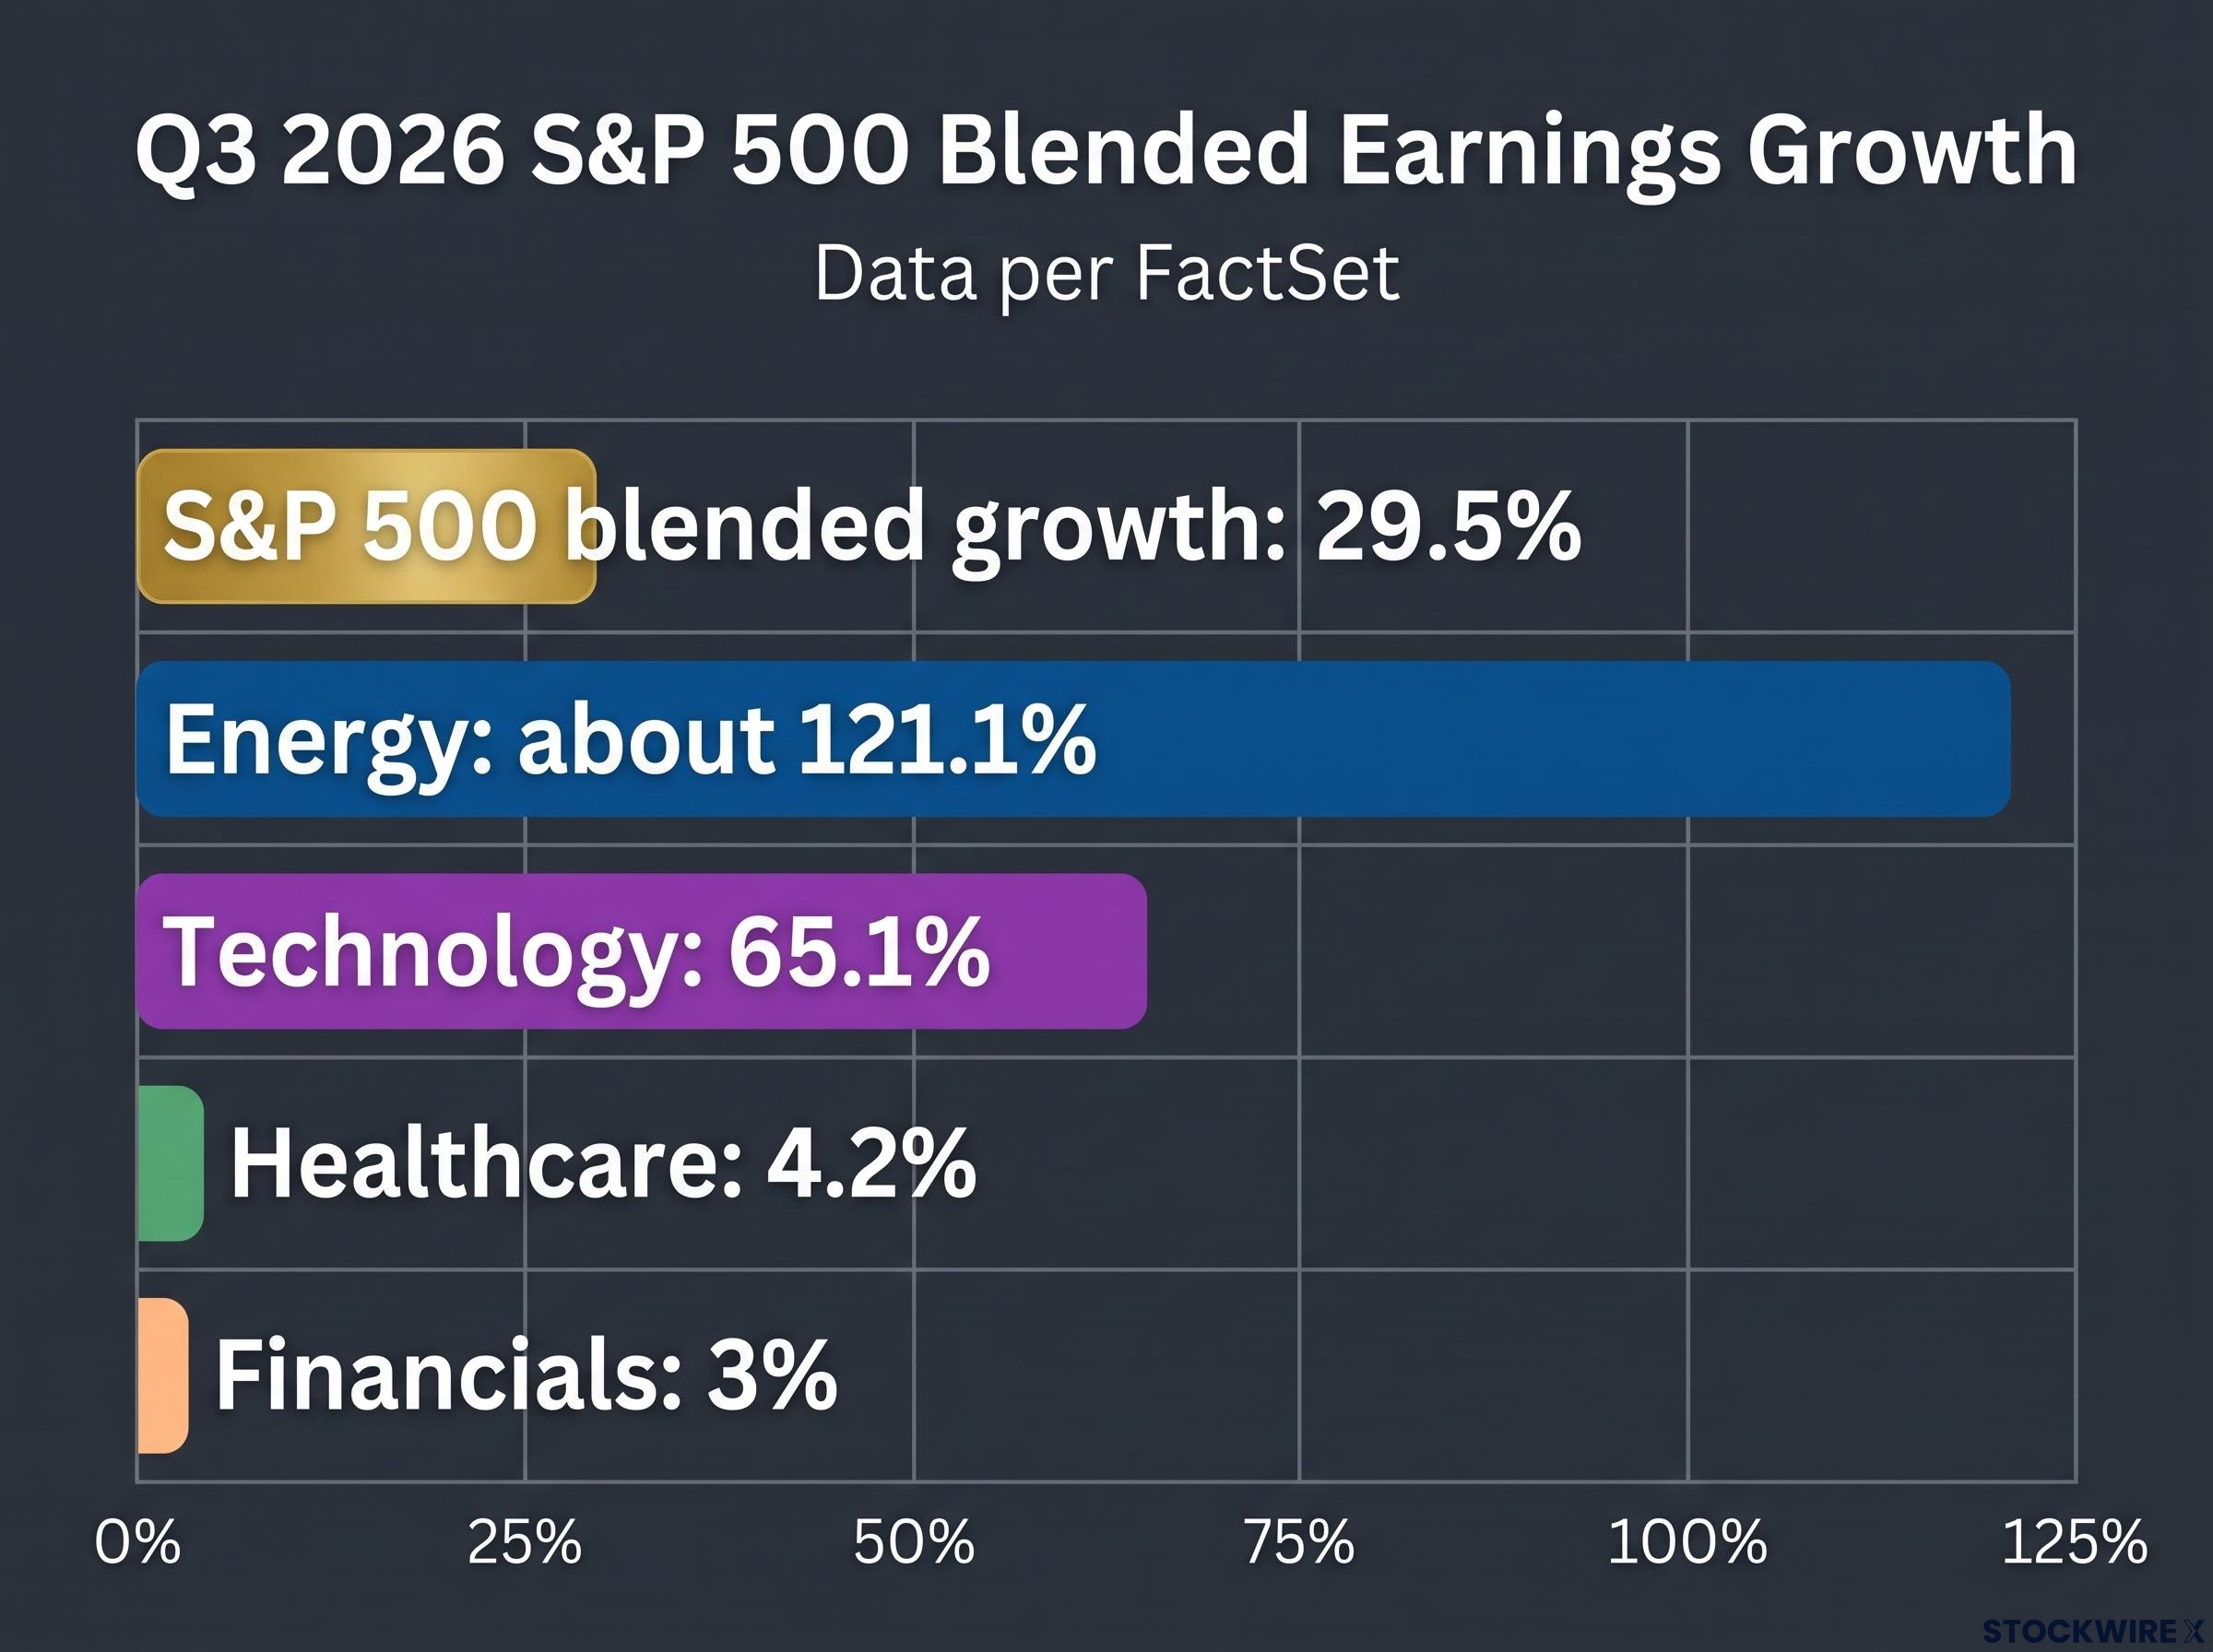
On the surface, corporate America looks strong. FactSet’s 11 October data shows S&P 500 blended earnings growth of 29.5% year on year for Q3 2026. Blended growth combines reported results with estimates for companies yet to report.
Look beneath that figure and the strength narrows quickly.
| Sector or indicator | Reading | Source |
|---|---|---|
| S&P 500 blended growth | 29.5% | FactSet |
| Energy | about 121.1% | FactSet |
| Technology | 65.1% | FactSet |
| Healthcare | 4.2% | FactSet |
| Financials | 3% | FactSet |
Energy’s surge is attributed to the US-Iran war, and technology supplies much of the rest. Individual results have been mixed. Johnson & Johnson missed with earnings per share of 2.59 against 3.03 expected, and Wells Fargo reported revenue of $21.9B against $22.3B expected, although most banks posted slight upside surprises.
Wider growth signals are softer:
- GDPNow: The Atlanta Fed’s real-time estimate of Q3 growth slipped to 3.6% annualised on 8 October, from 3.7%, and from an initial average of 5-6%.
- PCE trend: The three-month annualised rate is at the Fed’s 2% target and the six-month rate is nearing it.
- Sentiment: The Conference Board index fell to 81.9, its lowest since April 2014, and Michigan’s October preliminary reading sits at 46.3.
None of this points to a broad contraction. But the headline earnings figure overstates breadth, so judging the market on it alone hides how much depends on energy and tech. A strong earnings season does not prove the economy can absorb more tightening.
How to read a CPI release when headline and core disagree
Headline CPI measures the price of everything consumers buy. Core CPI removes food and energy because those prices swing sharply and often reverse, which makes core a better guide to lasting trends. Month-on-month figures show the latest change; year-on-year figures compare prices with twelve months earlier.
This week shows the gap clearly. The Cleveland Fed nowcast implies annual rates of 3.6% headline and 2.4% core, a wide split driven by fuel.
Use this order when the print lands:
- Read core month-on-month first. It shows whether underlying momentum is building.
- Check shelter and services. These are the stickiest parts of inflation.
- Then read the headline. Judge how much of it is energy.
- Finish with expectations measures. These show whether a shock is feeding into what people expect next.
Reading core first tells you whether the Fed is likely to treat the print as a one-off shock or as evidence of broad inflation. That judgement determines whether your rate-sensitive holdings or variable-rate debt are at risk.
Avoid two common mistakes. Do not treat one month’s energy spike as a trend, and do not ignore expectations data the Fed watches. Remember too that PCE, the Fed’s preferred gauge, ran at 3.4% for both headline and core in August, so the Fed cannot lean on a soft CPI core alone.
What this means for your money
- Investors: A hot headline could pressure short-duration bonds, rate-sensitive shares and long-duration growth stocks. A soft core may cap the rise in long yields.
- Households: Higher fuel prices cut your real disposable income, whatever the Fed decides.
- Borrowers: Another hike would raise costs on variable-rate debt such as adjustable-rate mortgages (ARMs), home equity lines of credit (HELOCs) and credit cards. Fixed mortgage rates track Treasury yields, so a hot print can lift them before the Fed acts.
These statements are speculative and subject to change based on market developments.
Reading the week without overreacting: what to watch next
Keep the framework simple. Read core before headline, treat futures pricing as probabilities rather than promises, and weigh earnings breadth alongside growth data.
After this week, three variables deserve your attention: the next CPI release, revisions to GDPNow, and Michigan’s inflation expectations. Each will show whether the energy shock is fading or spreading.
The decision point is whether the Fed looks through fuel-driven inflation or tightens further. Your response should depend on your own exposure: how much variable-rate debt you carry, and how sensitive your portfolio is to higher yields.
This article is for informational purposes only and should not be considered financial advice. Investors should conduct their own research and consult with financial professionals before making investment decisions. Past performance does not guarantee future results. Financial projections are subject to market conditions and various risk factors.