The S&P 500 closed at a record level this month and finished 12 October 2026 near 7,800, up about 14% for the year. The average stock tells a different story. The equal-weight version of the index, which gives every company the same weighting, still sits roughly 5-6% below its own peak, and that gap shapes any honest S&P 500 forecast.
Goldman Sachs, JPMorgan, Morgan Stanley and Deutsche Bank have all converged on 8,000 for year end. Gareth Soloway, chief market strategist at Verified Investing, shares that target from a neutral-to-bullish stance, but he names the exact levels where his view breaks.
The pressure points are a 10-year Treasury yield near 5.25% and a rally heavily concentrated in AI stocks. Here you get the three price levels worth watching, the two risks that could end the run, and the risk-management moves you can defend without calling a crash.
Where are the S&P 500 levels that matter, and what do the big banks expect?
The consensus is comfortable. The index closed at 7,804.07 on 12 October 2026, according to reported figures, after a record close on 6 October, and it is up a reported 14.0% year to date.
| Strategist/Institution | Year-End Target | Reasoning |
|---|---|---|
| Gareth Soloway, Verified Investing | 8,000 | Trend line from 2022 lows, conditional on technical levels |
| Goldman Sachs | 8,000 (from 7,600) | Profit growth supports valuations |
| JPMorgan | 8,000 (from 7,800) | 2026 EPS estimate raised to $365 |
| Morgan Stanley | 8,000; 8,300 by mid-2027 | Earnings and AI cycle support |
| Deutsche Bank | 8,000 | Joined the bullish camp |
| Yardeni Research | 8,300 | Earnings growth and AI investment |
The disagreement is about degree and timing, not about whether an AI-led earnings boom exists. Soloway argues earnings growth has made the index arguably cheaper than in January. He also notes that markets have tended to benefit from political gridlock. BlackRock data shows midterm years averaging 7.5% against 12.4% in other years, followed by an average 14.1% six-month gain after the election.
Wall Street targets still span more than 500 points, from Wells Fargo’s cautious 7,700 to Fundstrat’s 8,200-plus, and elevated valuation readings such as a Shiller CAPE near 40 narrow the margin for error behind any of them.
His map narrows that comfort into three lines:
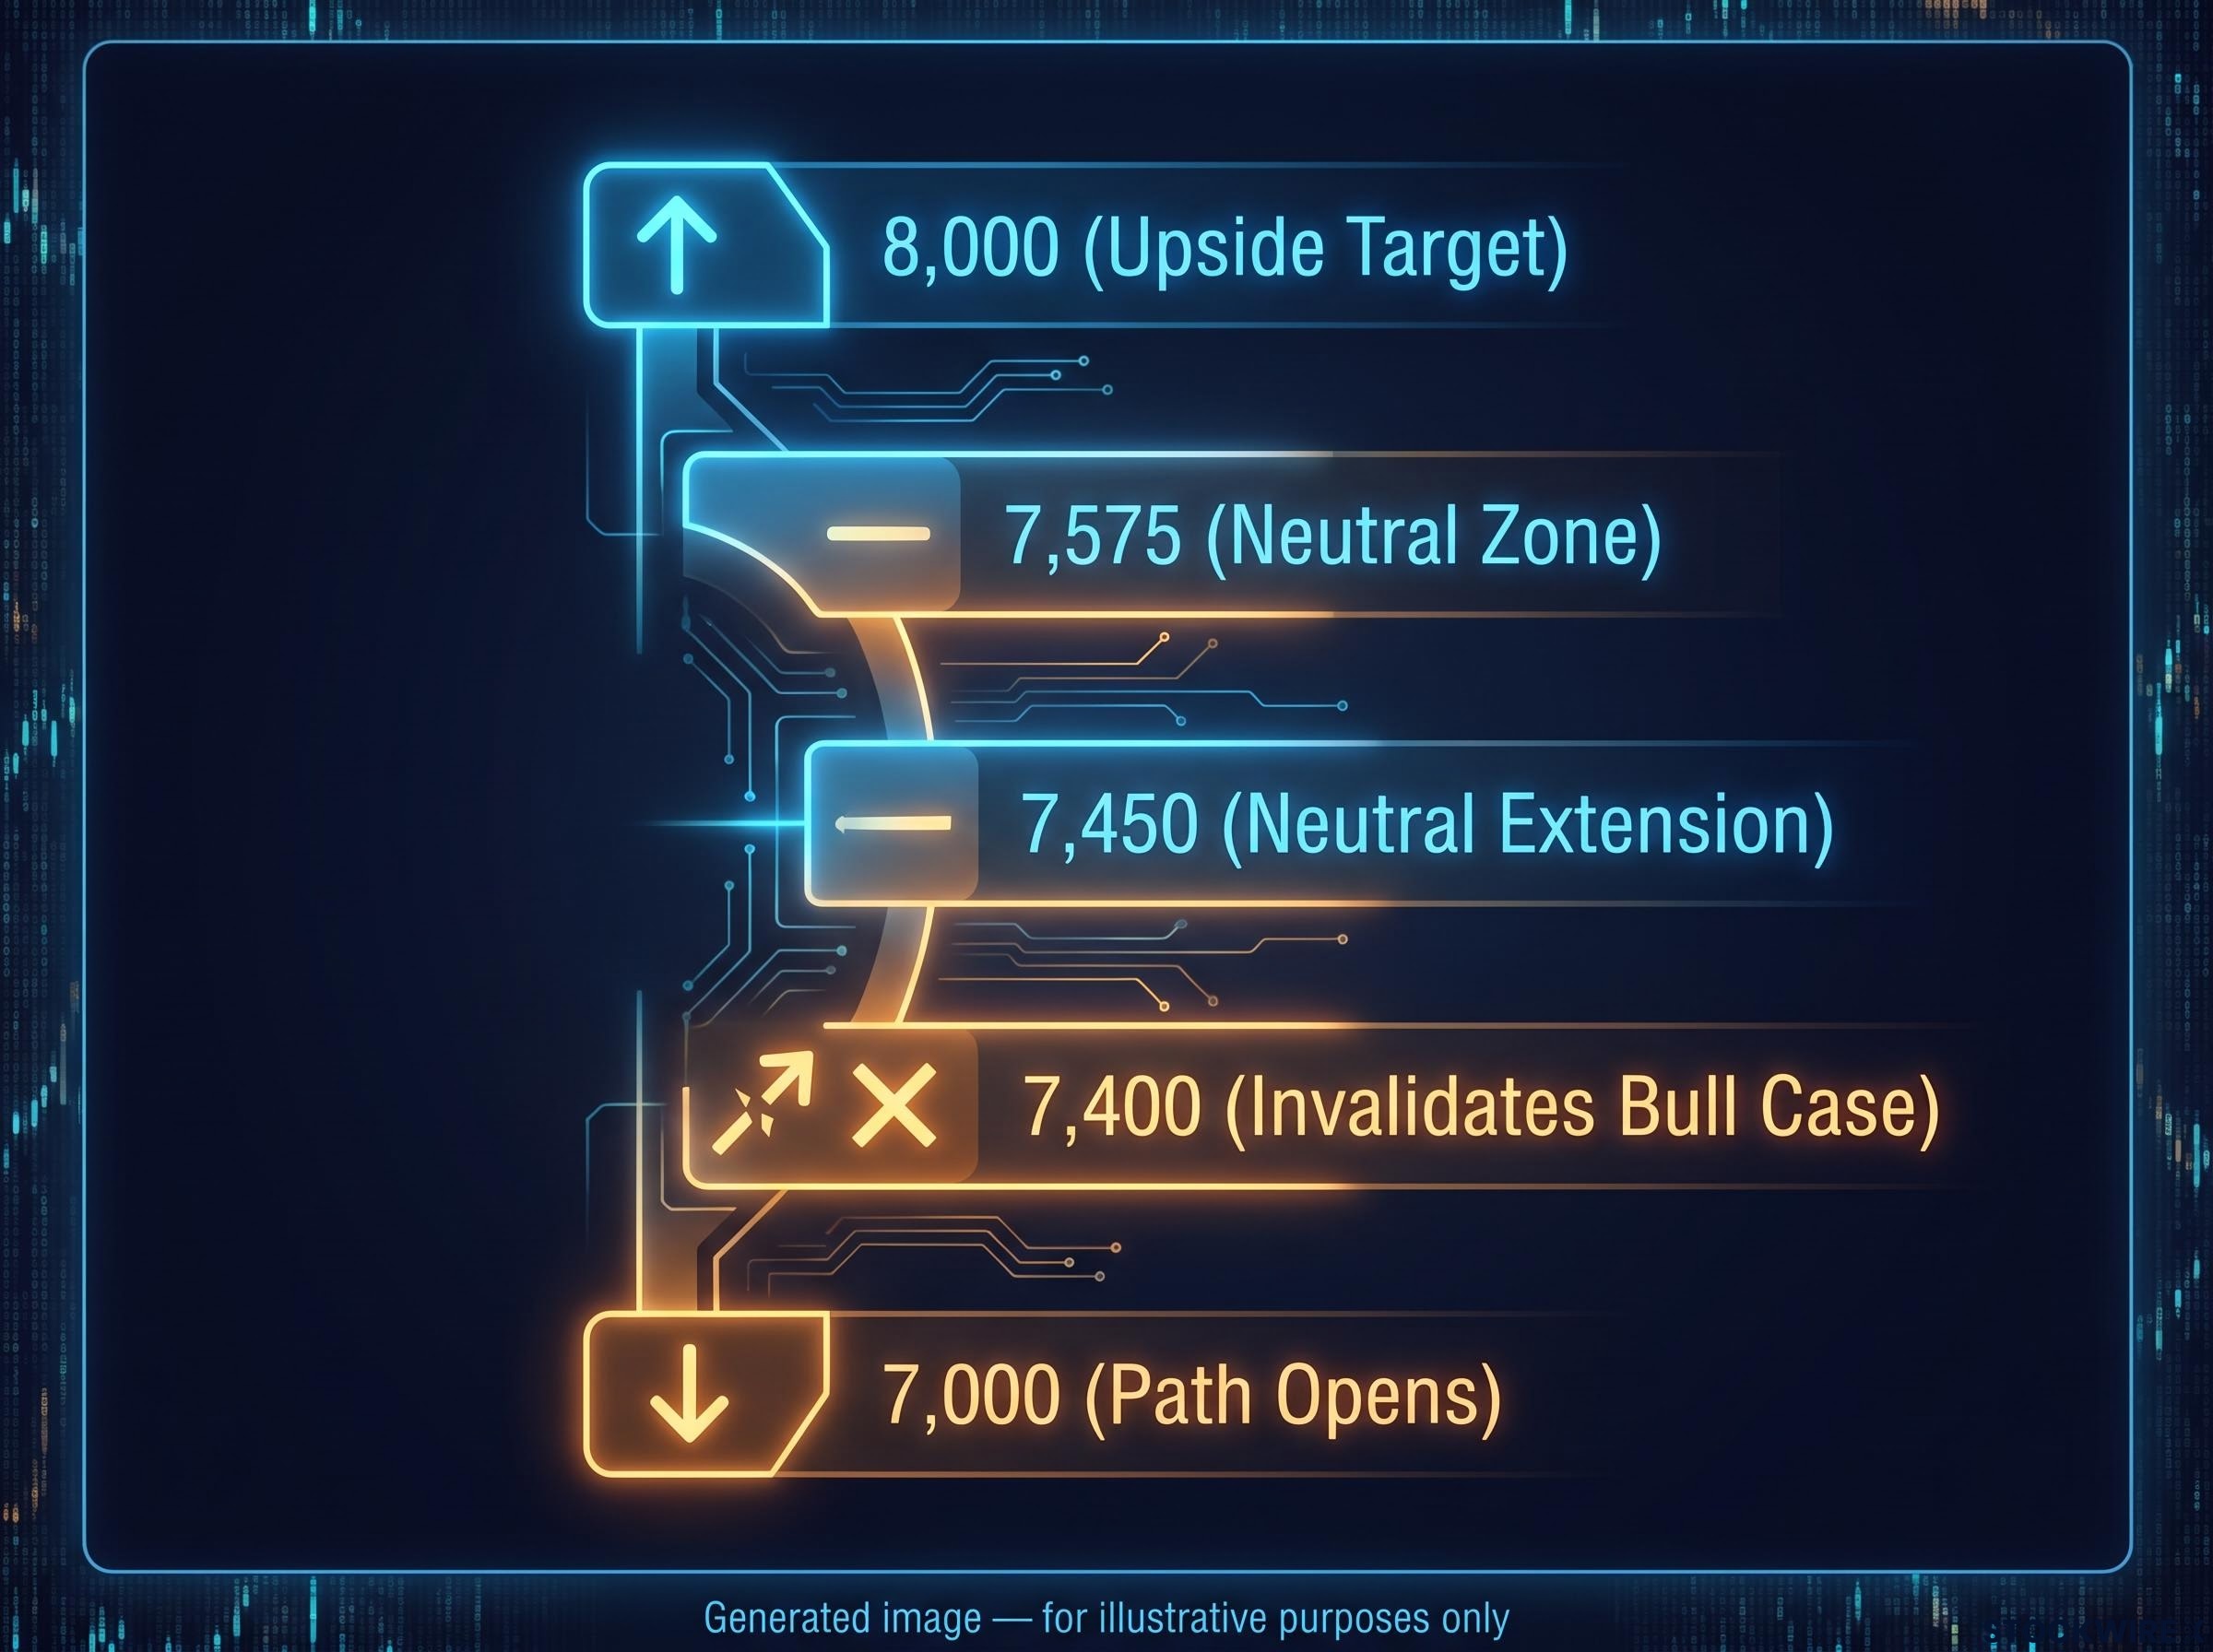
- 8,000: upside target, aligned with a trend line from the 2022 lows and possibly reached by the midterms
- 7,575: a daily close below moves the index into his neutral zone, extending towards 7,450
- 7,400: a break invalidates the bull case and opens a path towards 7,000
The invalidation line Soloway treats 7,400 as the level where his bullish view fails.
The index recently formed a double top, meaning it was rejected twice near the same high. His 7,575 marker sat only about 2.5% below the level at the time he spoke. A modest pullback and a thesis-breaking drop are about 2% apart, so decide now which one you are planning for.
When big ASX news breaks, our subscribers know first
How concentrated is the rally, and what happens if AI spending stalls?
That thin cushion matters more when you see who is holding the index up. ScanX put the equal-weight ETF (RSP) 5.1% below its $223.44 record, while Soloway estimates about 6%. The sources differ on size but agree the gap is wide.
Nvidia, valued near $5.5 trillion in 12 October reporting (Reuters cited $5.76 trillion on 5 October), outweighs a couple hundred S&P companies combined in Soloway’s framing. Nvidia, Apple and Microsoft together account for more than 21% of the index. The mechanics build on themselves:
- AI leaders rise on expected earnings.
- Higher market values lift their index weights.
- Passive funds buy more because the weights are larger.
- The headline index looks strong while the median stock lags.
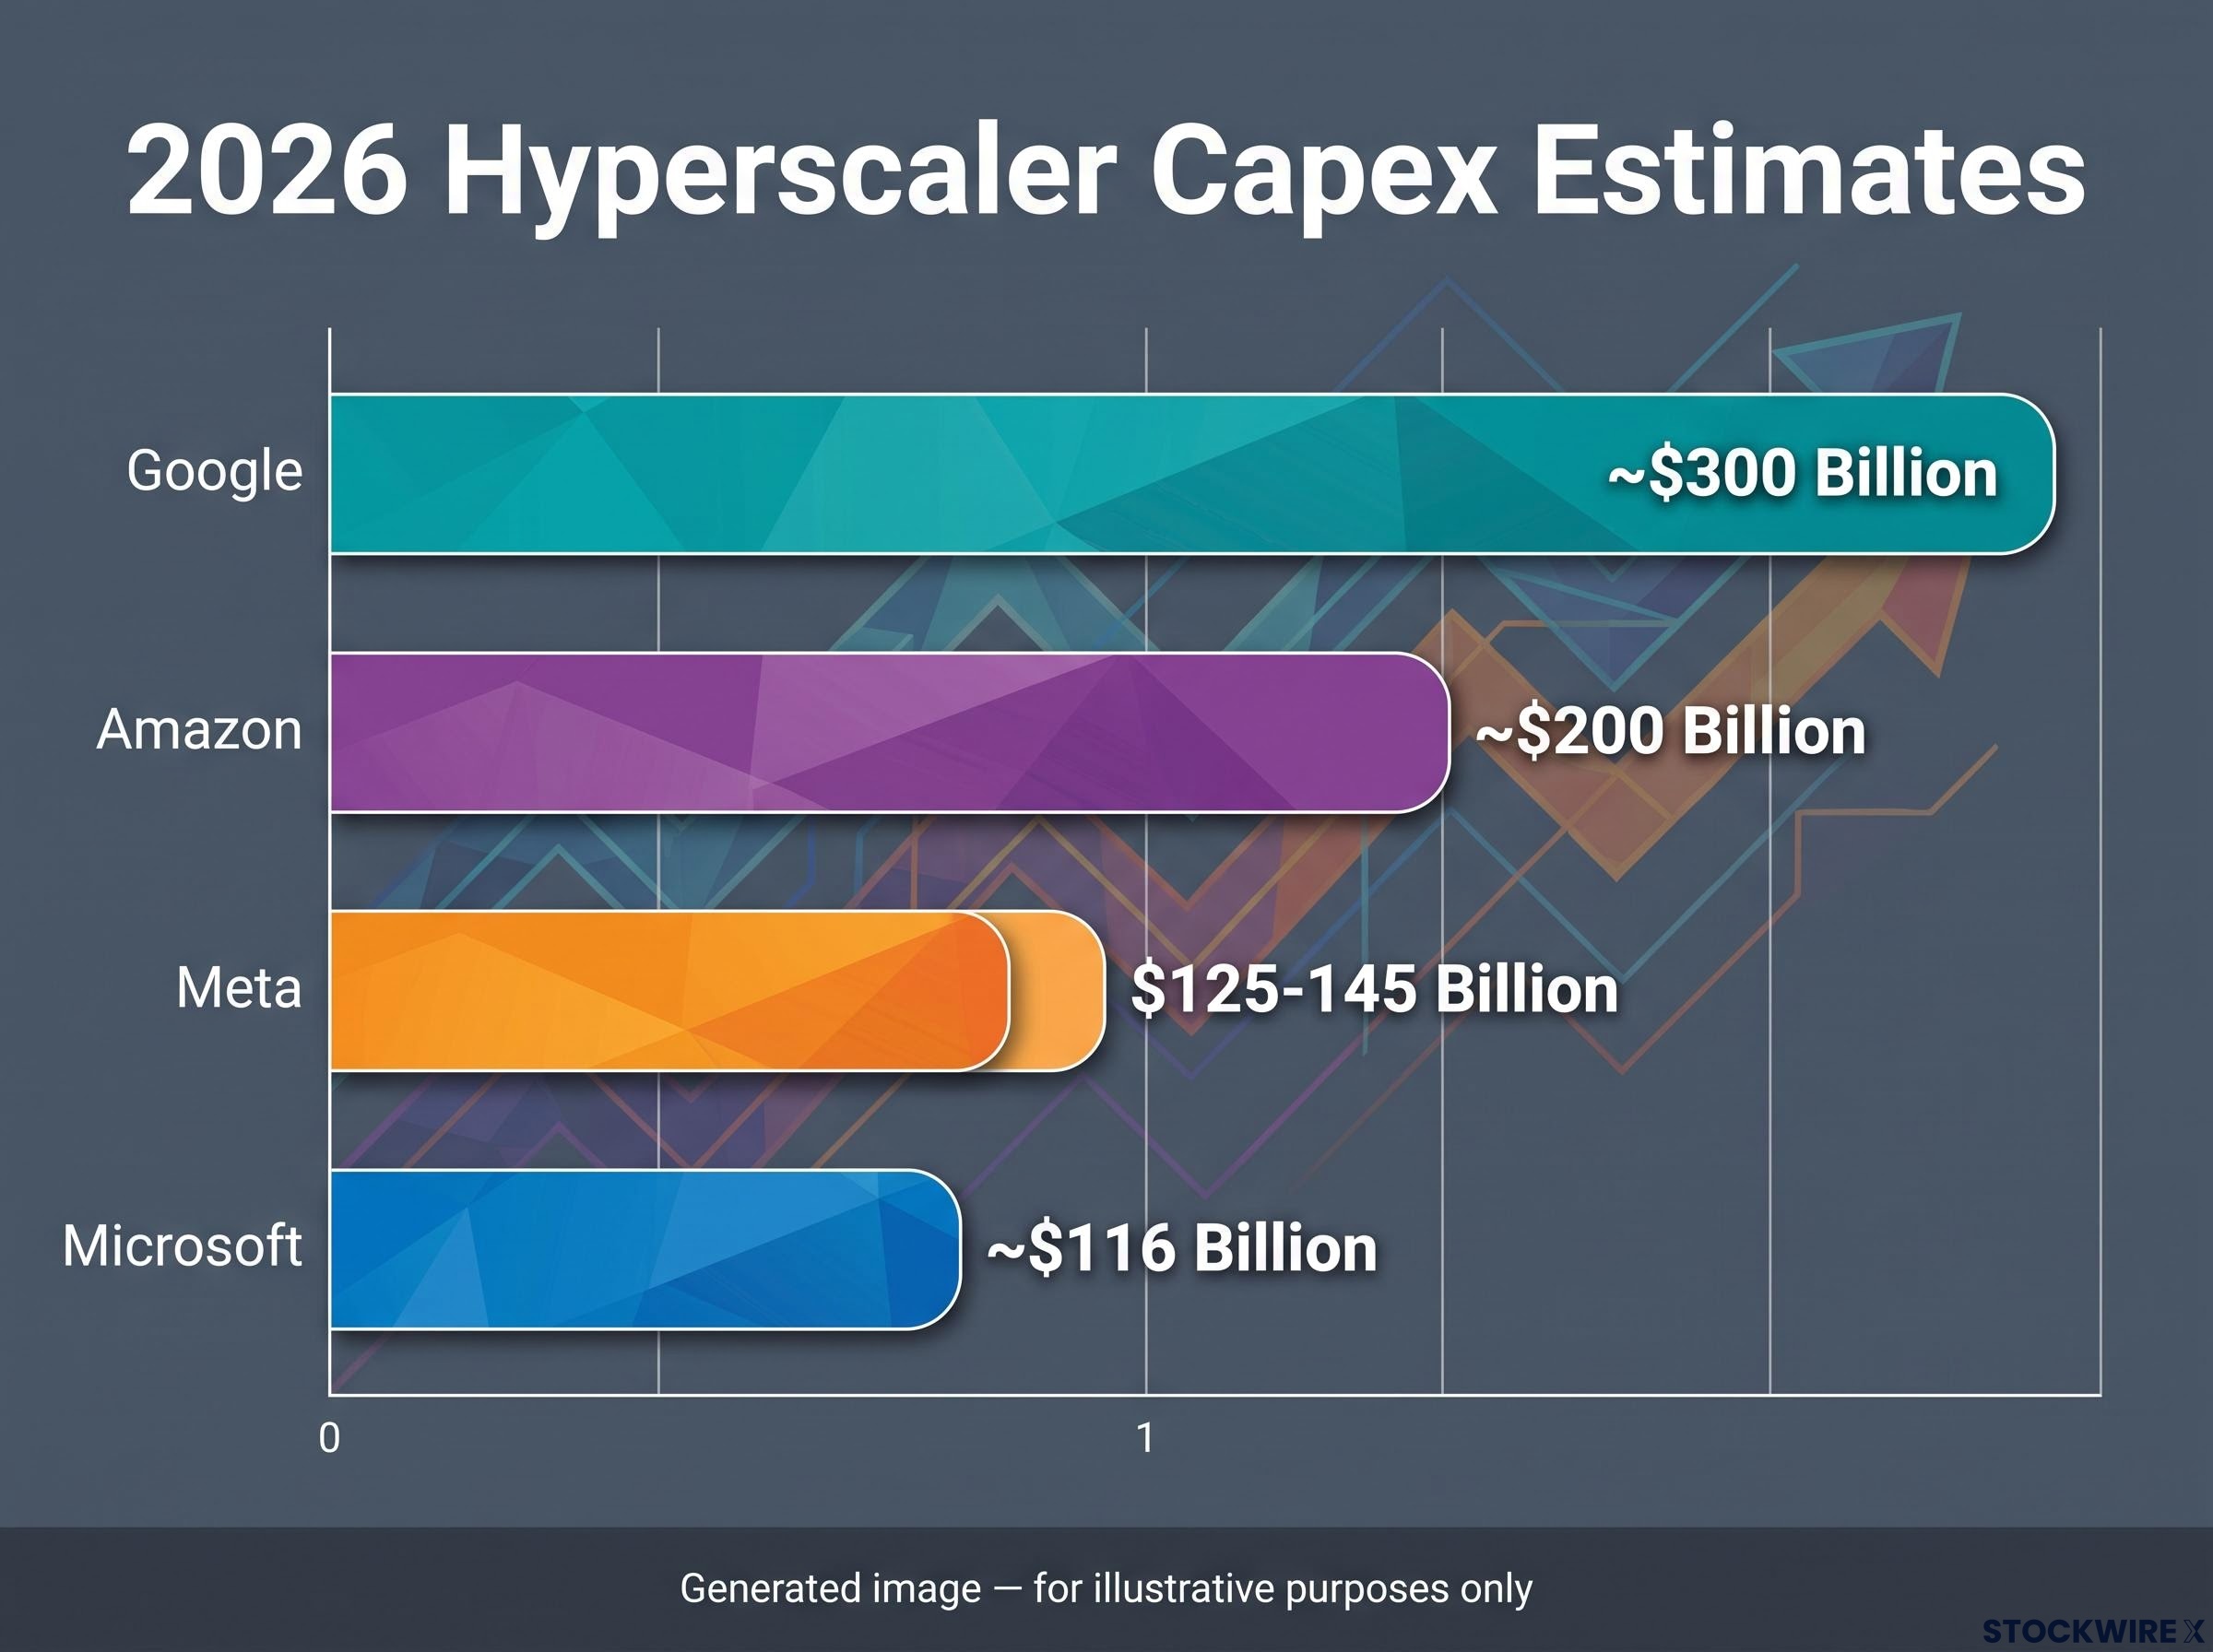
The fuel is hyperscaler capital spending (capex), meaning money spent on data centres and chips. Reuters reported more than $600 billion across four companies for 2026, and later secondary reports put it at roughly $674-725 billion. Meta guides to $125-145 billion, Amazon about $200 billion and Microsoft about $116 billion for fiscal 2026, though fiscal years and definitions differ.
Soloway cites roughly $300 billion for Google; no authoritative standalone figure confirms it. He argues the economy might already be in recession without this spending, pointing to Home Depot and Lowe’s below their 50-day moving averages and consumers squeezed by oil and gasoline prices.
The case against the alarm
Today’s leaders generate far stronger profits and cash flows than most dot-com firms did. Their weight may be earned through superior earnings growth, and equal-weight lag can reflect real profitability gaps.
Still, if your index fund is cap-weighted, you own the concentration bet whether you chose it or not. A capex slowdown would hit faster than most retail investors could react.
Why does a 10-year yield near 5.25% matter so much for stocks?
Concentration is one pressure point. The other is a bond yield at a 24-year high that stocks have so far ignored.
Reuters reported the 10-year touching 5.3445% intraday on 1 October, the highest since 2002, before easing to 5.1717% a day later. It closed at a reported 5.24% on 12 October. Higher yields reach stocks through four channels:
- A higher discount rate on distant cash flows, hitting growth and tech hardest
- Safer bonds competing for investor money
- Higher corporate borrowing costs
- Rising government debt-service costs
Soloway argues today’s debt load makes current rates more dangerous than the 15-16% yields of the 1980s, a framing rather than settled fact. He points to SpaceX planning a $40 billion debt sale to buy Nvidia chips. The strain is global.
| Market | Latest Yield | Context |
|---|---|---|
| U.S. 10-year | 5.24% | Highest since 2002 on 1 October |
| France 10-year | 4.93% | Touched about 5%, highest since 2002 |
| Japan 10-year | 3.115% | Near a 30-year high |
Why stocks have held up so far
Equities can coexist with high yields when earnings grow fast enough, and that is the real support. Inflation remains sticky, with August headline PCE at 3.4% and core at 3.0%, both above the Fed’s 2% target. In 2022, BlackRock notes, the S&P 500 fell 18.1% as rising rates compressed tech valuations.
Goldman Sachs strategists describe the bond market threat as the main constraint on equity gains, and note that the calm in the VIX alongside surging rates volatility is an unstable pairing that rarely persists.
Soloway’s next yield resistance is 5.5%, which he says could push stocks into his neutral zone. A quarter point looks small, but treat it as the stress test of whether your equity exposure can absorb a higher discount rate.
What do earnings reactions reveal that the VIX does not?
If yields are the slow-moving threat, the faster signal sits in price action. The VIX, a gauge of expected volatility, sat near 15.19 on 12 October, and Soloway says it is telling investors nothing.
He watches how stocks react to good news. A stock that fails to rise on strong results suggests institutions are selling into strength. He cites Micron’s muted response, though that is documented only through his characterisation.
The wider evidence is mixed. Meta shares reportedly fell about 6% after hours when it raised 2026 capex guidance, per the Economic Times, while a 23 September Reuters report showed Microsoft dipping amid broader uncertainty without a clean earnings reaction. Reuters frames hyperscaler results as a test of whether AI spending converts into revenue and profit.
Even bullish JPMorgan has warned of flash-crash risk in crowded momentum trades. In each report, watch:
- Price reaction versus the quality of results
- Changes to capex guidance
- Commentary on AI revenue conversion
Soloway likes charts because they carry no narrative. When a stock you own falls on good news, read it as information about positioning, not a verdict on the company. No single reaction proves a top, but the coming season is a real test.
How can you position for an 8,000 target without ignoring the downside?
Core risk-management tools
None of these requires predicting a crash. Each carries a cost.
| Tactic | Benefit | Main Cost |
|---|---|---|
| Partial profit-taking | Cuts AI concentration, restores allocation | Taxes; missed upside to 8,000 |
| Holding cash | Cushion and buying power in a dip | Cash drag; re-entry timing |
| Systematic rebalancing | Trims oversized positions by rule | Selling winners early |
| Depressed dividend payers | Income and possible value | Risk of a dividend cut |
If you hold a large unrealised gain in AI leaders, partial profit-taking restores your intended allocation without a market call. Size cash to near-term needs, emergencies and a predetermined rebalancing plan.
Vanguard’s suggested 5% drift threshold, checked quarterly, is one way to set the rebalancing rule in advance, and a multi-year rally can push a 60/40 portfolio to roughly 70/30 without a single trade.
Soloway keeps positions small, rotates some gains into gold and nibbles at beaten-down names rather than chasing Nvidia.
“Missing a 10% gain is better than suffering a 20% loss,” says Gareth Soloway, chief market strategist at Verified Investing.
Depressed dividend payers: value or trap?
Clorox fell from about $109 to roughly $79, hitting technical support. Morningstar reportedly cites a yield near 4% and a $163 fair value, though net income and operating cash flow have fallen. NextEra dropped from about $98.50 to near $75; data-centre power demand helps, but rate sensitivity hurts. Nike faces brand, demand, inventory and competitive risks.
A lower price does not make a dividend safe. Check:
- Free-cash-flow coverage of the dividend
- Upcoming debt maturities
- Payout ratio
- Competitive position
Past performance does not guarantee future results, and projections are subject to market conditions. This article is for informational purposes only and should not be considered financial advice. Investors should conduct their own research and consult with financial professionals before making investment decisions.
What changes at 7,575, and what does not
The 8,000 target is widely shared. The risks that could derail it are specific and observable: concentration in AI leaders and a 10-year yield near 5.25%.
Your decision points are clear. Above 7,575, the constructive view holds. Below it, the market enters neutral territory, and 7,400 is where the bull case fails. On bonds, 5.5% is the line to watch.
The coming earnings season and midterm period are the next real tests. Review how much of your portfolio rides on a handful of AI names, and set your rebalancing rule before the market forces the question.