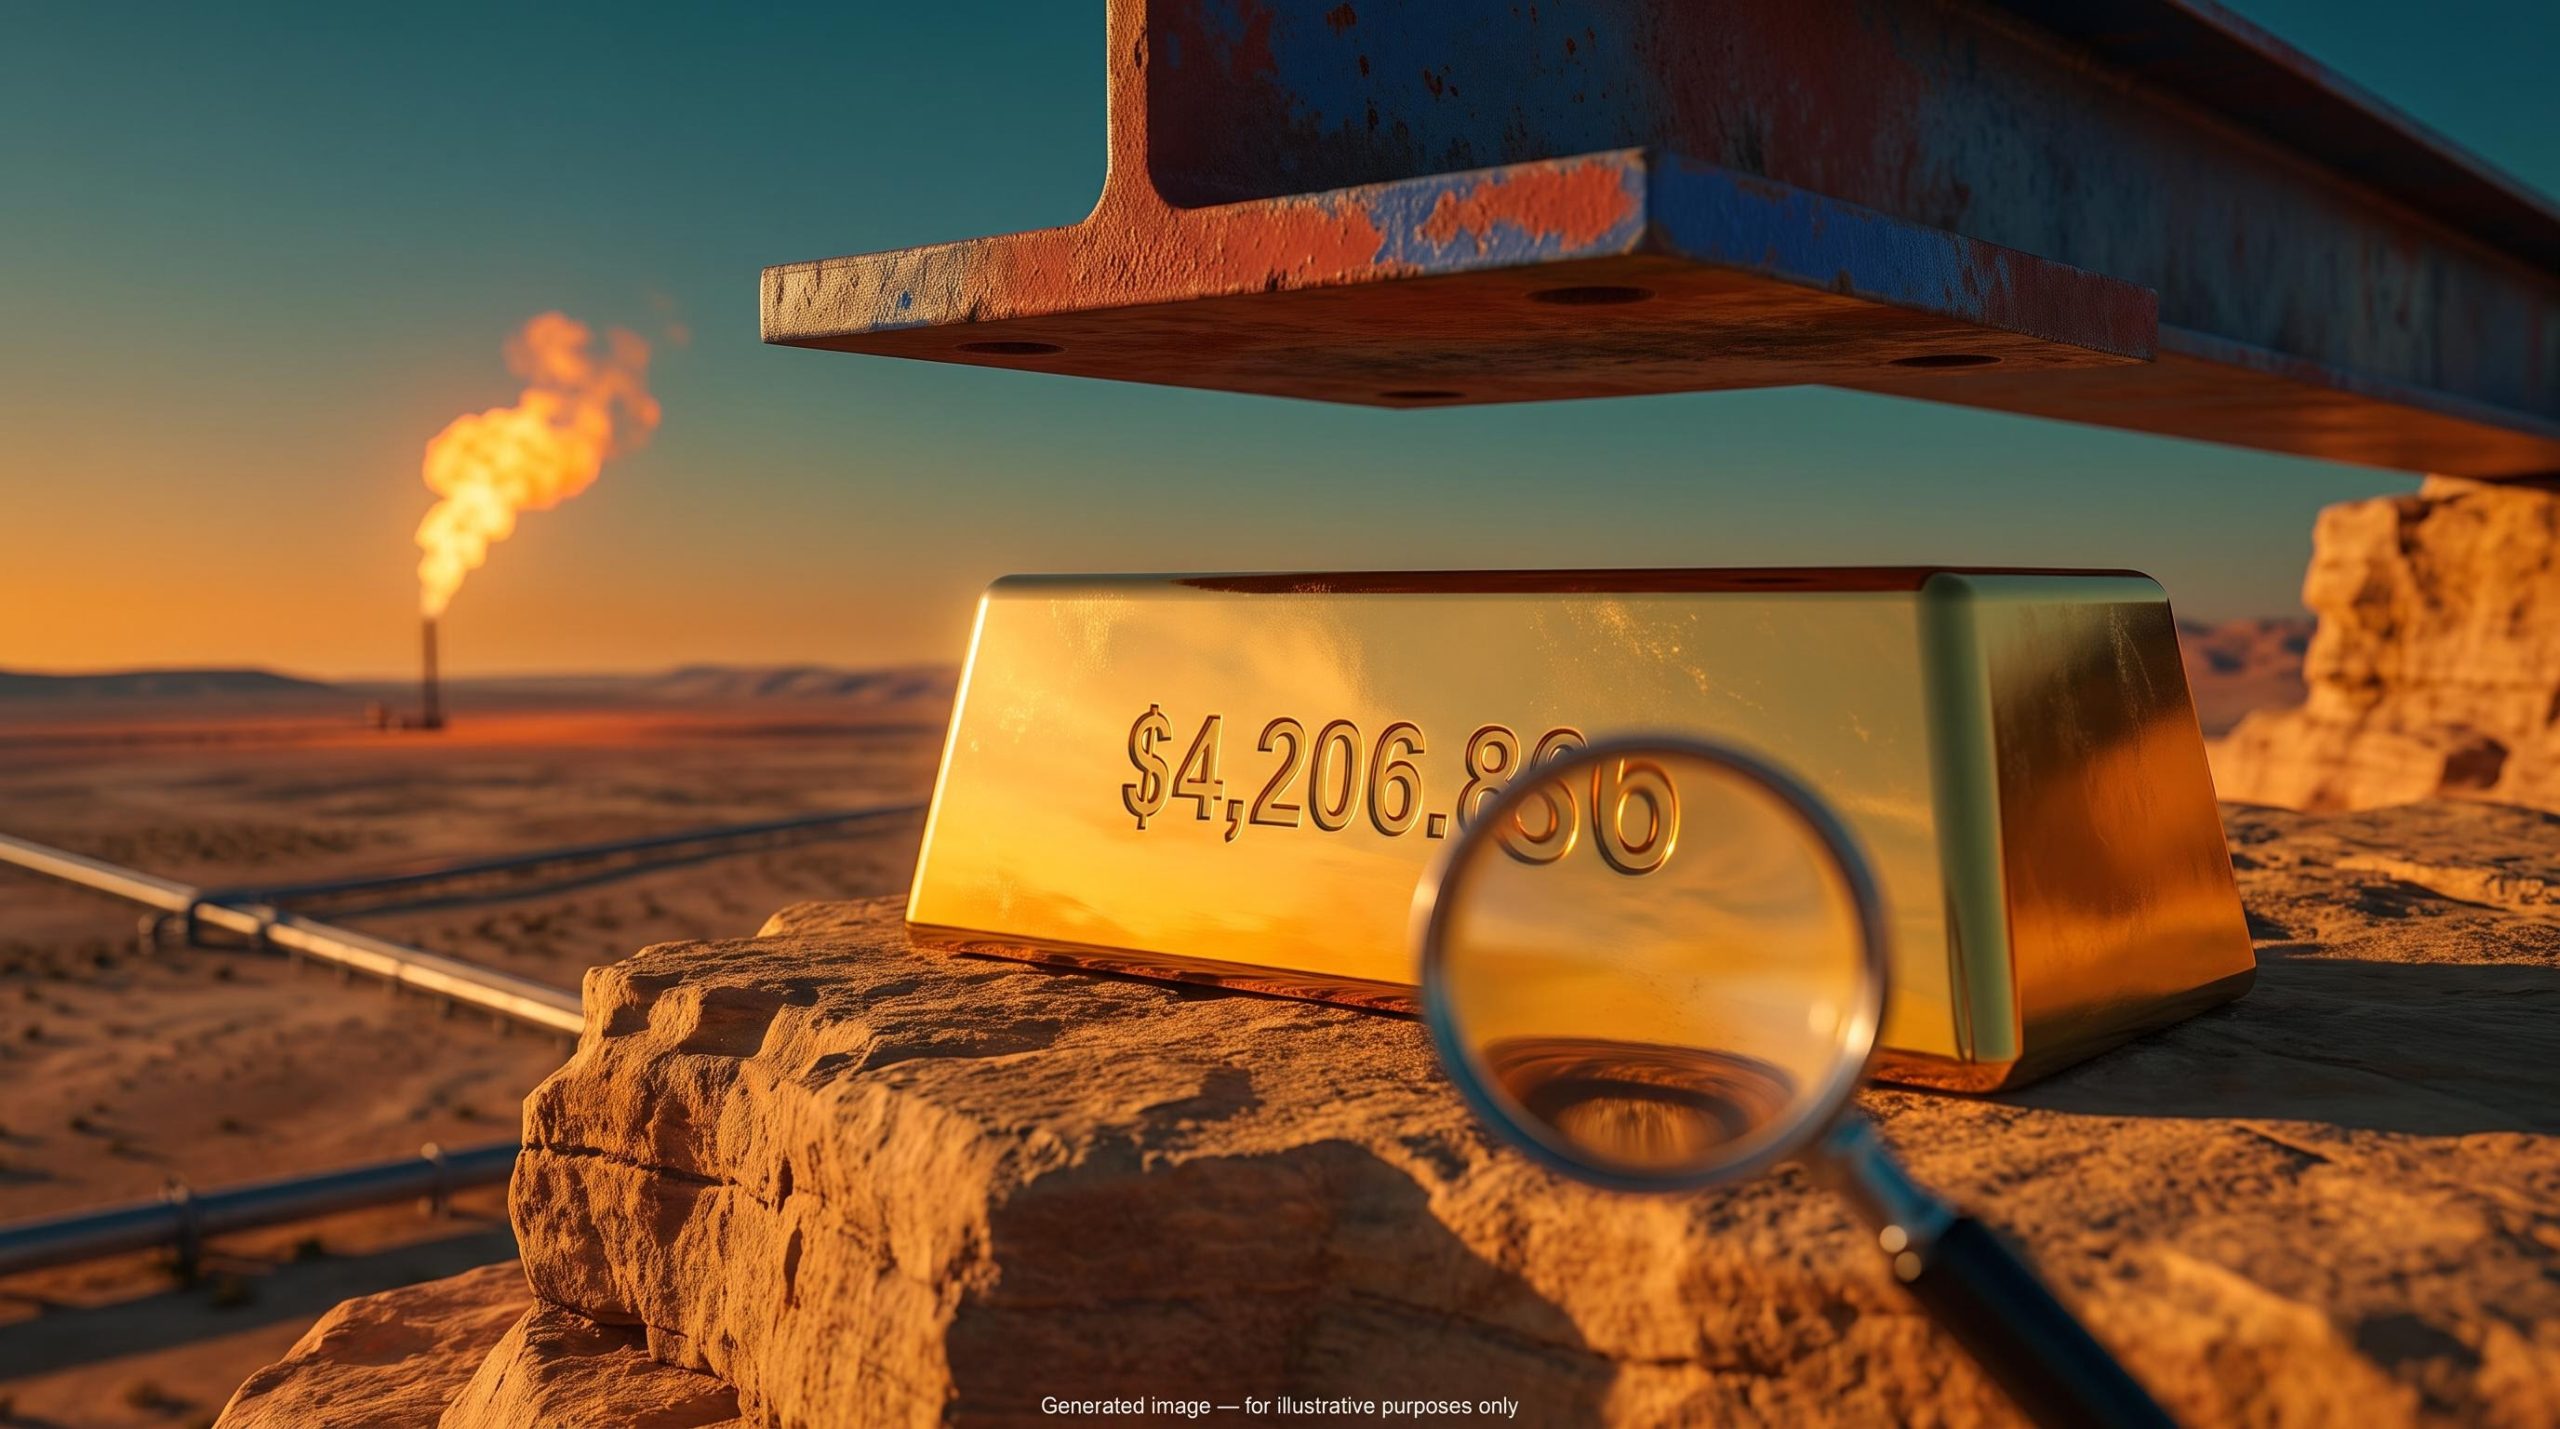
Spot gold rose to $4,206.86/oz in early Monday trading, extending a 1.3% weekly gain as gold-backed funds took in money at a four-year high. Even so, the gold price still sits roughly one-fifth below where it traded when the U.S.-Iran war began in late February 2026. A safe haven that falls during a war needs explaining.
The timing makes that explanation urgent. On 11 October, President Trump announced a Russia-Ukraine “energy ceasefire.” Over the weekend, Houthi missiles killed 12 people at Riyadh’s main airport, and fresh U.S. inflation data is due within days.
Each of these forces pulls on gold from a different direction. If you misread which one dominates, you risk treating a headline as a signal when it is mostly noise.
Here is what is holding gold up, what is holding it down, and the handful of numbers worth watching before the next Federal Reserve (Fed) decision.
Why is gold still about 20% below its war-time peak?
Conventional wisdom says conflict lifts gold. Since late February, the evidence has argued otherwise.
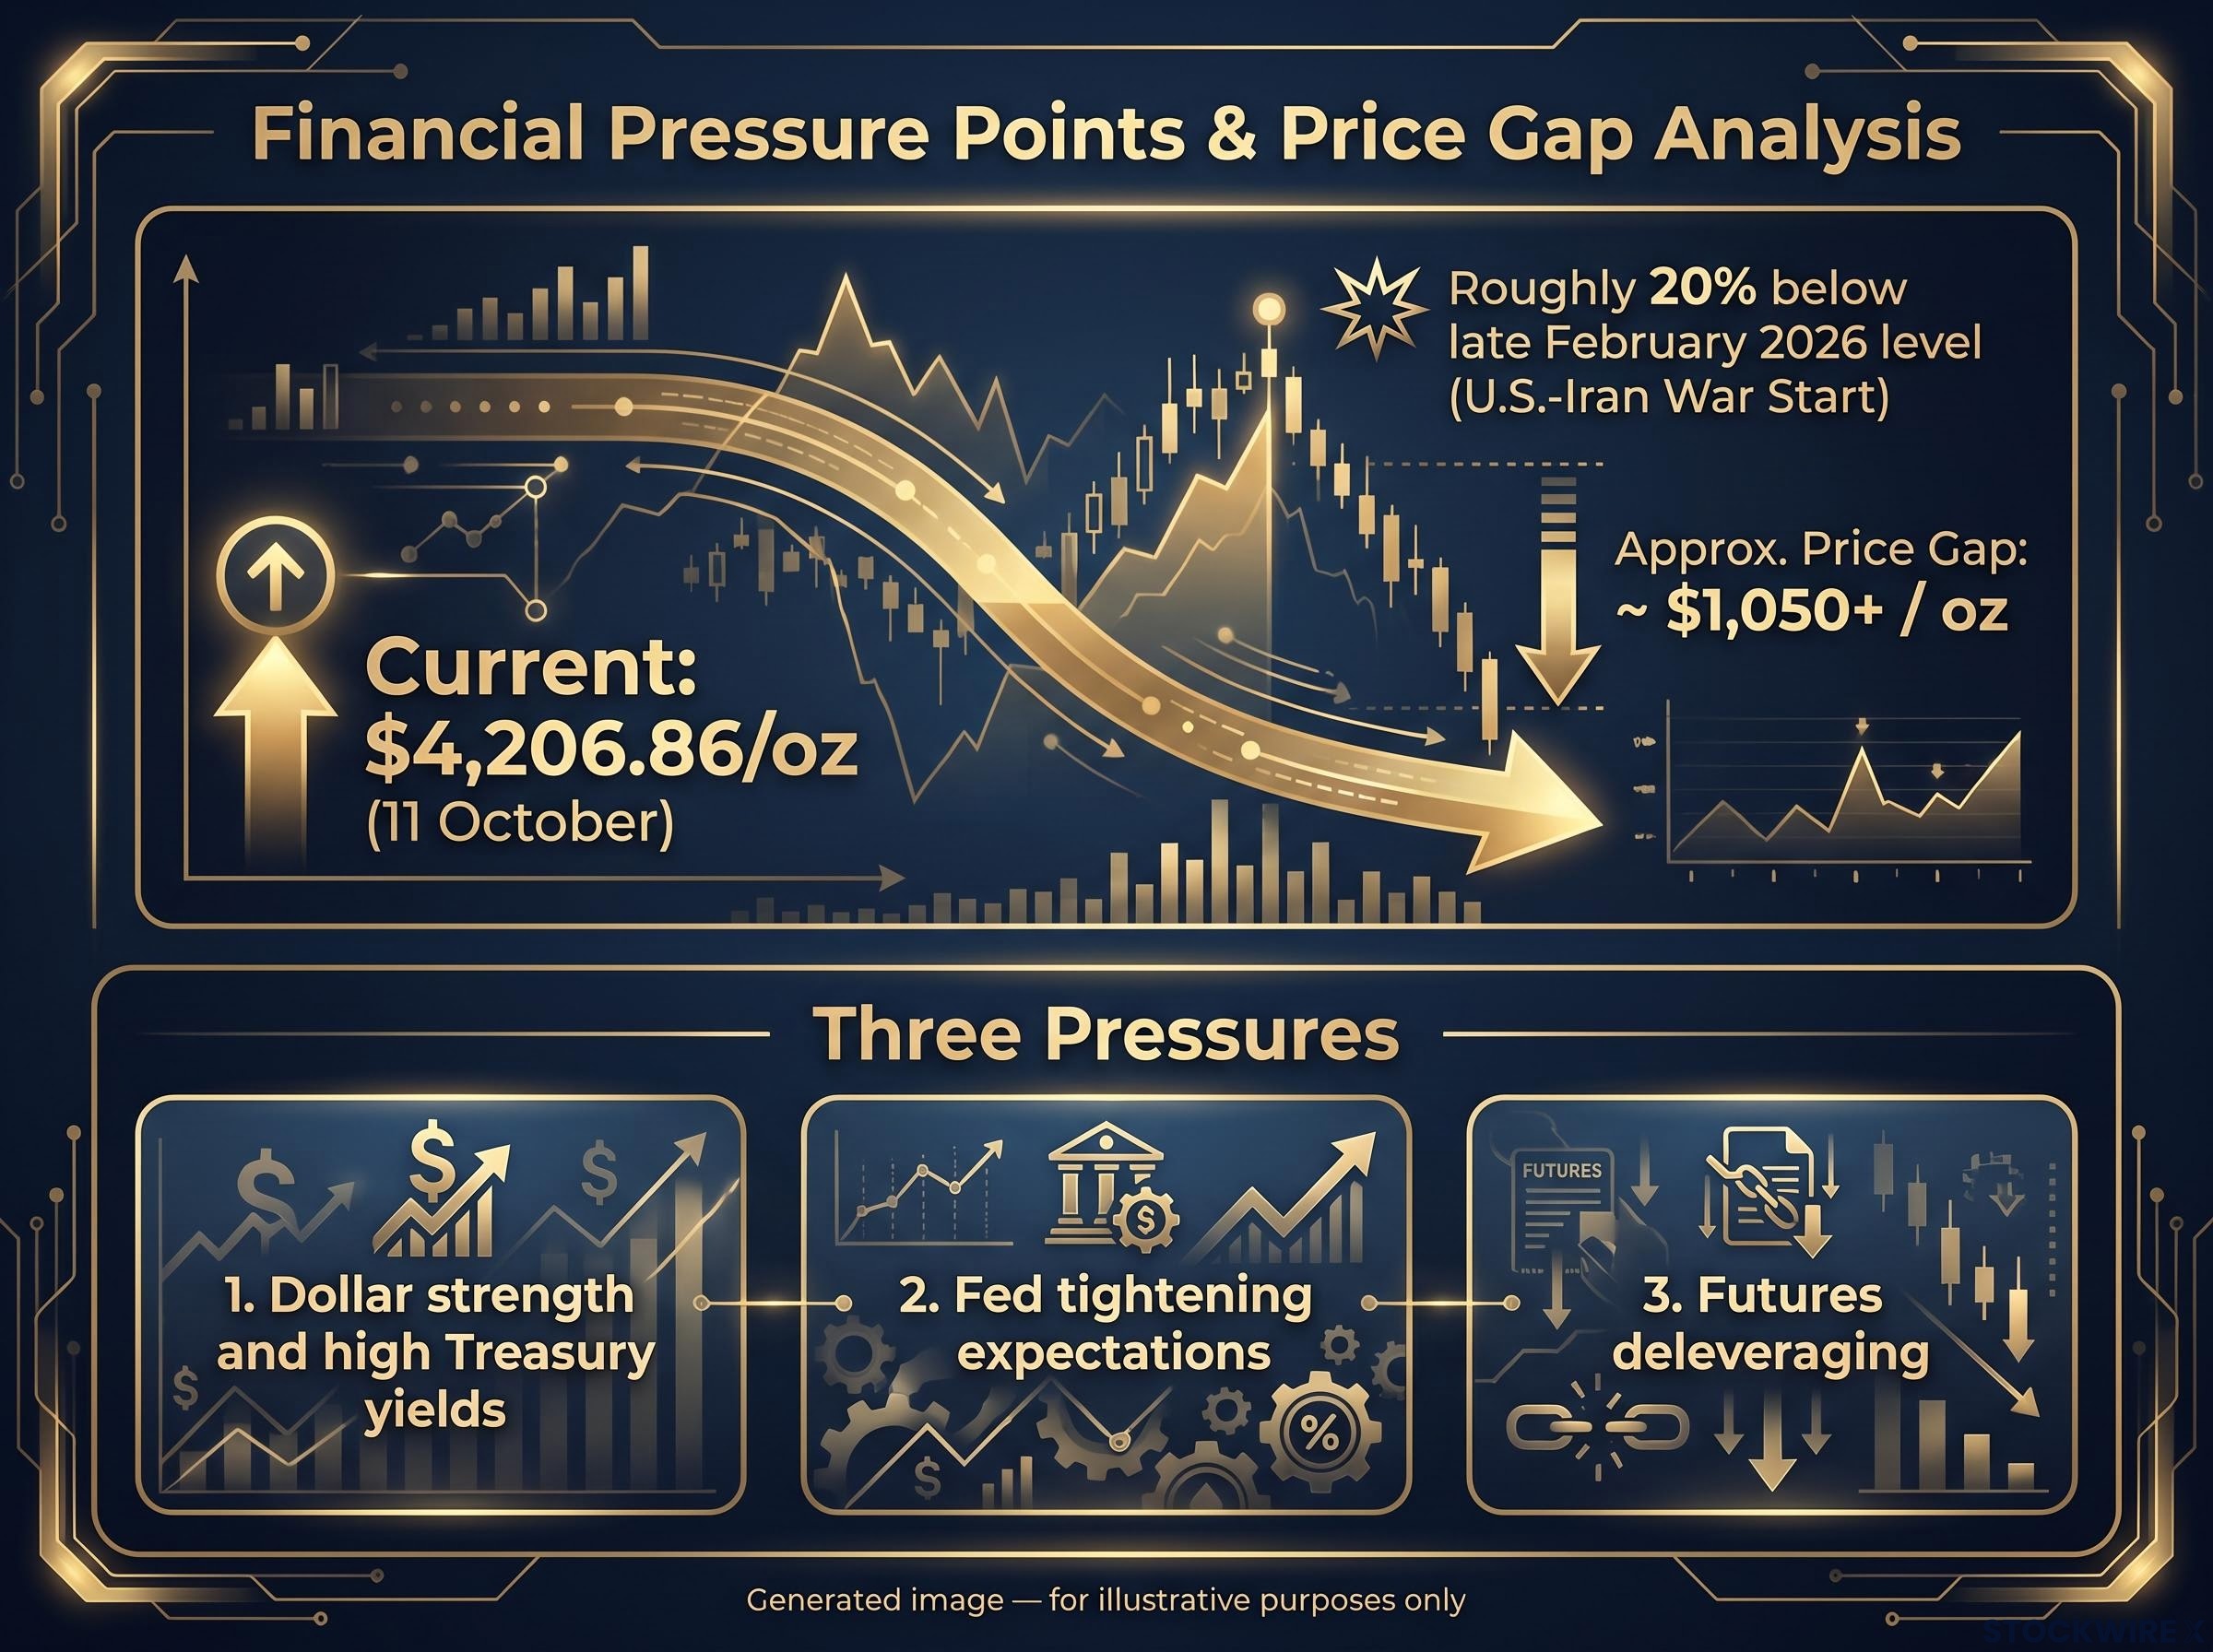
The gap that matters Spot gold at $4,206.86/oz (Investing.com, 11 October) remains roughly one-fifth below its level at the start of the U.S.-Iran war.
Reuters attributed the shortfall to a stronger dollar and high Treasury yields, which offset safe-haven demand. Gold is priced in dollars, so a firmer dollar makes it more expensive for buyers using other currencies. Meanwhile, expectations of further Fed hikes have kept real yields elevated. A real yield is the return on a bond after subtracting inflation, and when it rises, holding gold costs more in forgone income.
Gold rose through the fastest hiking cycle in four decades because real yields, not headline policy rates, set the true cost of holding it, which is why inflation expectations matter as much as the Fed’s next move.
Three pressures have done most of the work:
- Dollar strength and high Treasury yields, which compete directly with gold for safe-haven money
- Fed tightening expectations, which raise the opportunity cost of owning a non-yielding asset
- Futures deleveraging, as traders cut leveraged positions and took profits
Even the recent bounce tells the same story. Reuters reported gold at $4,169.32 on 9 October, recovering from a two-month low earlier that week on bargain-hunting, a softer dollar and easing yields. War headlines barely featured. The slightly higher Investing.com figure from 11 October is the more current reading.
Positioning: funds buying while futures traders leave
COMEX gold open interest, the total number of outstanding futures contracts, fell in the week ending 29 September while ETF holdings rose. Long-term fund buyers were adding exposure just as speculative traders were heading for the exits.
That split amplified the downside. What it tells you is that rate and dollar pressure, not geopolitical fear, has been steering the price, so headlines alone make a weak guide.
When big ASX news breaks, our subscribers know first
Why does a non-yielding asset struggle when rate hikes loom?
The signal is simple to spot. When the market raises its odds of a Fed hike, gold tends to slip; when those odds fall, gold tends to recover.
The mechanism behind it is opportunity cost, meaning the return you give up by choosing one asset over another. Gold pays no interest. Suppose a government bond pays 5% a year: every dollar held in gold instead forgoes that income, and if rates rise further, the sacrifice grows. ANZ put it directly, noting that higher rates make yield-bearing assets more attractive relative to gold.
The current energy shock feeds into this through a chain:
- Conflict disrupts energy supply and pushes fuel prices higher.
- Higher energy costs lift broader inflation.
- Central banks respond by raising, or threatening to raise, interest rates.
- Higher rates increase the opportunity cost of holding gold, weighing on its price.
Some central banks have already hiked in response to energy-driven inflation fears, although the sources do not tie specific non-U.S. decisions to October’s gold moves. In the U.S., the shift in expectations has been measurable.
| Meeting | Early October probability | 9 October probability | Change |
|---|---|---|---|
| October | 22% | 18% | -4 points |
| December | 87% | 82% | -5 points |
Source: CME FedWatch via Reuters.
Reuters reported that soft U.S. data sharply lowered October hike expectations, and Metal.com credited that cooling with lifting precious-metals futures. The chain worked in reverse, exactly as the mechanism predicts.
With December odds still above 80%, you should treat a hotter inflation print as a direct threat to gold rather than a reason to expect hedge demand.
With Chair Warsh having scrapped forward guidance, inflation prints now carry more weight than Fed signals in setting hike odds, so a hot reading can reprice December expectations within hours.
Can the energy ceasefire and Houthi strikes move gold either way?
Both weekend stories are real. Neither delivers a clean gold signal, because each can feed the case for tighter policy as easily as the case for a safe-haven bid.
A ceasefire claim without confirmation
On 11 October, Trump declared an “ENERGY CEASEFIRE” between Russia and Ukraine, saying strikes on energy infrastructure would halt immediately and that Moscow had agreed to supply diesel to global markets. Volodymyr Zelensky, Ukraine’s president, said Kyiv was ready to stop hitting Russian refineries if Moscow halted attacks on Ukraine’s energy system.
That is conditional backing, not a signed deal. The Straits Times reported Russian strikes on several Ukrainian power plants the same day, after the announcement, and none of the cited coverage includes a binding Russian confirmation.
Riyadh strikes and the escalation risk
Houthi rebels struck King Khalid International Airport on Saturday, killing 12 and injuring more than 300, according to the Saudi Civil Aviation Authority. It was the deadliest attack in Saudi Arabia since the Iran war began. The airport stayed closed Sunday, a further strike followed on 11 October, and a projectile landed near Dammam airport.
The International Energy Agency (IEA) urged members to release more emergency diesel stockpiles. Iran’s outreach to Saudi Arabia offers a possible diplomatic path, and Brent crude fell 1.2% in the Investing.com report.
| Scenario | Energy price effect | Inflation and Fed effect | Likely gold impact |
|---|---|---|---|
| Ceasefire holds | Energy-shock premium eases | Less inflation pressure, softer hike case | Mixed: lower haven demand, lighter rate drag |
| Ceasefire collapses | Premium persists | Inflation fears sustained | Headwind via rates |
| Middle East escalates | Energy prices rise | Stronger case for tightening | Haven bid offset by rate risk |
| Diplomacy advances | Volatility eases | Less pressure to hike | Lower haven demand, lighter rate drag |
For you, the point is that the energy and inflation path these events set matters more than the fear they generate.
Are ETF inflows and central bank buying enough to offset Fed risk?
The bull case rests on demand, and the figures are striking.
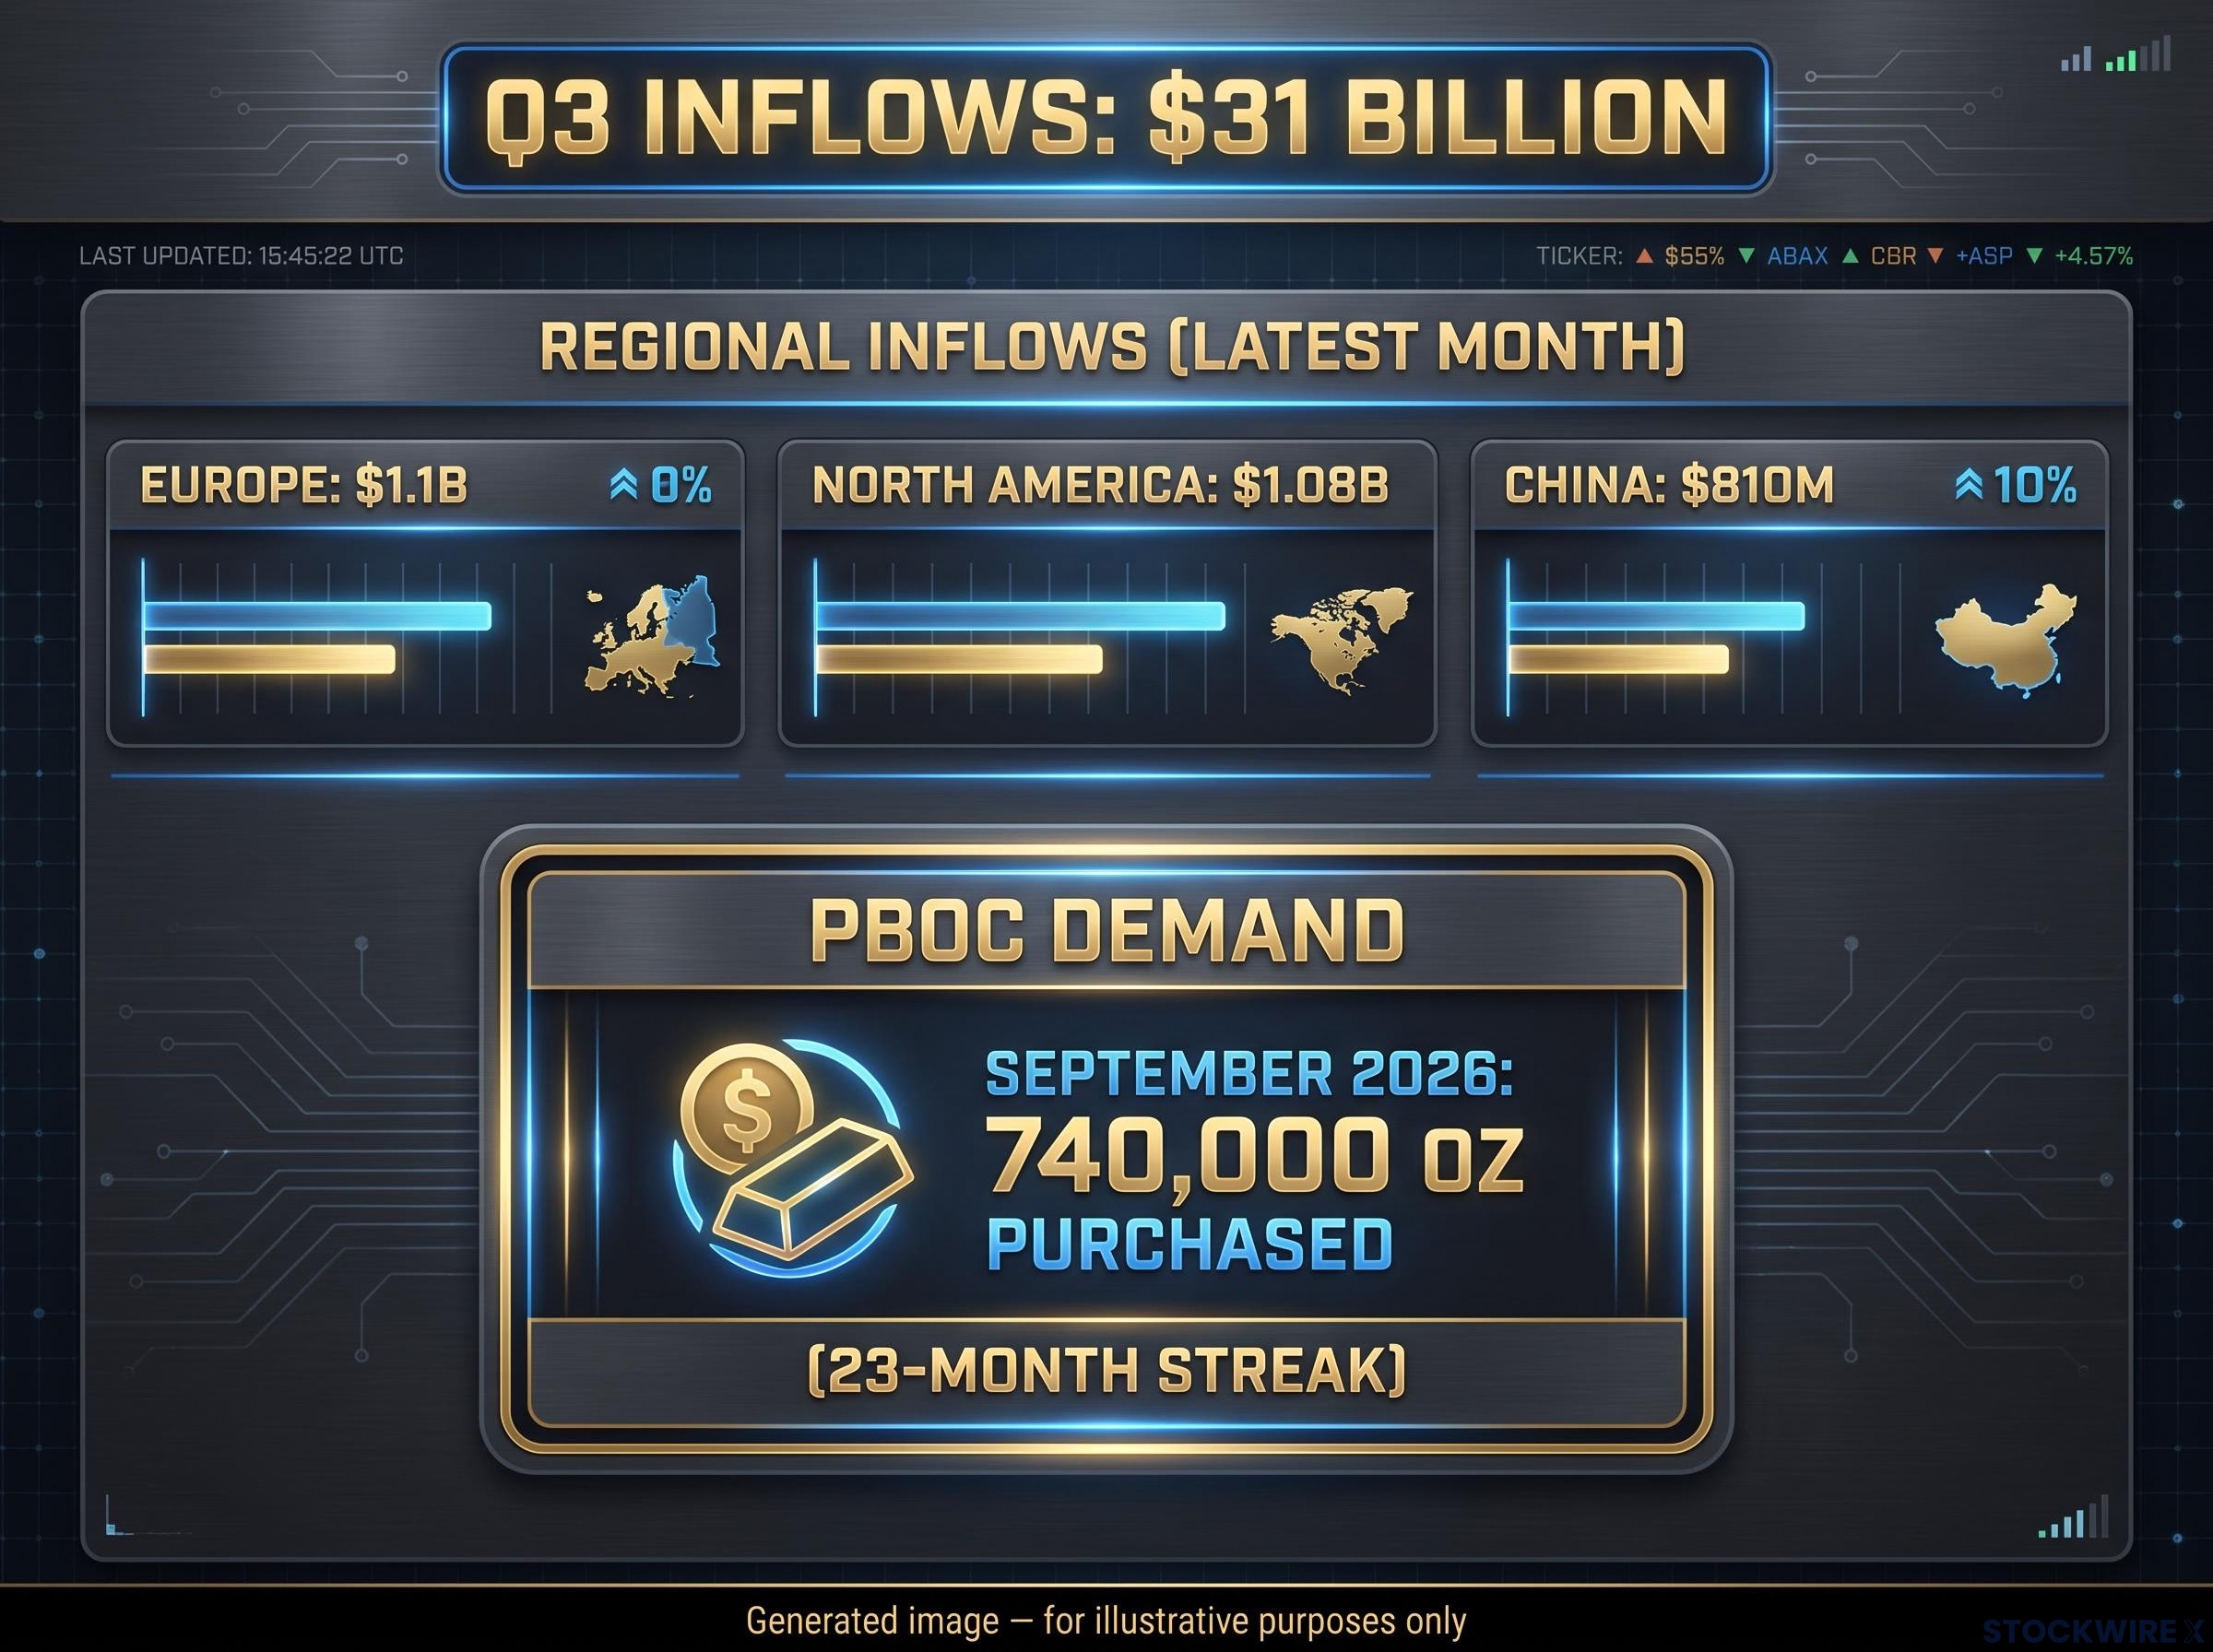
Bloomberg data, cited by TradingKey and ANZ, shows gold-backed ETF inflows at a four-year high. The World Gold Council (WGC) reported record third-quarter inflows of $31 billion and record holdings of 4,256 tonnes.
| Source | Latest figure | Period | What it signals |
|---|---|---|---|
| BMO via Kitco | $3.3B inflows (Europe $1.1B, North America $1.08B, China $810M); holdings 97.3M oz | Latest month | Broad, multi-region buying |
| State Street | $17.1B inflows; $27.7B year to date | August 2026 | Use of gold for inflation hedging and diversification |
| WGC via Metal.com | $10B inflows; AUM down 7% to $574B | September and Q3 2026 | Record flows, but lower prices eroding asset value |
| PBOC | 740,000 oz purchased | September 2026 | Persistent official-sector demand |
A 23-month streak The People’s Bank of China (PBOC) bought gold for the 23rd consecutive month in September. Canaccord, via Kitco, put its purchases over the prior seven months at 1.93 million oz, more than double its total for all of 2025.
Russia has also announced it will quintuple its foreign-exchange and gold purchases between 7 October and 6 November compared with September levels. ANZ links central bank and investor interest to worries over government debt-servicing costs and money supply, yet it also warns that inflation-driven Fed tightening could cap gains.
Where the demand story could crack
Total AUM, the market value of assets held by ETFs, fell 7% quarter on quarter despite record inflows. If prices stay soft, those flows could slow or turn tactical, and shrinking COMEX interest shows speculative demand already lagging fund demand.
ETF flow direction matters because physical accumulation reflects multi-month institutional allocation rather than short-term speculation, and a sharp reversal into outflows would be the first sign that the demand floor is weakening.
Record flows tell you long-term holders are buying the dip. They do not yet guarantee gains if the Fed turns more hawkish. Watch three things:
- U.S. inflation data, due this week
- December hike odds, currently 82%
- ETF flow direction, especially whether inflows hold as prices move
What gold’s next move depends on, and what it does not
Gold is caught between a demand floor built by ETFs and the PBOC and a rates ceiling set by Fed hike odds and real yields. Geopolitics amplifies the swings without setting the direction.
The inverse correlation between gold and real yields has weakened since 2022, as sovereign accumulation and doubts over policy credibility give gold a bid that the rates framework alone does not explain.
That gives you three variables to track: the coming U.S. inflation print, the path of December hike odds, and whether the energy truce or the Riyadh escalation actually moves energy prices.
None of the sources offered historical analogues, so any conclusion rests on current drivers alone. The forward observation is conditional: if inflation cools and hike odds keep sliding, record demand would face less resistance. If not, the floor may simply be holding the line.
This article is for informational purposes only and should not be considered financial advice. Investors should conduct their own research and consult with financial professionals before making investment decisions. Past performance does not guarantee future results, and forward-looking statements are speculative and subject to change based on market developments.