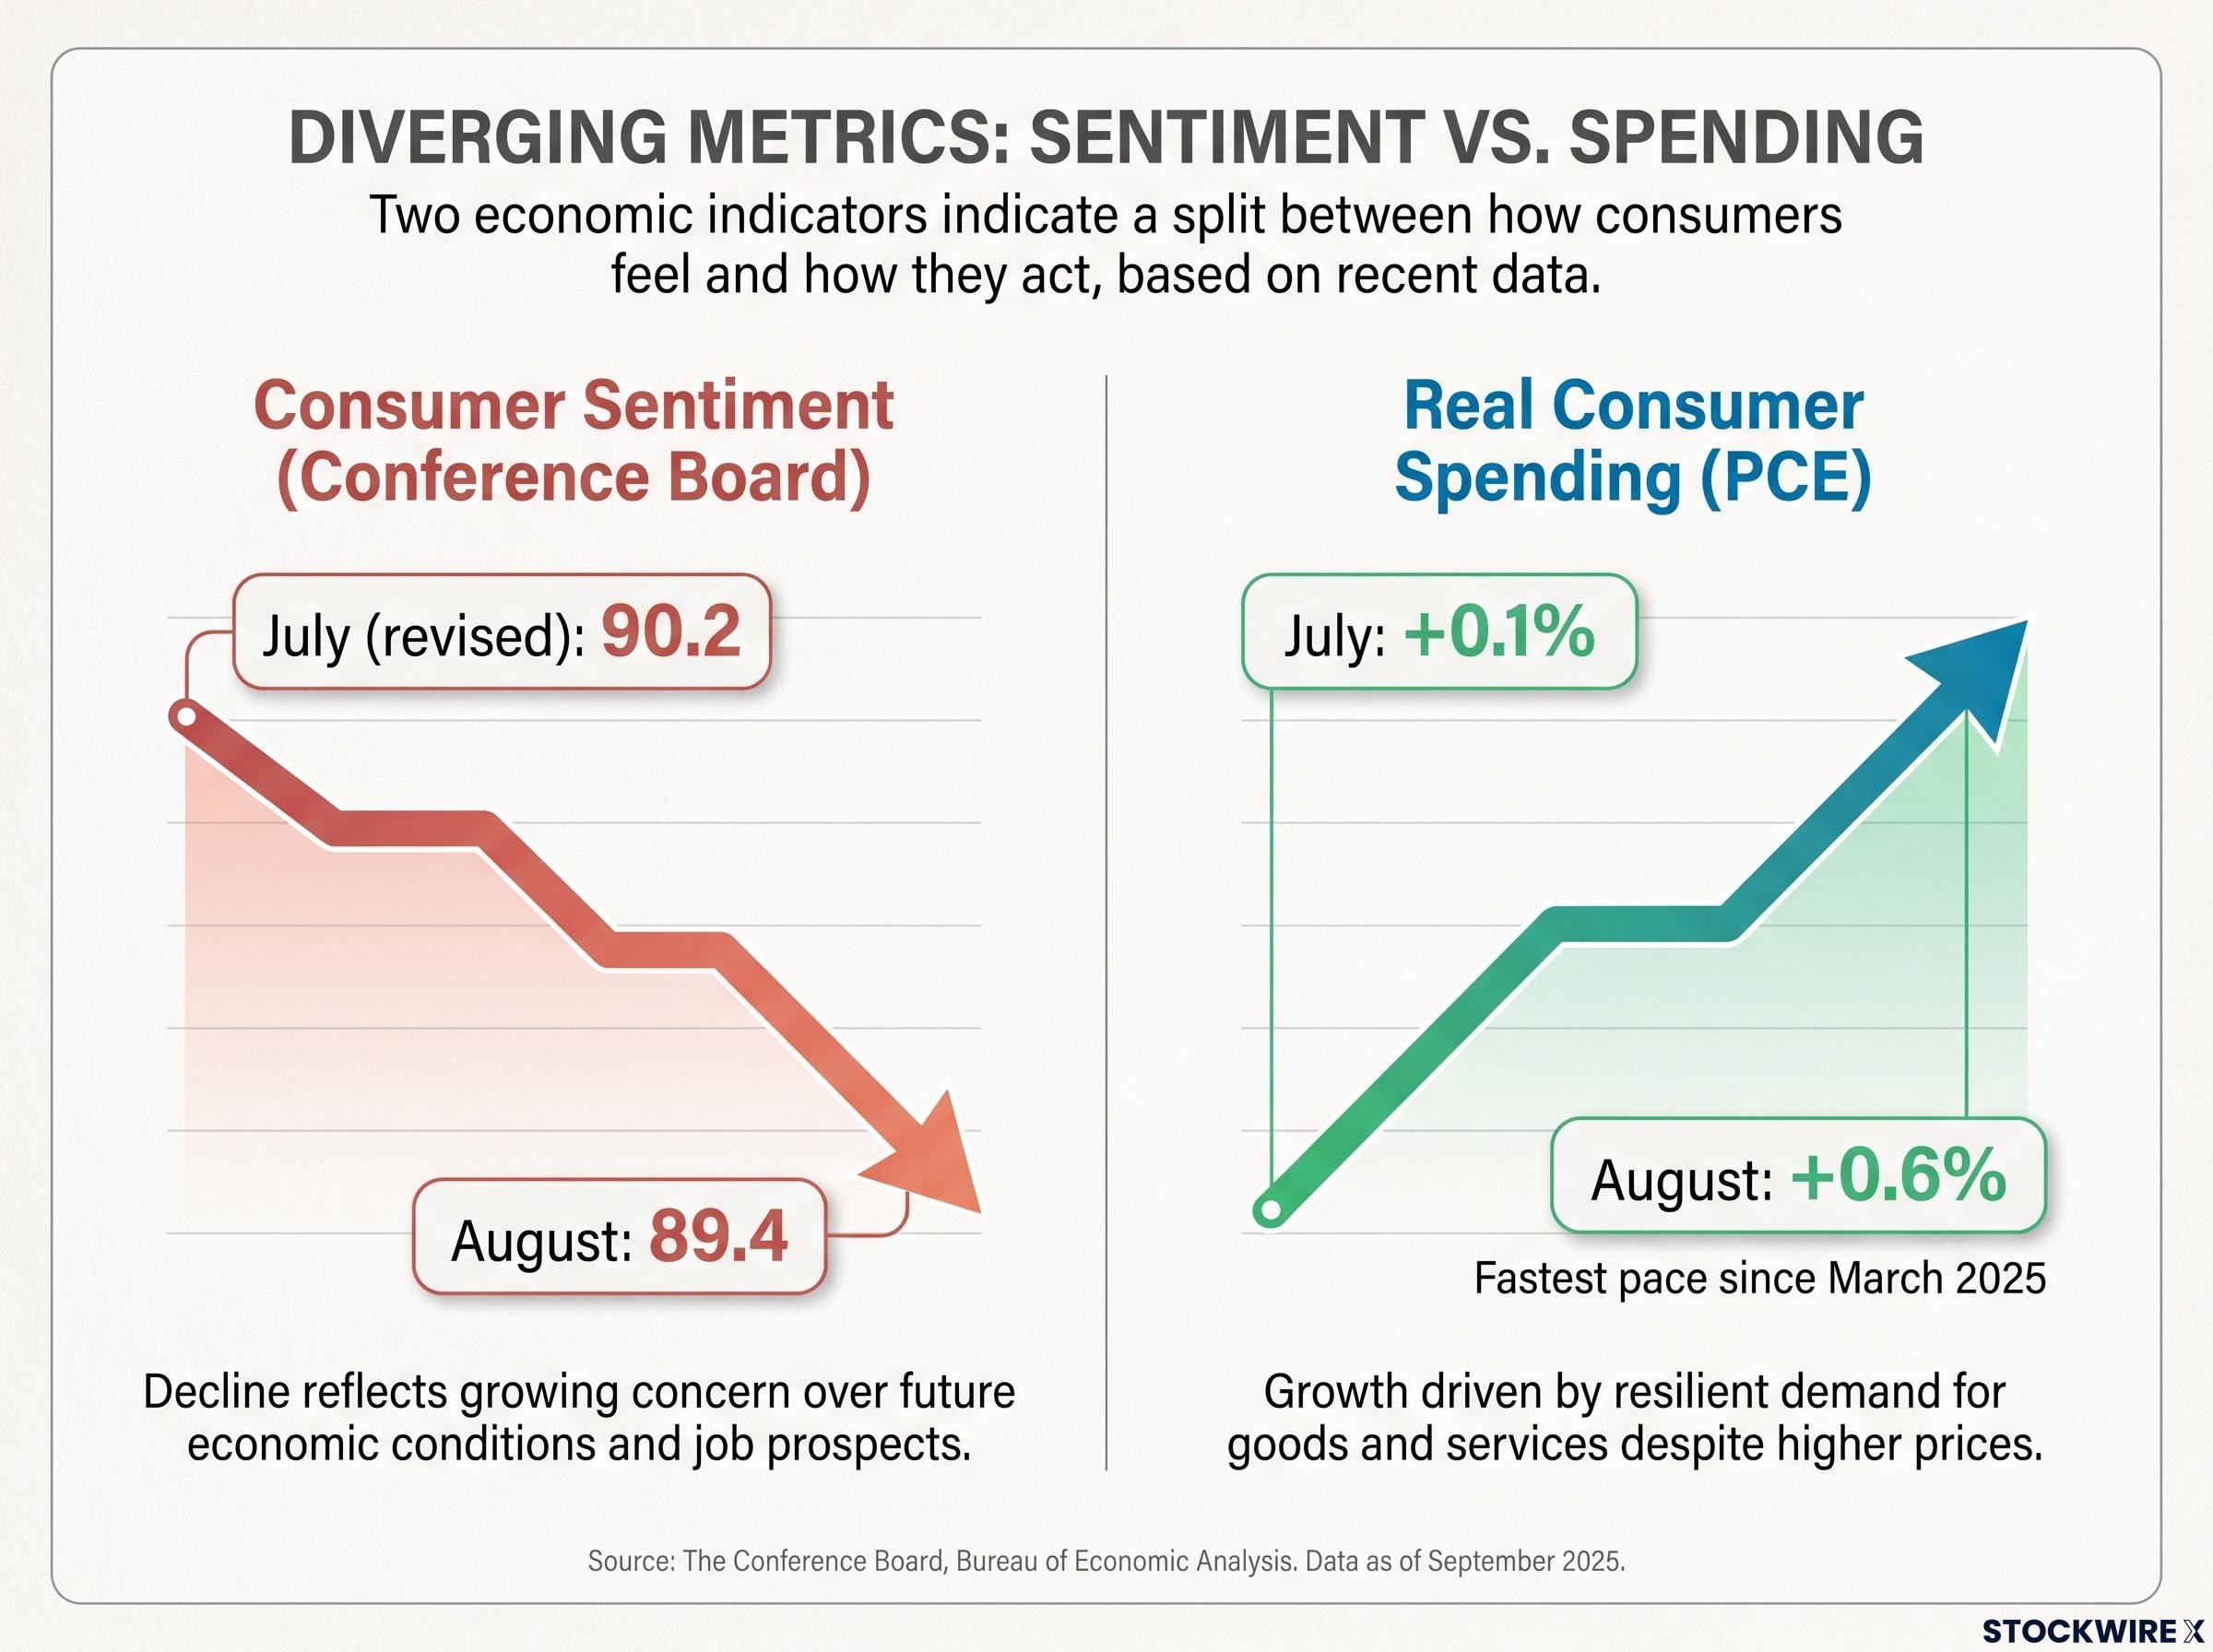
The Conference Board’s consumer confidence index slipped to 89.4 in August, its latest sign of a gloomy public. Yet the August PCE data showed real consumer spending jumping 0.6% that month, the fastest pace since March 2025. That gap between how Americans say they feel and how they actually spend is the signal many investors are missing.
The Bureau of Economic Analysis (BEA) published the figures on 30 September 2026, more than a week ago. They arrived against a difficult backdrop: a US-Israeli war with Iran, rising petrol prices and persistent worry about inflation. In that environment, the numbers are easy to misread in either direction.
The main challenge is separating the energy shock from the underlying trend. Get that wrong and you either overreact to scary headlines or overlook genuine risks.
What the August PCE data says about inflation: cooler, but not cool
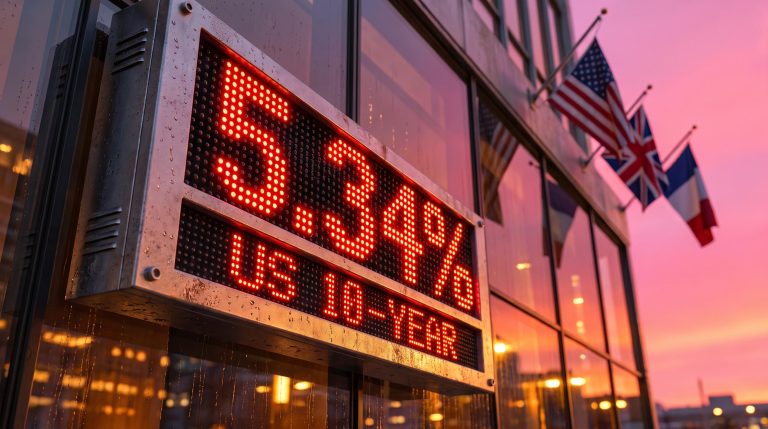
The first reaction was relief. The personal consumption expenditures (PCE) price index measures how much prices rise across the goods and services households buy, and it is the Federal Reserve’s preferred inflation gauge. Headline PCE rose 0.3% in August. Core PCE, which strips out volatile food and energy, rose 0.2%.
Both monthly gains came in below forecasts. CNBC called them much lighter than expected, and Reuters said the softer reading gave the Fed “breathing space.”
The details are more complicated. Annual inflation stood at 3.4% headline and 3.0% core. Some coverage presented this as a sharp drop from 3.7% and 3.3%, but those were July’s original figures. The BEA revised July down to 3.4% and 3.0%, so August’s annual rates simply matched the corrected July readings.
| Measure | July (revised) m/m | August m/m | August y/y |
|---|---|---|---|
| Headline PCE | +0.1% | +0.3% | 3.4% |
| Core PCE | +0.1% | +0.2% | 3.0% |
There is another complication. The BEA changed how it measures several components, and those changes pushed the core reading lower.
Measurement, not just prices Revised BEA methods for legal services, software and portfolio management lowered core PCE by roughly 36 basis points. A basis point is one-hundredth of a percentage point. TechTimes cautioned that part of the apparent cooling therefore reflects a change in measurement rather than genuine price relief.
Both measures remain well below their May peaks. They are also still far above the Fed’s 2% target. With core inflation at 3.0%, disinflation is making progress but is far from finished. You should not treat this print as a green light for aggressive rate-cut bets, since rate expectations feed directly into the valuations you pay for stocks.
With core inflation at 3.0% and unemployment low, the Fed’s dual mandate leaves policymakers leaning hardest on price stability, which is why a single softer print is unlikely to shift the rate path on its own.
When big ASX news breaks, our subscribers know first
Is energy distorting the inflation picture? Separating the shock from the trend
If core inflation is easing, why does the headline figure still look stubborn? Look at the energy numbers and the answer becomes clear.
- Petrol: up 4.4% in August
- Petrol and other energy goods: up 27.9% over the year
- Goods inflation: 3.6% annually, up from 3.3% in July
- Services inflation: 3.4% annually, unchanged and in line with its trend since 2024
- PCE excluding energy: 2.9% annually
The pressure is coming from one place. Goods inflation rose because petrol rebounded. Services inflation, which covers most of what households spend on, held steady.
The ex-energy figure is the clearest comparison. The New York Times reported that PCE excluding energy ran between 4.0% and 6.0% during the inflation surge of 2022-2023. At 2.9%, this episode is fundamentally different: the earlier spike was broad, while this one is concentrated in energy.
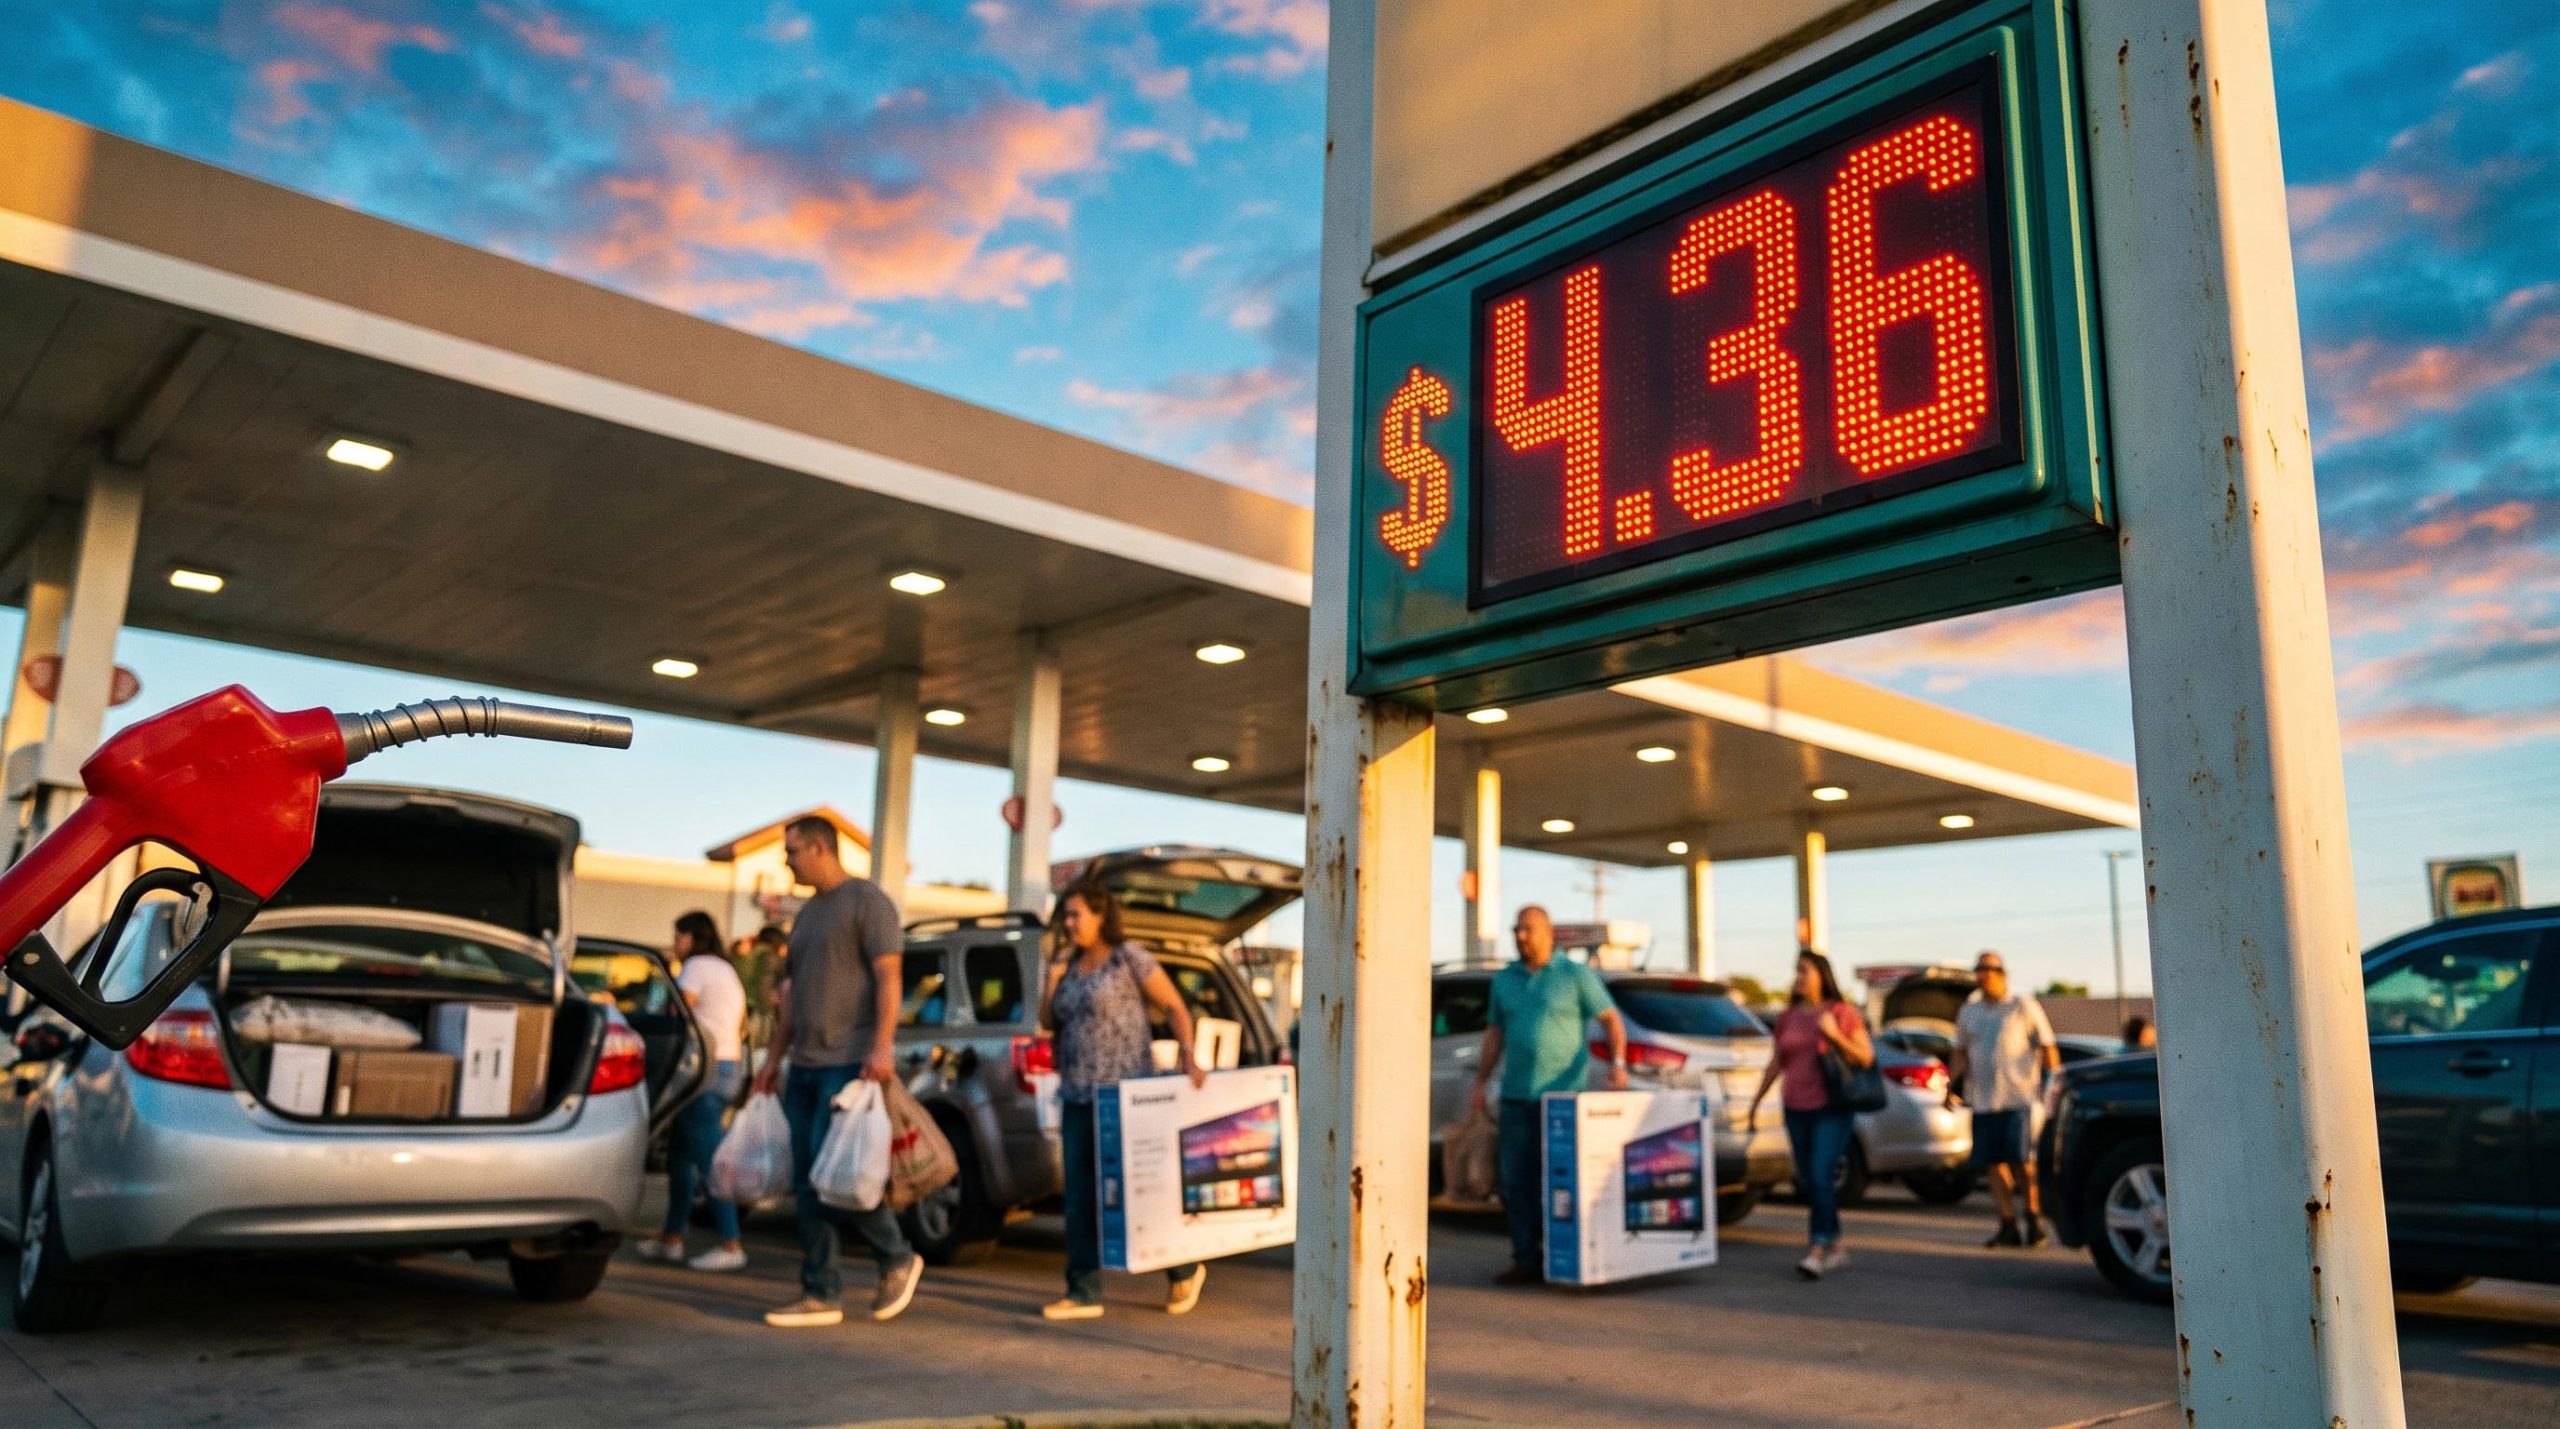
So far, higher energy costs have not spread into food, clothing, housing or health care. Those categories continue to cool from their post-pandemic highs. Reuters links elevated inflation to the Iran war, and fuel prices have kept rising since August. Energy Information Administration data shows regular petrol averaging about $4.36 a gallon in September, up 7.3% from August and 37.6% from a year earlier.
This concentration matters for your outlook. A reversal in fuel prices could bring the headline rate down quickly. A further spike, however, would land on an inflation rate that has not yet reached the target.
Where pass-through could show up next
The bear case depends on pass-through, which is when one cost rise feeds into the prices of other goods and services. If energy stays volatile, transport, goods and services costs could begin to rise, which would reignite inflation. That spread is the main risk to watch.
Economists describe two transmission channels for an oil shock: a direct hit through petrol prices, and an indirect one through logistics and supply chains that can take 6-12 months to appear in core measures.
How are consumers coping with pricier fuel? Real spending says adaptation, not retreat
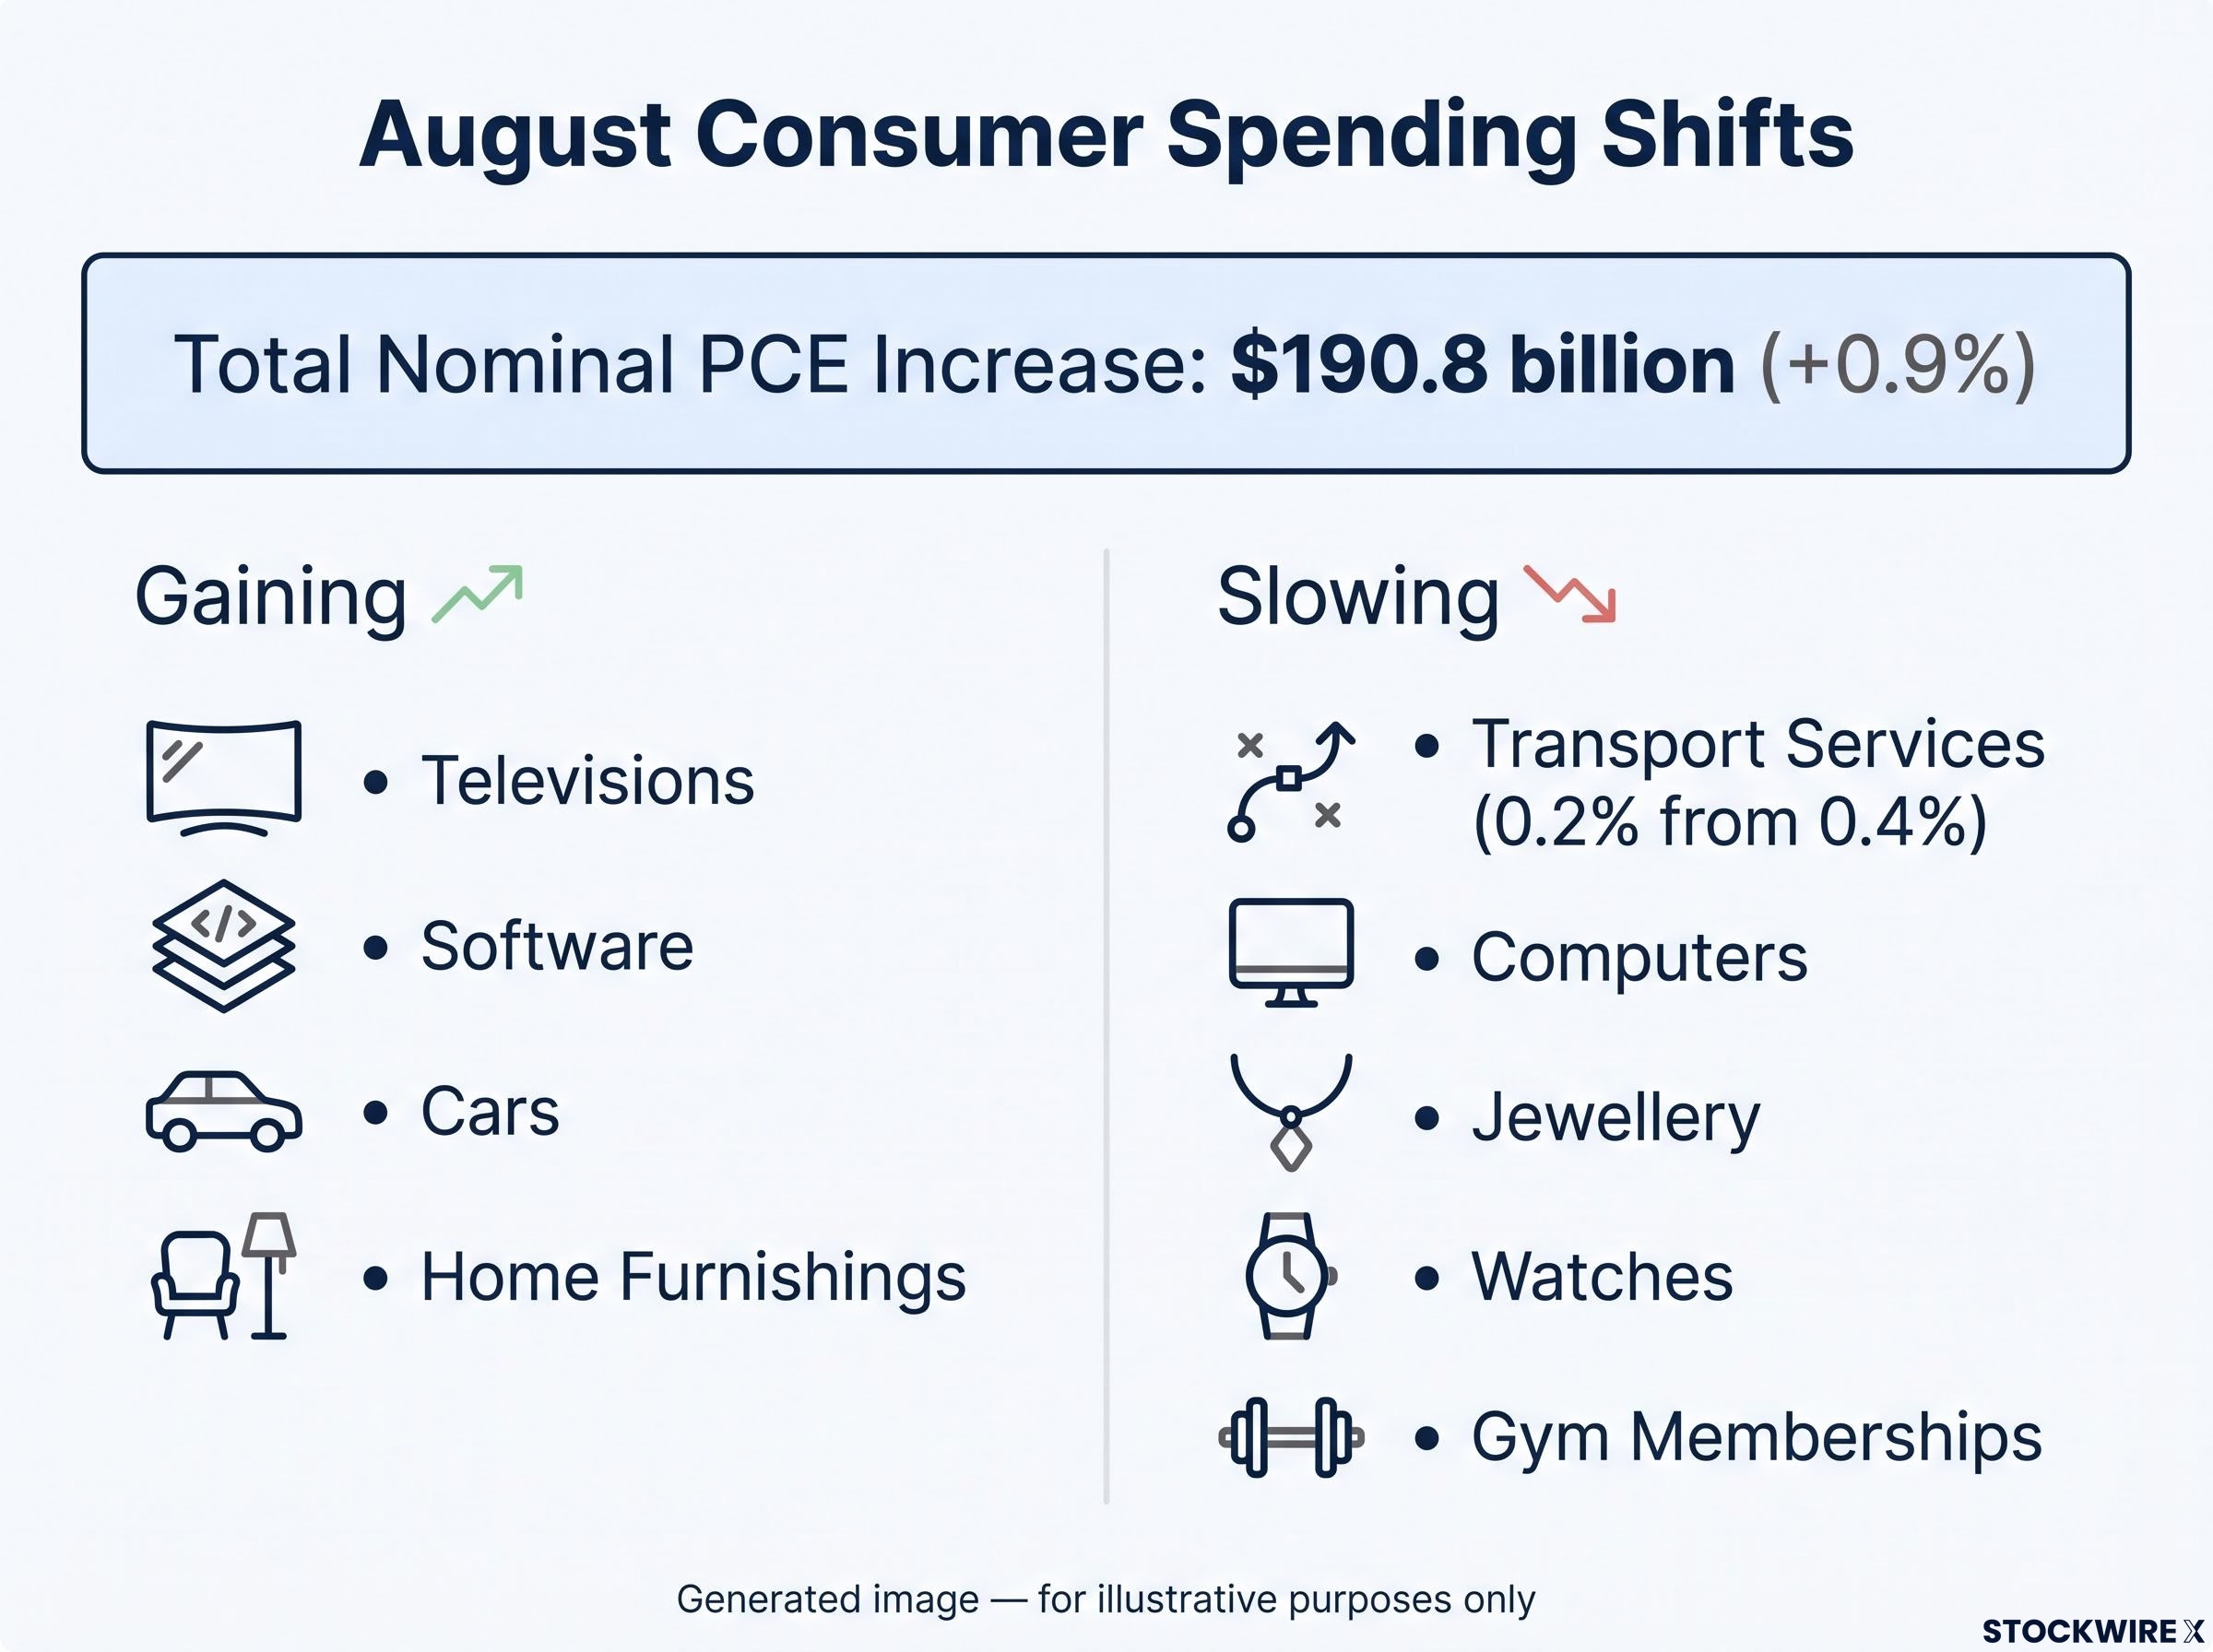
The spending figures were stronger than the inflation data suggested. Nominal PCE, meaning spending in current dollars, rose $190.8 billion, or 0.9%, in August. Goods accounted for $114.1 billion and services for $76.7 billion.
The number that matters Real PCE, which is spending adjusted for inflation, rose $92.8 billion, or 0.6%, in August, up from 0.1% in July. It increased 2.6% over the year.
That matters because consumption makes up more than two-thirds of US economic activity. Reuters described spending as surging, which keeps consumption on course for another solid quarter after the second quarter’s revised 3.8% annualised pace.
The surprise is where the money went. It did not go to petrol stations, because spending on energy goods stalled. Instead, households redirected their spending:
- Gaining: televisions, software, cars, home furnishings
- Slowing: transport services such as car rentals, airlines and taxis (0.2% from 0.4%), computers, jewellery, watches and gym memberships
The pattern suggests people are taking fewer discretionary trips to save fuel and moving money between categories. Reuters had already noted in July that personal incomes were rising faster than inflation, which preserves purchasing power even when the mood is sour.
When spending keeps growing after adjusting for inflation, households are absorbing the energy shock by changing their behaviour. For your portfolio, that means pessimistic surveys are not a recession signal on their own. Track where spending is moving, not just whether it is rising, when you judge earnings in consumer-linked sectors.
Why the sentiment gap matters for investors: the wall of worry and its limits
Why mood and data diverge
The Conference Board’s index fell to 89.4 in August from a revised 90.2 in July. Twelve-month inflation expectations rose to 5.8% from 5.6%. The expectations index declined, but assessments of present conditions improved modestly.
Four forces help explain the gap. First, incomes outpaced inflation in mid-2026. Second, strong labour markets and asset prices supported spending. Third, petrol prices are highly visible, which drags down sentiment more than spending. Fourth, households are adjusting their behaviour rather than cutting back.
Part of the divergence reflects survey distortions such as partisan bias and price anchoring, which can push sentiment readings lower even when household finances are broadly stable, a point that weakens sentiment as a timing tool.
History offers a reference point. In 2022, inflation hit multi-decade highs after Russia’s invasion of Ukraine. Sentiment collapsed and stocks fell into a shallow bear market, but there was no recession, and real spending held up better than feared.
Fisher Investments’ editors argue that lingering inflation fear is one more brick in the stock market’s wall of worry. The wall of worry is the idea that markets can keep rising despite widespread anxiety. That is an opinion, not a forecast.
What could break the pattern
| Factor | Bull read | Bear read |
|---|---|---|
| Inflation | Ex-energy at 2.9%, no broad spread | Core stuck near 3.0%; energy could reignite it |
| Households | Real spending up 0.6% | Lower-income households strained; budgets stretched |
| Policy | Softer print gives the Fed flexibility | Rates held high could weigh on housing, cars and business investment |
A persistent gap between gloomy sentiment and solid spending tells you that sentiment alone is a weak timing tool. Watch these signals instead:
- Real spending turning negative
- A pullback among lower-income households
- A sharp tightening of financial conditions
- A renewed energy spike feeding into other prices
If any of these appears, the view should change.
What the August data changes, and what it leaves open
August confirmed three things. Inflation is cooling but remains above target and distorted by energy prices. Consumers are adapting by redirecting spending rather than cutting back. And sentiment has been a weaker guide than actual spending and income.
What the data cannot settle is direction. Before your next portfolio decision, track four variables: energy prices, the core PCE trend, real spending among lower-income households, and the labour market. Positive real income and spending have historically supported risk assets. A break in any of these four would be the signal to take seriously.
For readers wanting to turn this gap into positioning, our detailed coverage of consumer sector valuations shows why the Consumer Discretionary ratio to the S&P 500 sits at a 20-year low.
This article is for informational purposes only and should not be considered financial advice. Investors should conduct their own research and consult with financial professionals before making investment decisions. Past performance does not guarantee future results. These statements are speculative and subject to change based on market developments.