Applied Digital’s revenue jumped 322% last quarter. Purchases of property and equipment rose about 730% over the same period. Samsung Electronics posted the largest quarterly profit in Korean corporate history, and its shares still fell.
Neither reaction is a market malfunction. Results released between 6 October and 8 October 2026 show AI capital spending lifting revenue and profit across the supply chain while consuming enormous amounts of cash. The headline growth is real, but it covers only part of what moved these share prices.
If you read only the revenue line, you can miss the figures that set the price reaction: how much cash the business consumes, who funds the shortfall and how much good news investors had already priced in.
This analysis gives you a repeatable way to weigh growth against cash flow and expectations before you act on the next AI earnings beat.
Applied Digital’s quarter: a 322% revenue jump and a $2 billion cash hole
The results
On the surface, Applied Digital‘s fiscal Q1 2027, the quarter ended 31 August 2026, was a clean win. Revenue reached $341.9 million, up from $80.9 million a year earlier. MarketBeat’s lower figure of $300.4 million reflects the company’s adjusted revenue measure.
Adjusted EBITDA (earnings before interest, tax, depreciation and amortisation, with certain one-off items removed) rose to $64.4 million from $0.5 million. The adjusted net loss narrowed to $4.1 million, or -$0.01 per share, against consensus of roughly -$0.27 to -$0.30. On the standard accounting basis, known as GAAP (generally accepted accounting principles), the loss was much larger at $221.0 million, or $0.76 per share.
| Metric | Fiscal Q1 2027 | Fiscal Q1 2026 | Change |
|---|---|---|---|
| Revenue | $341.9M | $80.9M | +322% |
| Adjusted EBITDA | $64.4M | $0.5M | Up sharply |
| Property and equipment purchases | ~$2.07B (total capex) | Not disclosed in research | +730% |
Where the cash went
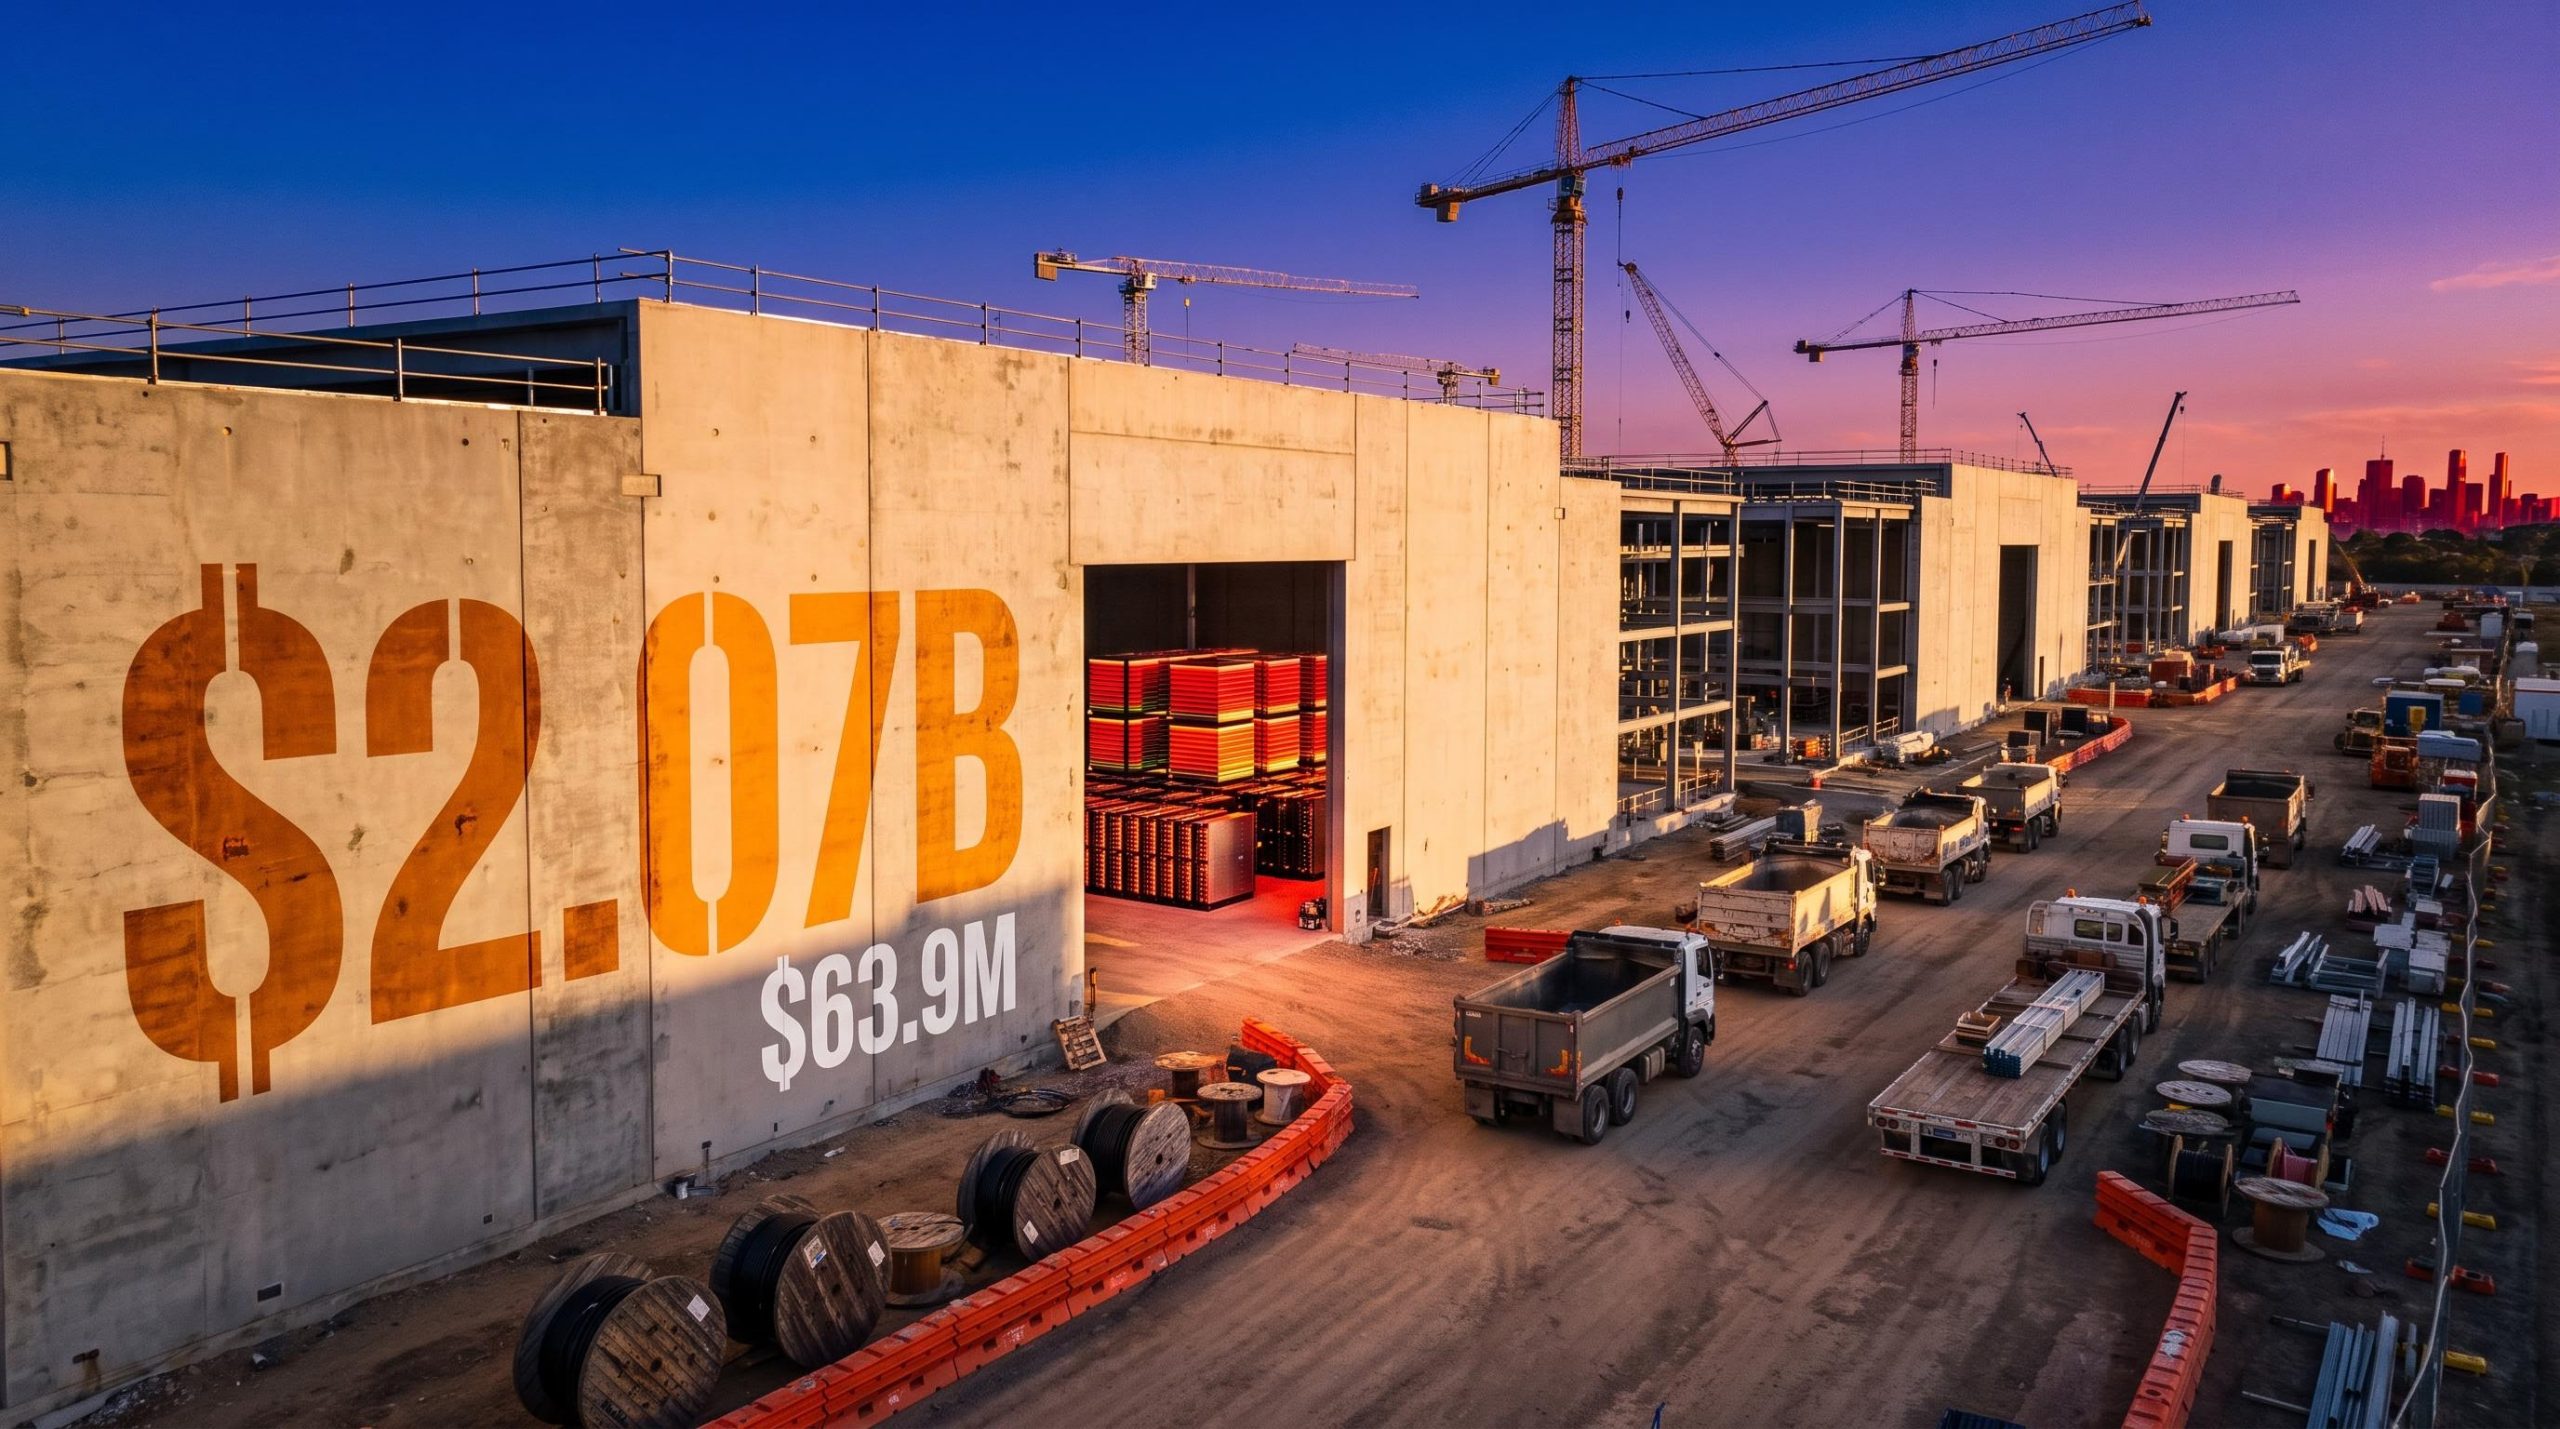
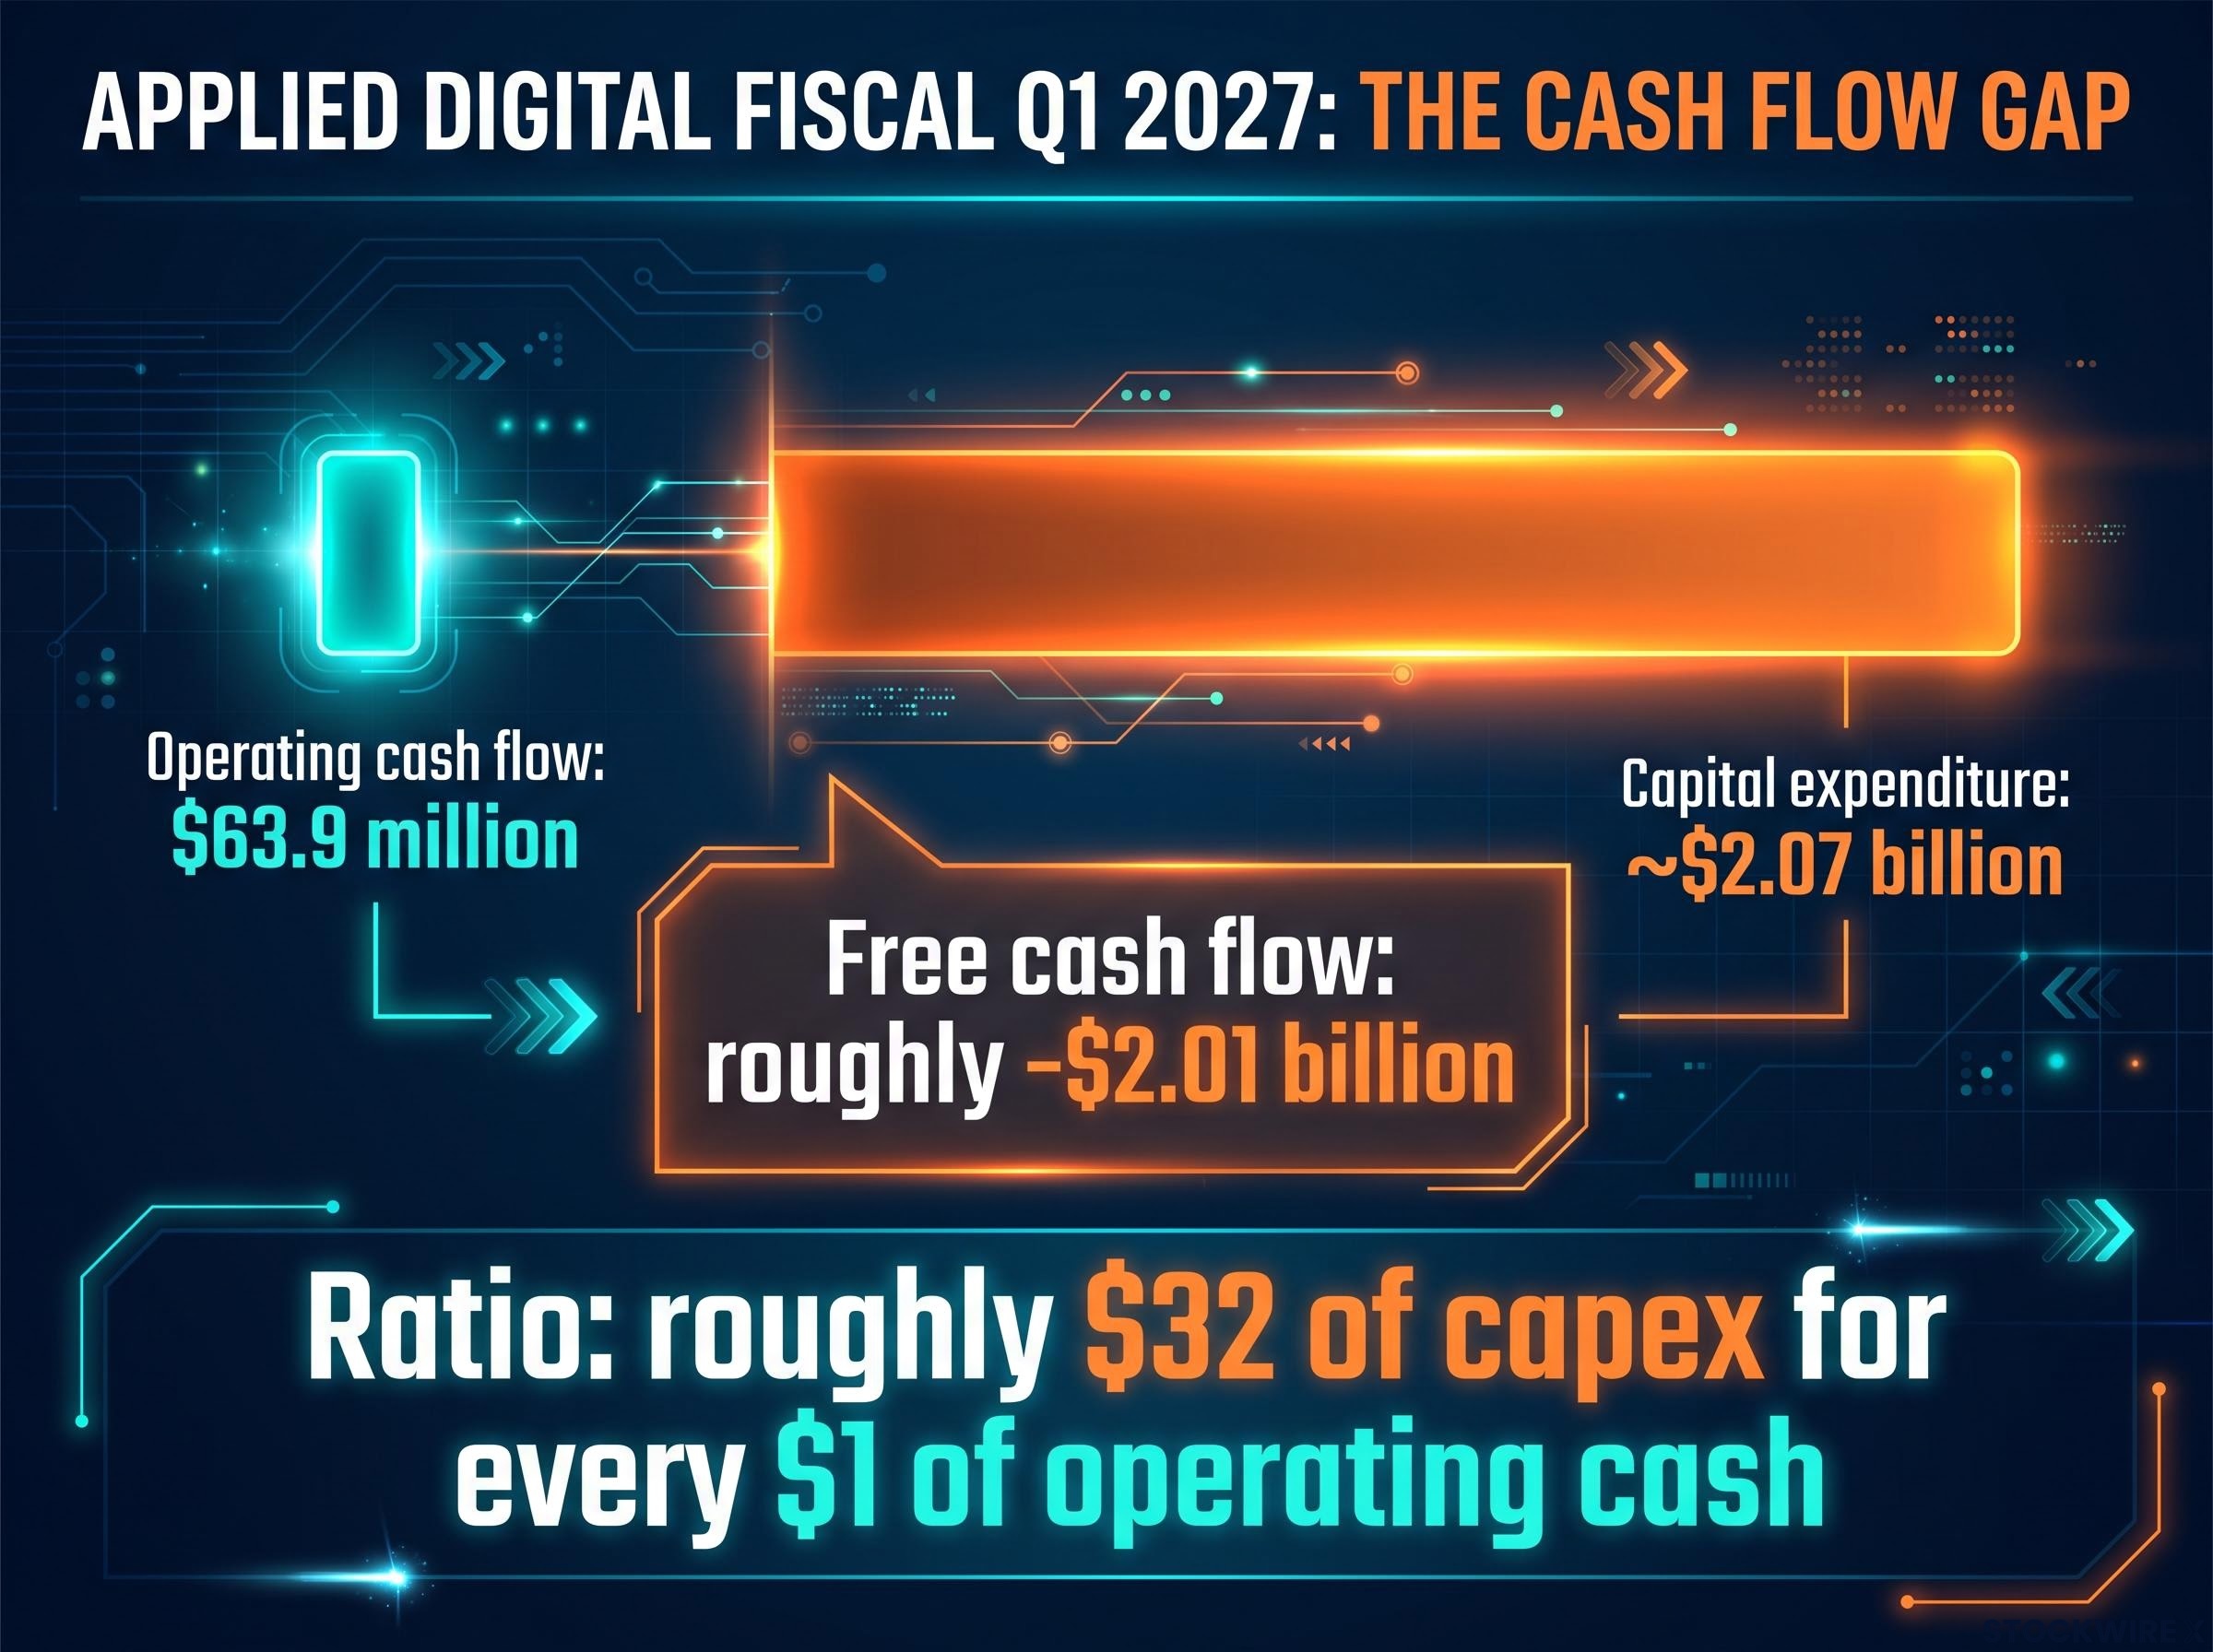
The cash flow statement changes the picture. Operating cash flow was $63.9 million, while capital expenditure (money spent on long-term assets such as buildings and equipment) reached about $2.07 billion. That leaves free cash flow of roughly -$2.01 billion.
One 24/7 Wall St live blog cited a $1.16 billion burn. The figure used here comes from the company’s own operating cash flow and capex disclosures.
Applied Digital points to a lease backlog of about 1.41 GW, worth roughly $36 billion in contracted revenue over initial terms and up to about $86 billion if tenants exercise all renewals. To fund the build-out, the company raised $1.59 billion of 7.000% senior secured notes due 2031 and $275 million of Series G preferred stock.
Vital Knowledge’s read The research house said the results capture the AI sector’s rapid growth and its massive capital requirements at the same time.
Reports conflict on the share price move. One account has the stock falling about 6% intraday to $23.81 before a modest after-hours recovery. Either way, investors focused on the cash burn rather than the earnings beat.
That gap between $64 million of operating cash and $2 billion of spending tells you the company’s growth depends on outside capital. If you hold or are considering the stock, access to financing is part of the investment case, not a background detail.
When big ASX news breaks, our subscribers know first
Samsung’s record profit and the expectations problem
Applied Digital shows what happens when spending outpaces cash generation. Samsung shows a different problem: what happens when the profit arrives but the market expected it.
The preliminary Q3 2026 result, announced on 8 October, put operating profit at about 107.4 trillion won (roughly US$80.1 billion), up from 12.2 trillion won a year earlier. Sales exceeded 195 trillion won, compared with 86.06 trillion won. Memory drove the result, led by high-bandwidth memory (HBM), a stacked chip design used in AI processors, and server DRAM (dynamic random-access memory).
Samsung’s record quarter reflects a memory chip shortage in which DRAM contract prices have risen sharply and hyperscalers now sign multi-year, deposit-backed supply agreements, which is part of why the market treated the profit as expected.
This was Samsung’s fourth consecutive record quarter and the largest quarterly profit ever reported by a Korean company. It was still close to forecasts rather than well above them.
| Measure | Operating profit (trillion won) | Result versus forecast |
|---|---|---|
| Samsung preliminary Q3 2026 | 107.4 | Not applicable |
| Bloomberg consensus | 108.67 | Slightly short |
| LSEG consensus | 106.1 | Slightly above |
Another report put the result about 1.6% above average consensus. The shares fell in volatile trading, pulling down the KOSPI (South Korea’s main share index), and SK Hynix fell with them. Coverage points to three reasons:
- Priced for perfection: after a strong rally, a near-in-line result gave buyers little new reason to pay more.
- Cycle-peak worry: record memory profits prompt questions about whether pricing and volumes are close to their peak.
- Yield pressure: rising bond yields weighed on equity markets more broadly.
Two caveats apply. These are preliminary figures, and specific HBM, DRAM and NAND contract pricing was not available around the release.
The lesson for you is direct. A record that only matches forecasts tells you the good news was already in the price, so the question for any AI-linked stock is what it needed to beat, not simply what it earned.
How to read growth against cash flow and expectations
Together, the two cases show the main ways a strong result can still disappoint. The useful step is turning them into a set of questions you can apply to the next report.
Start with three numbers that can tell different stories. Revenue growth shows how quickly sales are rising. Free cash flow, which is operating cash flow minus capital expenditure, shows whether the business funds itself. Adjusted measures remove items management considers unusual, while GAAP figures include everything.
Morgan Stanley data from this earnings season shows that stocks whose free cash flow estimates rise alongside EPS outperform peers, while EPS beats paired with falling free cash flow lag, which is why the cash line deserves as much attention as the headline.
Applied Digital spent roughly $32 of capex for every $1 of operating cash, about $2.07 billion against $63.9 million. Its adjusted EBITDA of $64.4 million sits beside a GAAP loss of $221.0 million. This is a capital-hungry builder relying on contracted leases to justify spending ahead of revenue.
Samsung is the opposite case: a profitable incumbent whose profit rose nearly tenfold, yet whose shares still fell on a near-in-line result. Memory is a historically cyclical business, so even a structural AI tailwind does not remove the boom-and-bust pattern.
Investors commonly compare today’s spending to two earlier build-outs. The early-2000s telecom and fibre boom produced strong traffic growth, but debt-funded overbuilding led to weak returns. The 2010s hyperscale cloud cycle suppressed free cash flow for years before utilisation caught up.
Before you react to the next AI result, work through four steps:
- Compare growth to capex. If spending grows faster than revenue, find out why.
- Check free cash flow and funding. Identify who covers the gap and on what terms.
- Compare adjusted figures with GAAP. A wide gap shows how many costs sit outside the headline.
- Compare the result with consensus. The bar is expectations, not last year’s number.
Rule of thumb Growth tells you how fast a company is moving. Cash flow and expectations tell you whether the market will pay for that speed.
A growth rate alone cannot show whether a company is creating value or simply consuming capital. You need all four steps to see which one is happening.
The financing wave and the cycle risk behind the numbers
Debt and yields
Applied Digital’s note sale is one small part of a much larger borrowing wave. Several large AI-linked financings were reported in progress this month:
- Broadcom is seeking more than $50 billion, including private credit discussions, according to the Wall Street Journal.
- Oracle is in talks with Apollo and Goldman Sachs about funding a major chip purchase, with the amount unspecified, the WSJ reported.
- SpaceX is negotiating about $40 billion, made up of $30 billion in investment-grade bonds and $10 billion in bank loans, according to Axios and other reports. That follows its record $86 billion June IPO and $25 billion of bond sales.
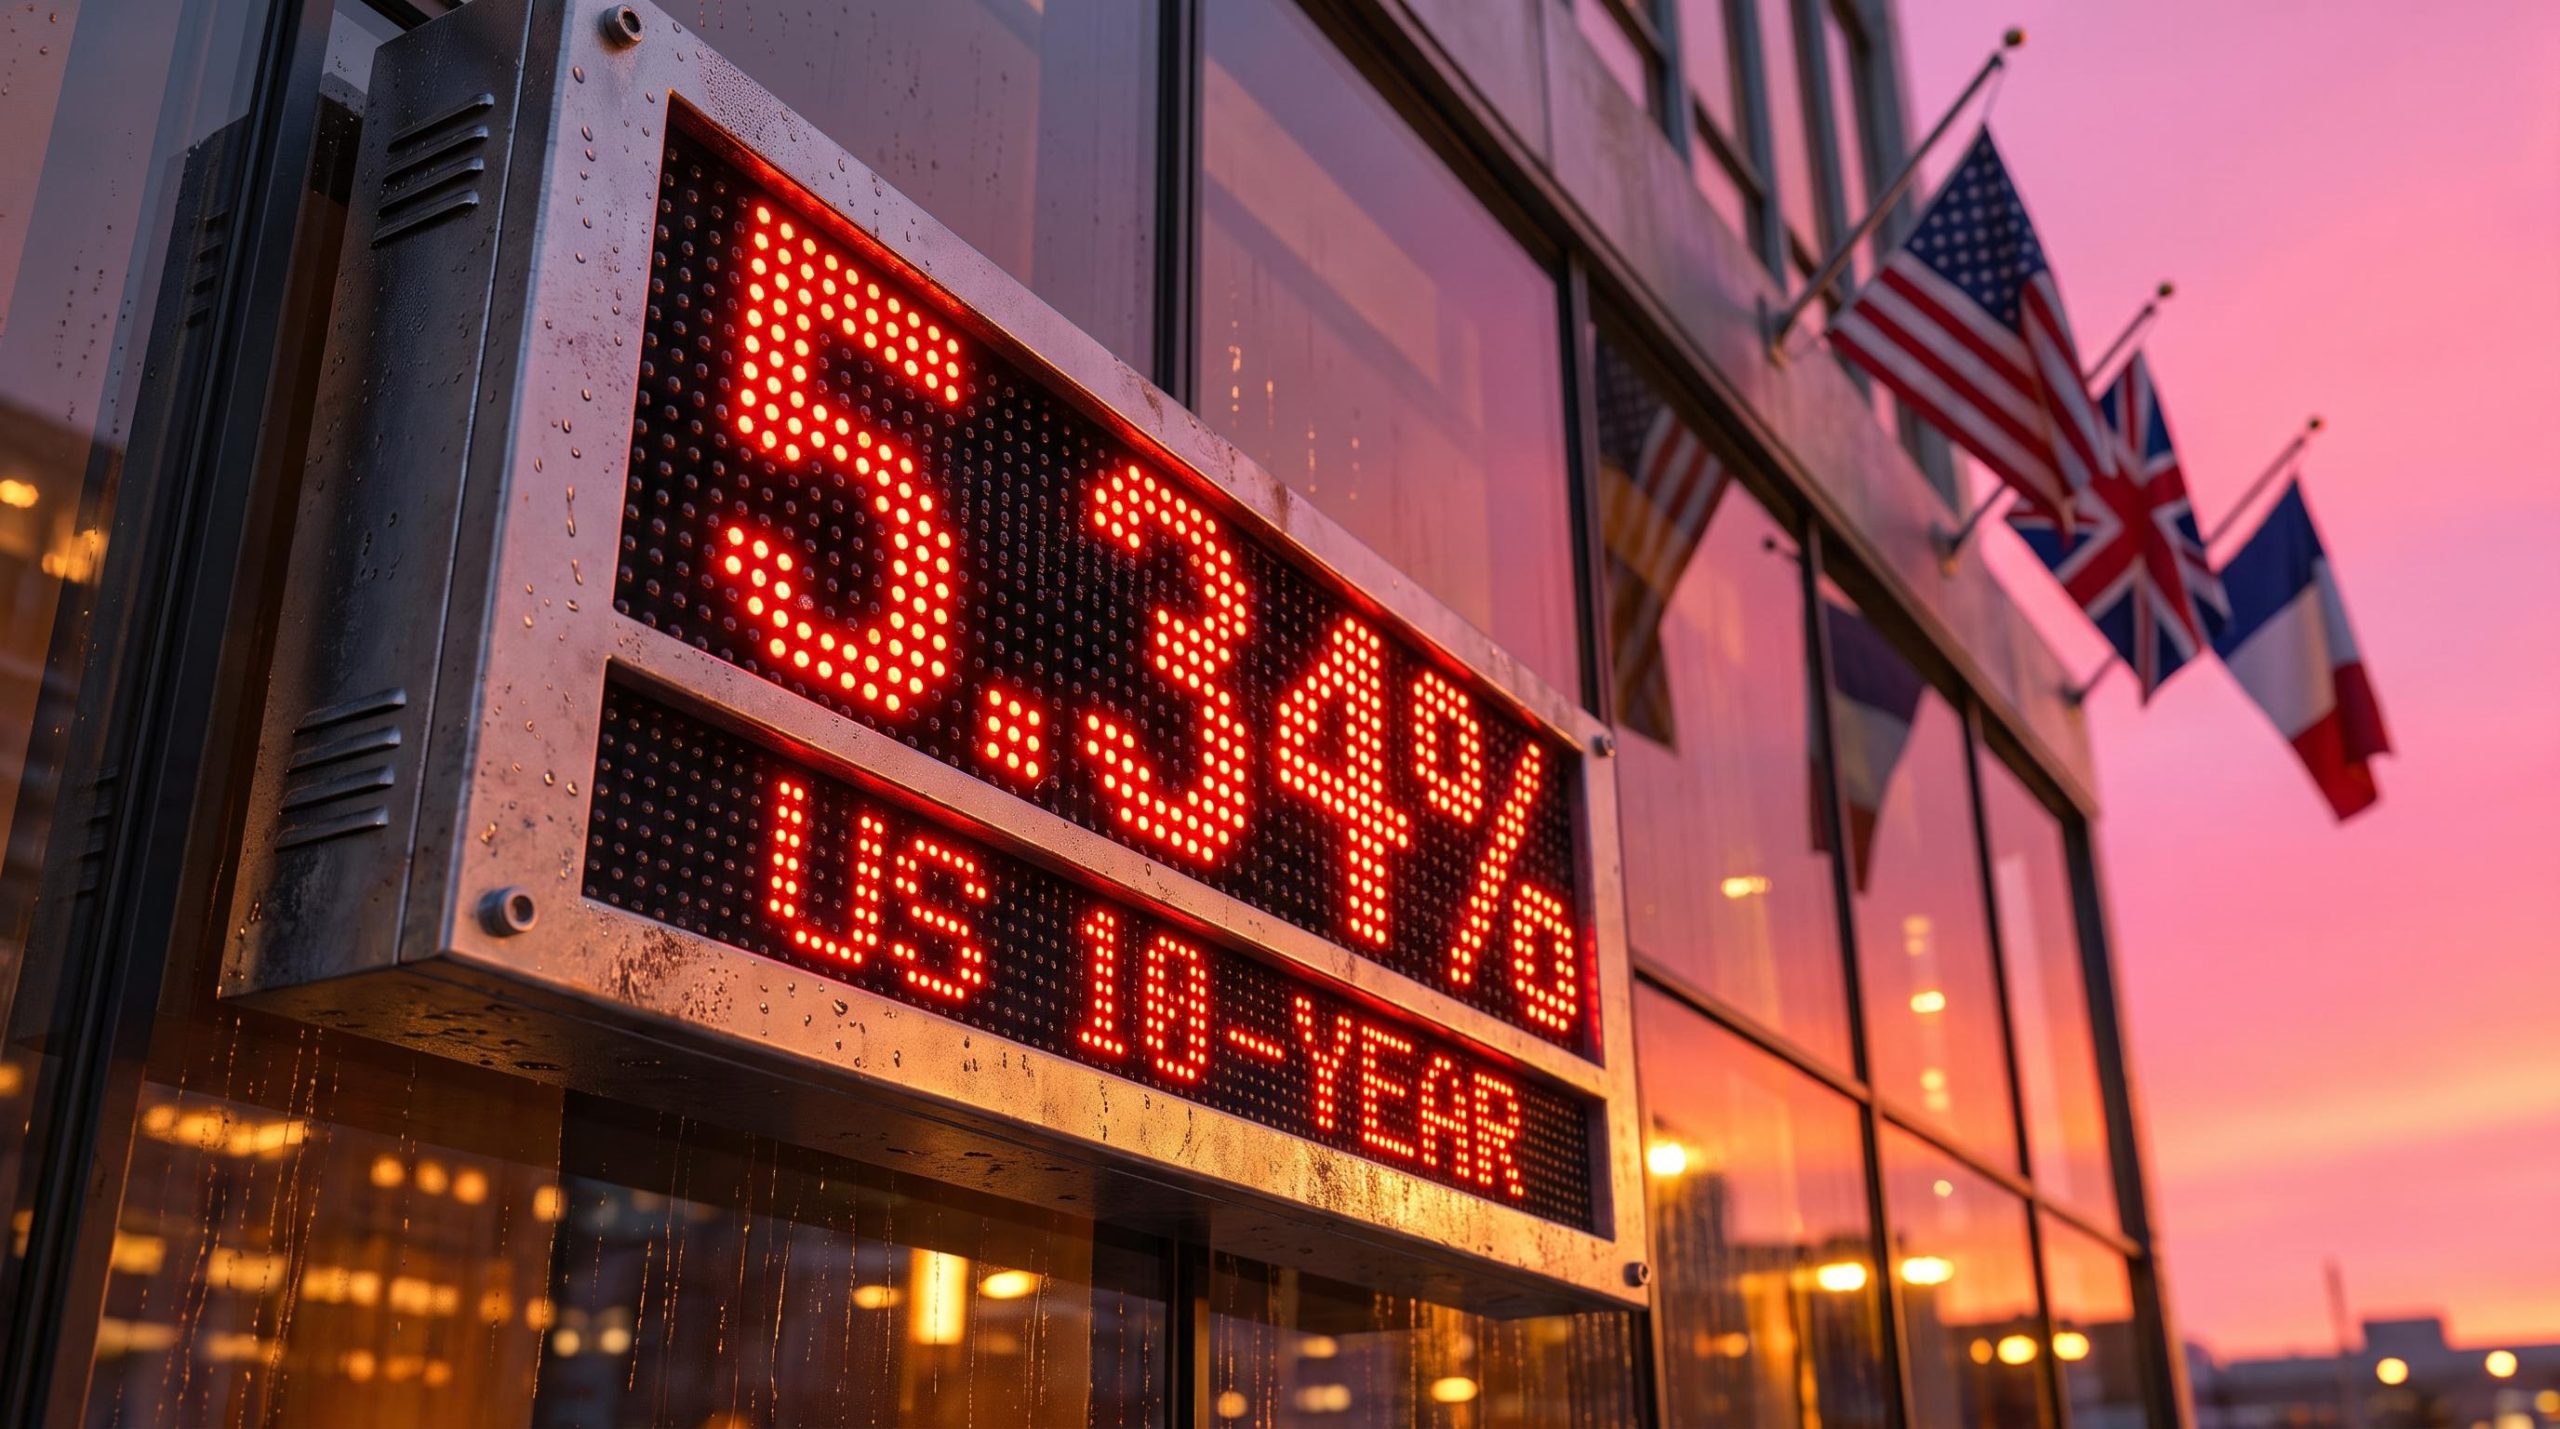
These are reports of deals in progress, not completed transactions, and syndicate and coupon terms were not available. Even so, competition from corporate borrowers helped push the 10-year Treasury yield back to about 5.31% in Asian trading. Vital Knowledge said lower yields will be difficult while AI debt momentum continues.
The AI bond market problem is partly one of scale: capex now runs well ahead of revenue growth, and hyperscalers converting liquid reserves into infrastructure shifts demand away from Treasuries, which helps explain yields near 5%.
If AI borrowers keep competing with governments for capital, you should expect higher funding costs to weigh on cash-burning companies, even when their revenue is growing strongly.
Structural or cyclical?
The risks are layered. Applied Digital depends heavily on large tenants, especially CoreWeave. Financing also links chipmakers, data centre hosts and tenants in a chain that relies on sustained AI demand.
Two views are competing:
- Structural camp: AI hosting and HBM demand represent a lasting step change, which supports long leases and privately financed campuses.
- Cyclical camp: memory booms have historically normalised quickly, leaving overcapacity and pressure on prices.
Neither side has been proven right. Results from either company could support both views for several more quarters.
What AI capital spending means for how you judge the next earnings beat
The growth across AI infrastructure is real. Cash flow, leverage and expectations determine how the market prices that growth, and this week’s results showed each of those factors at work.
Three things are worth watching next:
- Applied Digital’s free cash flow and lease execution: whether spending starts converting into contracted revenue.
- Samsung’s final results and memory pricing: whether the preliminary record holds and whether pricing points to a cycle peak.
- The direction of Treasury yields: whether corporate borrowing keeps funding costs elevated.
The next time an AI stock beats estimates, check how much capital the growth consumes and who is paying for it before deciding what the beat is worth.
This article is for informational purposes only and should not be considered financial advice. Investors should conduct their own research and consult with financial professionals before making investment decisions. Past performance does not guarantee future results. Financial projections are subject to market conditions and various risk factors.