The 10-year Treasury yield touched roughly 5.34-5.35% in early October, its highest level since 2002. Gold slid toward $4,100-$4,200, and silver dropped 2.77% in a single session. If you assume every commodity falls together when yields climb, the charts tell a messier story.
The 10-year just posted its biggest quarterly rise this century, and that move is pressing on each commodity chart in a different way. Precious metals are feeling it directly. Oil, natural gas and copper are absorbing it alongside conflict headlines, weather and Chinese demand.
That distinction matters if you hold metals, energy or copper exposure. Some of these markets are trading on the yield signal, and some are trading mostly on supply noise.
This piece shows you which markets are genuinely yield-sensitive, where the key chart levels sit, and which variables could change the picture. It is a technical, cross-asset read on how the 10-year yield is affecting commodities, not a trade recommendation.
What does a 24-year high in the 10-year yield actually look like?
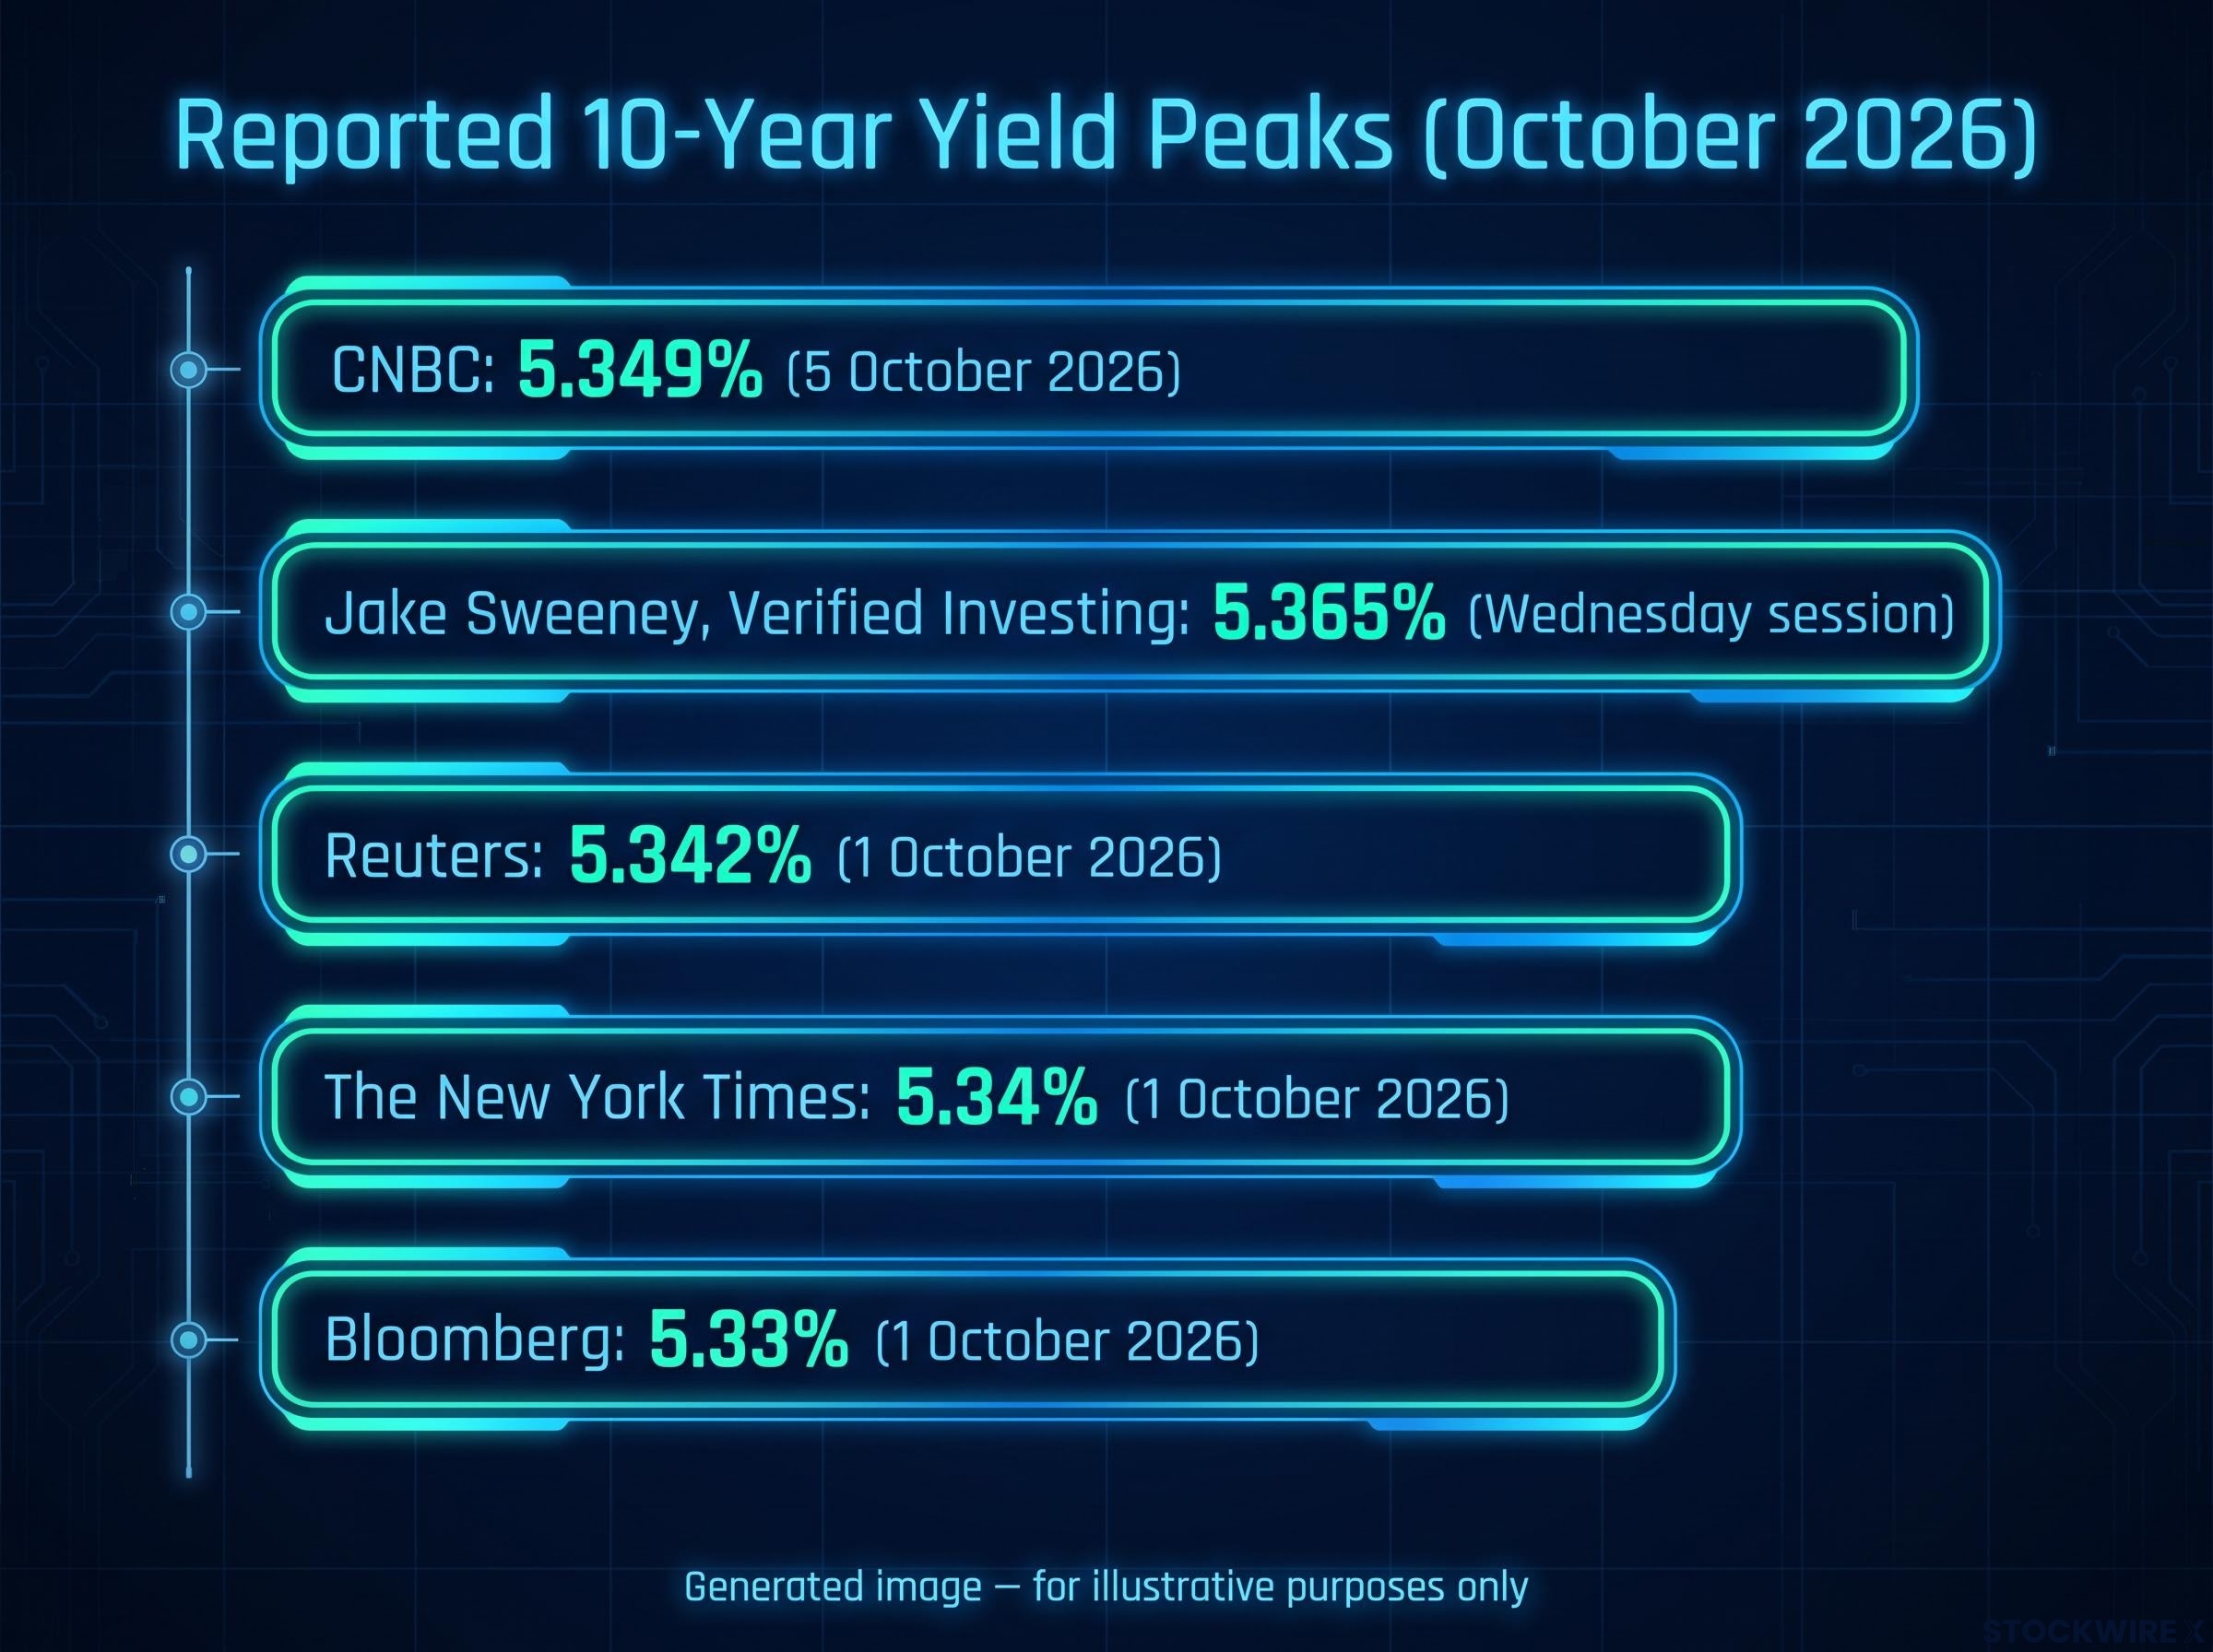
Start with the number, because the sources do not quite agree on it. CNBC recorded an intraday peak of 5.349% on 5 October, the highest since April 2002, before the yield settled near 5.307%. Reuters, Bloomberg and The New York Times placed the earlier 1 October high in a 5.33-5.34% cluster.
| Source | Date | Peak yield reported |
|---|---|---|
| CNBC | 5 October 2026 | 5.349% |
| Reuters | 1 October 2026 | 5.342% |
| The New York Times | 1 October 2026 | 5.34% |
| Bloomberg | 1 October 2026 | 5.33% |
| Jake Sweeney, Verified Investing | Wednesday session | 5.365% (intraday) |
The precise peak matters less than the scale of the move.
Record pace: The 10-year posted its biggest quarterly rise this century, according to Yahoo Finance, while the 30-year yield sat around 5.67-5.69%.
No single headline explains it. The research points to a stack of causes:
- Sticky inflation keeping rate expectations elevated
- Stronger-than-expected Q2 GDP growth
- Resurgent oil prices reviving inflation concerns
- Fiscal supply worries, with global buyers demanding more compensation for long-dated debt
- Labour data and pending Fed minutes keeping the “higher for longer” risk alive
The research identifies no specific fiscal bill or Federal Open Market Committee (FOMC) decision behind the surge. Instead, demand stayed strong at the top. The $39 billion 10-year auction on 7 October cleared at 5.300%, with a bid-to-cover ratio of 2.77, a tail of -1.7 basis points and indirect bidders taking 80.3%. A bid-to-cover ratio measures how many dollars of bids arrived for each dollar of notes sold.
The auction result shows how bond yields are set in practice: competitive bids determine the clearing level, and the secondary market then reprices it continuously as inflation data and policy expectations shift.
Strong auction demand at a record-scale yield move tells you the market is repricing for “higher for longer”, not panicking. Every asset in your portfolio is now being measured against a higher hurdle rate. Sweeney flags 5.426%, a level that also mattered in early 2002, as the next marker that would signal intensifying pressure.
When big ASX news breaks, our subscribers know first
Why do rising yields hit some commodities harder than others?
Most investors know the short version: when bonds pay more, assets that pay nothing look less appealing. That logic is correct, but it only explains part of the move.
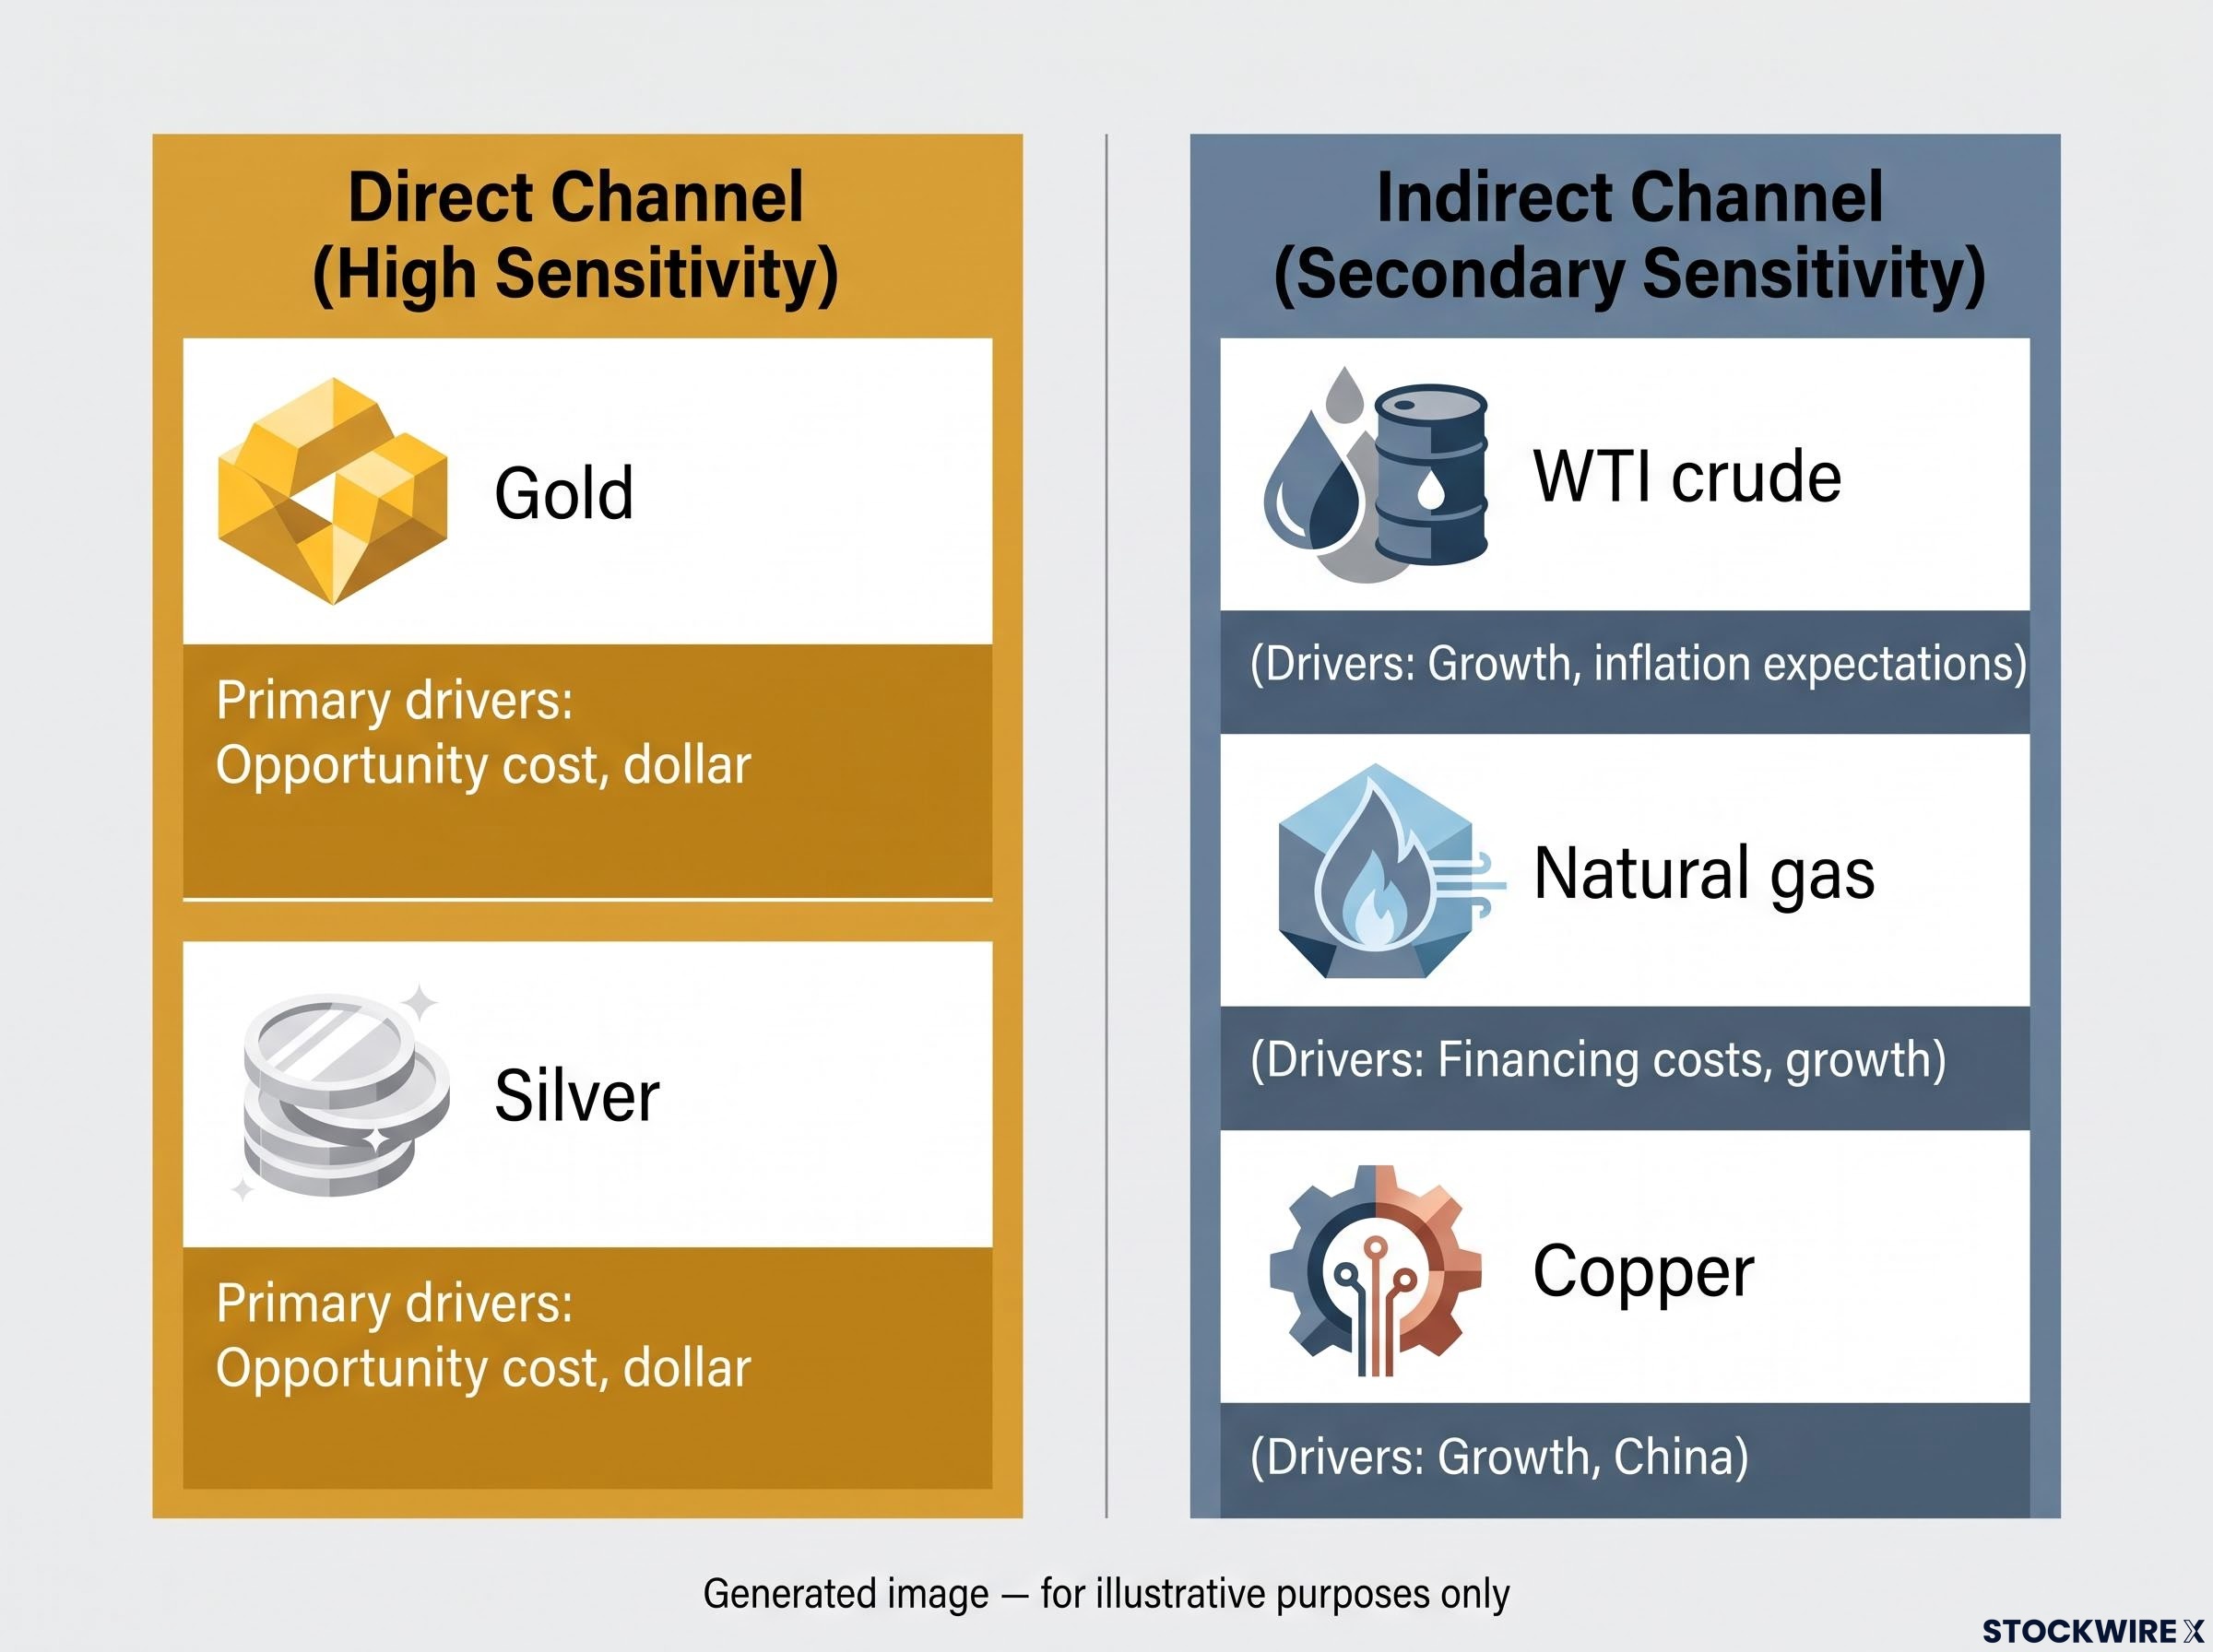
Direct channel: gold and silver
Gold and silver generate no cash flow. When real yields rise, safe fixed income becomes a more attractive alternative. A real yield is the bond yield after subtracting expected inflation, so it measures the return you keep in purchasing-power terms.
A stronger dollar compounds the pressure because it makes dollar-priced metals dearer for overseas buyers. The World Gold Council and bank research describe this combination as a “double headwind.” When yields rise on growth, capital also rotates toward equities and credit and away from defensive stores of value.
Sweeney adds a fourth layer. In his view, crowded long positioning and commodity trading advisor (CTA) trend models amplified the selloff. These systematic funds follow price momentum, so the same machinery could amplify a rebound if yields stall.
Indirect channel: oil, natural gas and copper
For energy and copper, yields work through growth and financing. Higher borrowing costs can slow investment in shale, liquefied natural gas (LNG) and mining. That is bearish in the short term if demand weakens first, but bullish over the longer term because it means less future supply.
Copper and LNG-linked gas also depend heavily on China and emerging-market growth, which tighter global financial conditions can squeeze.
Nominal yields also differ from real yields. Part of today’s rise may reflect term premium, which is the extra return investors demand for holding long-dated debt. A spike driven by deficit worries carries different implications from one driven by tightening real rates.
| Commodity | Primary channel | Yield sensitivity | Dominant other driver | Key risk |
|---|---|---|---|---|
| Gold | Opportunity cost, dollar | High | Fiscal and geopolitical hedging | Further real-yield rise |
| Silver | Opportunity cost, dollar | High | Industrial demand | Break of trend support |
| WTI crude | Growth, inflation expectations | Secondary | Conflict and OPEC+ supply | Demand slowdown |
| Natural gas | Financing costs, growth | Secondary | Weather and LNG demand | Overhead resistance |
| Copper | Growth, China | Secondary | Construction and manufacturing | Tighter EM conditions |
The same yield spike can be a direct headwind for one of your holdings and a background factor for another. Do not read one chart as a proxy for all five.
Where are gold and silver testing support?
Both precious metals now sit at the point where their charts either hold or give way.
Gold: trend line, pivot and bear flag
Gold trades around $4,140-$4,160. During Sweeney’s session, it fell about 2.12% (roughly $88) intraday before bouncing off a long-term trend line drawn from the 21 April 2025 high.
The bounce bought time, but the chart still carries a daily bear flag. A bear flag is a brief sideways or upward drift after a sharp drop, and it often precedes another leg lower. If the trend line fails, Sweeney sees possible support near 4,023, with 3,895 down to 3,700 as the zones he would wait for.
Sweeney also references a swing-low pivot near 4,99x. That level sits well above the current price, so treat it as a reference point on his chart, not a nearby target.
Silver: cleaner support, heavier overhead
Silver looks weaker. It fell 2.77% on the day and recovered less than gold, settling around $60.20-$60.40. It sits on a trend line from the 20 November 2025 low that Sweeney considers cleaner than gold’s and that has not been tested since early August.
The problem is overhead resistance. Above a pivot near $61.02, a downtrend line from the 2 March 2026 high converges with the pivot top, creating resistance around $64.36-$65.28.
| Level type | Gold | Silver |
|---|---|---|
| Support | Trend line from 21 April 2025 high; 4,023 | Trend line from 20 November 2025 low |
| Pivot | Near 4,99x (reference only) | $61.02 |
| Resistance | Not specified | $64.36-$65.28 |
| Buy zones (analyst view) | 3,895-3,700 | About $54.46 |
These buy zones are levels an analyst is waiting for, not recommendations. If support breaks, the charts point to defined lower zones. If it holds, you could see a rebound should yields stall.
For readers wanting to map their own levels, our dedicated guide to reading gold’s support and resistance levels explains how Fibonacci clusters and moving average zones confirm breakouts.
What are oil, natural gas and copper saying that the yield chart is not?
The surprise is that these three charts are not following the metals lower in lockstep. Each one is responding to a different set of drivers.
Oil: range-bound under conflict headlines
WTI trades near $89.80-$90.00 after a 1% daily dip amid escalating conflict. It has made no new highs since Friday 18 September, and a doji candle, where the open and close are almost identical, signals a standoff between buyers and sellers.
Support sits on a rising trend line near 87-88, with the 38.2% Fibonacci retracement at 87.07. Resistance stands at 93.64. Sweeney expects choppy range trading before any sharper move.
Natural gas: higher lows, heavy resistance
Henry Hub gas sits around $3.27/MMBtu, and the United States Natural Gas Fund (UNG) has printed higher lows since early August. It gave back a strong late-September rally without breaking that pattern.
The ceiling is crowded. Resistance sits at 11.29-11.32, followed by a polarity pivot at 11.48 and longer-term resistance near 11.80. A polarity pivot is a level that has acted as both support and resistance.
Copper: bearish tilt after a topping tail
Copper trades near $6.73/lb, but the United States Copper Index Fund (CPER) turned bearish after a weekly topping tail in mid-September. A topping tail is a long upper wick showing that sellers rejected higher prices. The fund failed to reclaim 40.21, with trend-line resistance at 41.40-41.50 and support at 39.20-39.40.
UNG and CPER levels are fund prices, not the spot prices quoted above.
| Market | Support | Resistance | Chart signal |
|---|---|---|---|
| WTI crude | 87-88; 87.07 | 93.64 | Doji, range-bound |
| Natural gas (UNG) | Rising trend line of higher lows | 11.29-11.32; 11.48; 11.80 | Higher lows |
| Copper (CPER) | 39.20-39.40 | 40.21; 41.40-41.50 | Weekly topping tail |
In the near term, supply and geopolitics can override the yield signal. Expect divergence across your commodity exposure, and judge each market on its own levels rather than on the yield headline.
Could yields reverse, and what do past spikes suggest?
The bear case for metals is clear. But a quarterly rise this large also raises the odds of a reversal if growth or inflation data soften or the Fed shifts. If yields retreat, the dollar eases or credit stress appears, gold and silver could stage a catch-up rally.
History complicates the picture further.
| Episode | Yield driver | Gold reaction | Oil and copper reaction |
|---|---|---|---|
| 2002 | Policy normalising after dot-com easing | Did not collapse; early secular bull market | Not specified in research |
| 2013 taper tantrum | Fed taper signal | Gold and silver fell sharply | Mixed |
| 2022-2023 | Real yields from deeply negative to positive | Struggled, then stabilised | Oil on OPEC+ and war; copper on China reopening |
Several counter-arguments deserve weight:
- Gold can rally despite higher yields when the rise reflects inflation, fiscal stress or geopolitical risk.
- A spike driven by term premium may be less bearish for gold than it looks.
- Structural forces, such as high US debt and under-investment in mining and energy, support commodities over a multi-year horizon, even as tighter conditions weigh cyclically.
The outcome depends on whether yields keep climbing on growth or fade on weaker data. The variables worth monitoring are real yields and the dollar, not nominal yields alone.
Prior episodes of gold strength alongside rising yields and a weaker dollar were followed by dollar stabilisation and gold consolidation, which suggests yield direction matters more than yield level for the metal’s next move.
Past performance does not guarantee future results. These statements are speculative and subject to change based on market developments.
What the yield surge changes for commodities, and what it leaves open
Yields are now the main headwind for gold and silver and a secondary factor for oil, natural gas and copper. That split should shape how you read each chart.
Three variables carry the most information from here:
- Whether the 10-year breaks through 5.426%
- The direction of real yields and the dollar
- Whether gold and silver hold their trend-line supports
A break higher in yields alongside failed metal supports would point toward the lower zones. A stall in yields would leave room for the rebound that crowded positioning could amplify. Treat every level here as a reference point for your own judgement, not a trade signal.
This article is for informational purposes only and should not be considered financial advice. Investors should conduct their own research and consult with financial professionals before making investment decisions.