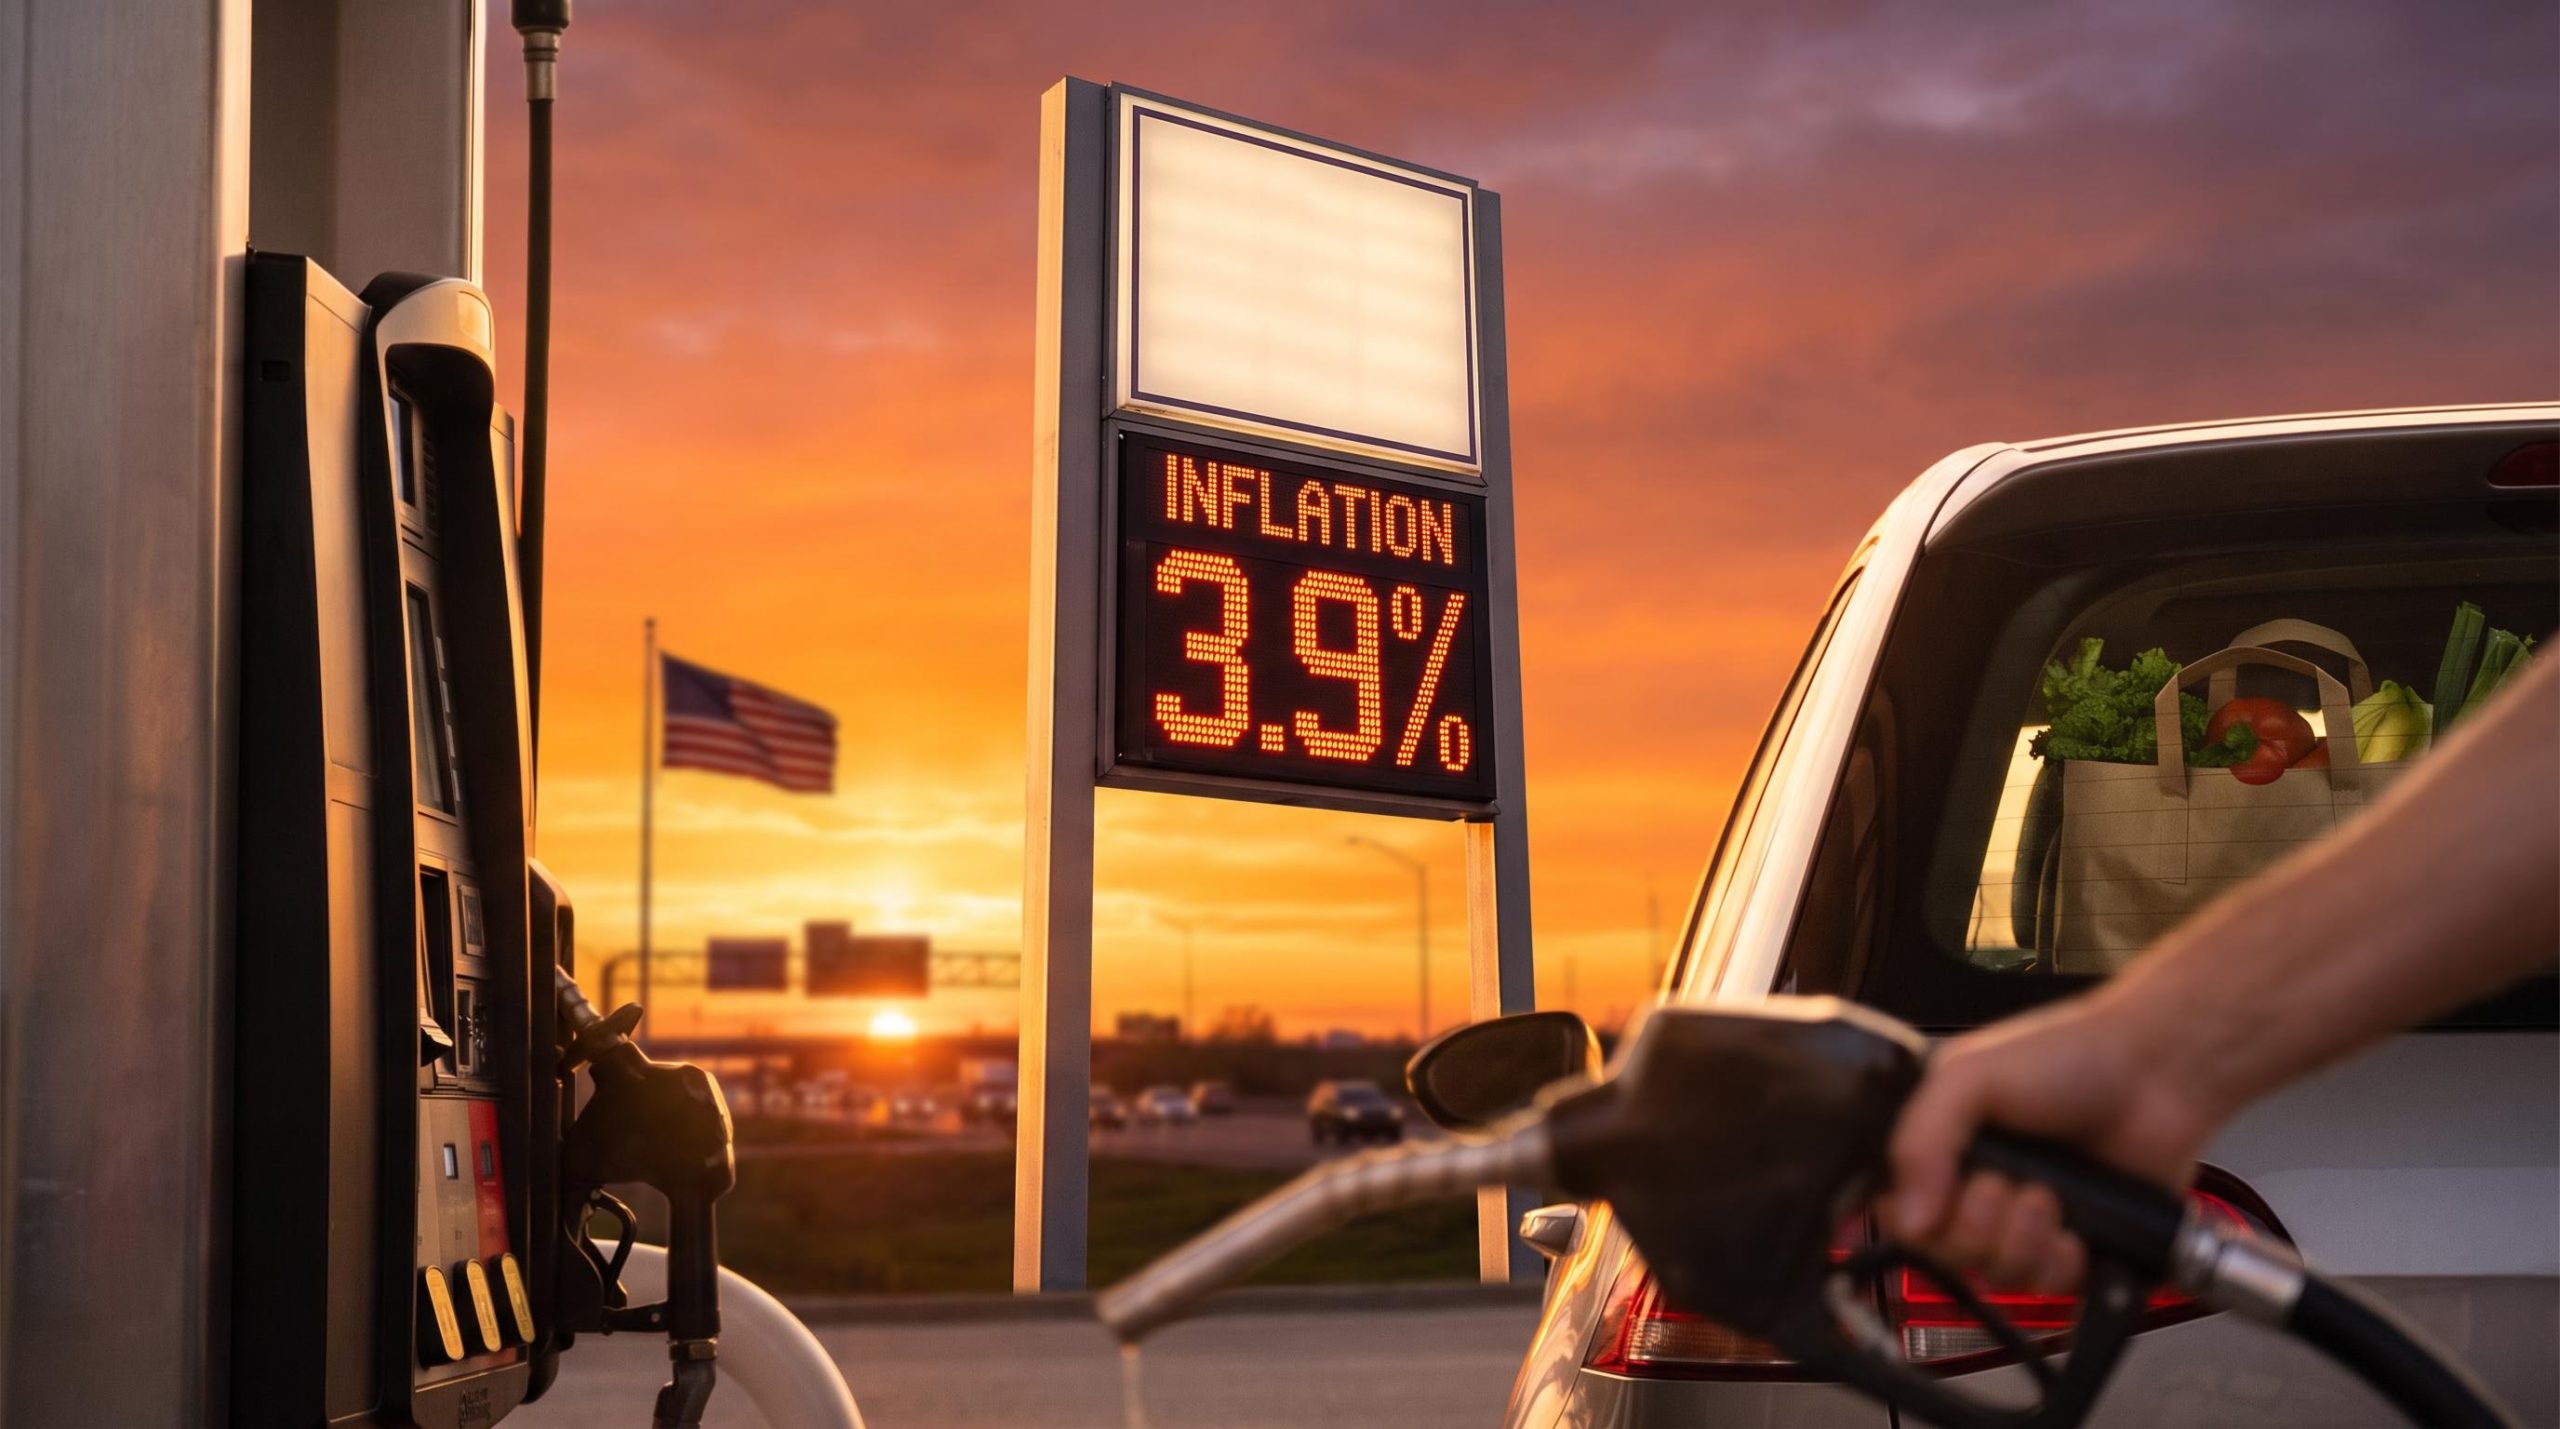
The New York Fed’s latest read on household inflation expectations has climbed to 3.9% for the year ahead, the highest since May 2023. At the same time, households say their finances are getting worse. They expect to pay more and to spend more, even as they feel poorer. A 0.3 percentage point move in a survey can look like noise or like an alarm bell. It is neither, and the horizon pattern explains why.
The reading lands at an awkward moment. The Federal Reserve held its federal funds target range at 3½-3¾% in July. Personal consumption expenditures (PCE) inflation, the Fed’s preferred price gauge, ran at 4.1% in the 12 months to May.
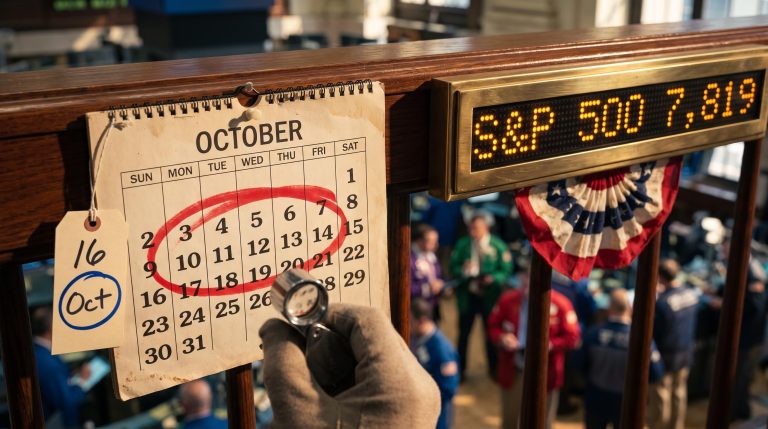
The September Federal Open Market Committee (FOMC) Minutes are due on Wednesday. The FOMC is the Fed body that sets interest rates.
Here is what the survey does and does not signal, and how it bears on rates, the dollar, gold and the holdings in your own portfolio.
What do the September numbers actually say, and how far can you trust them?
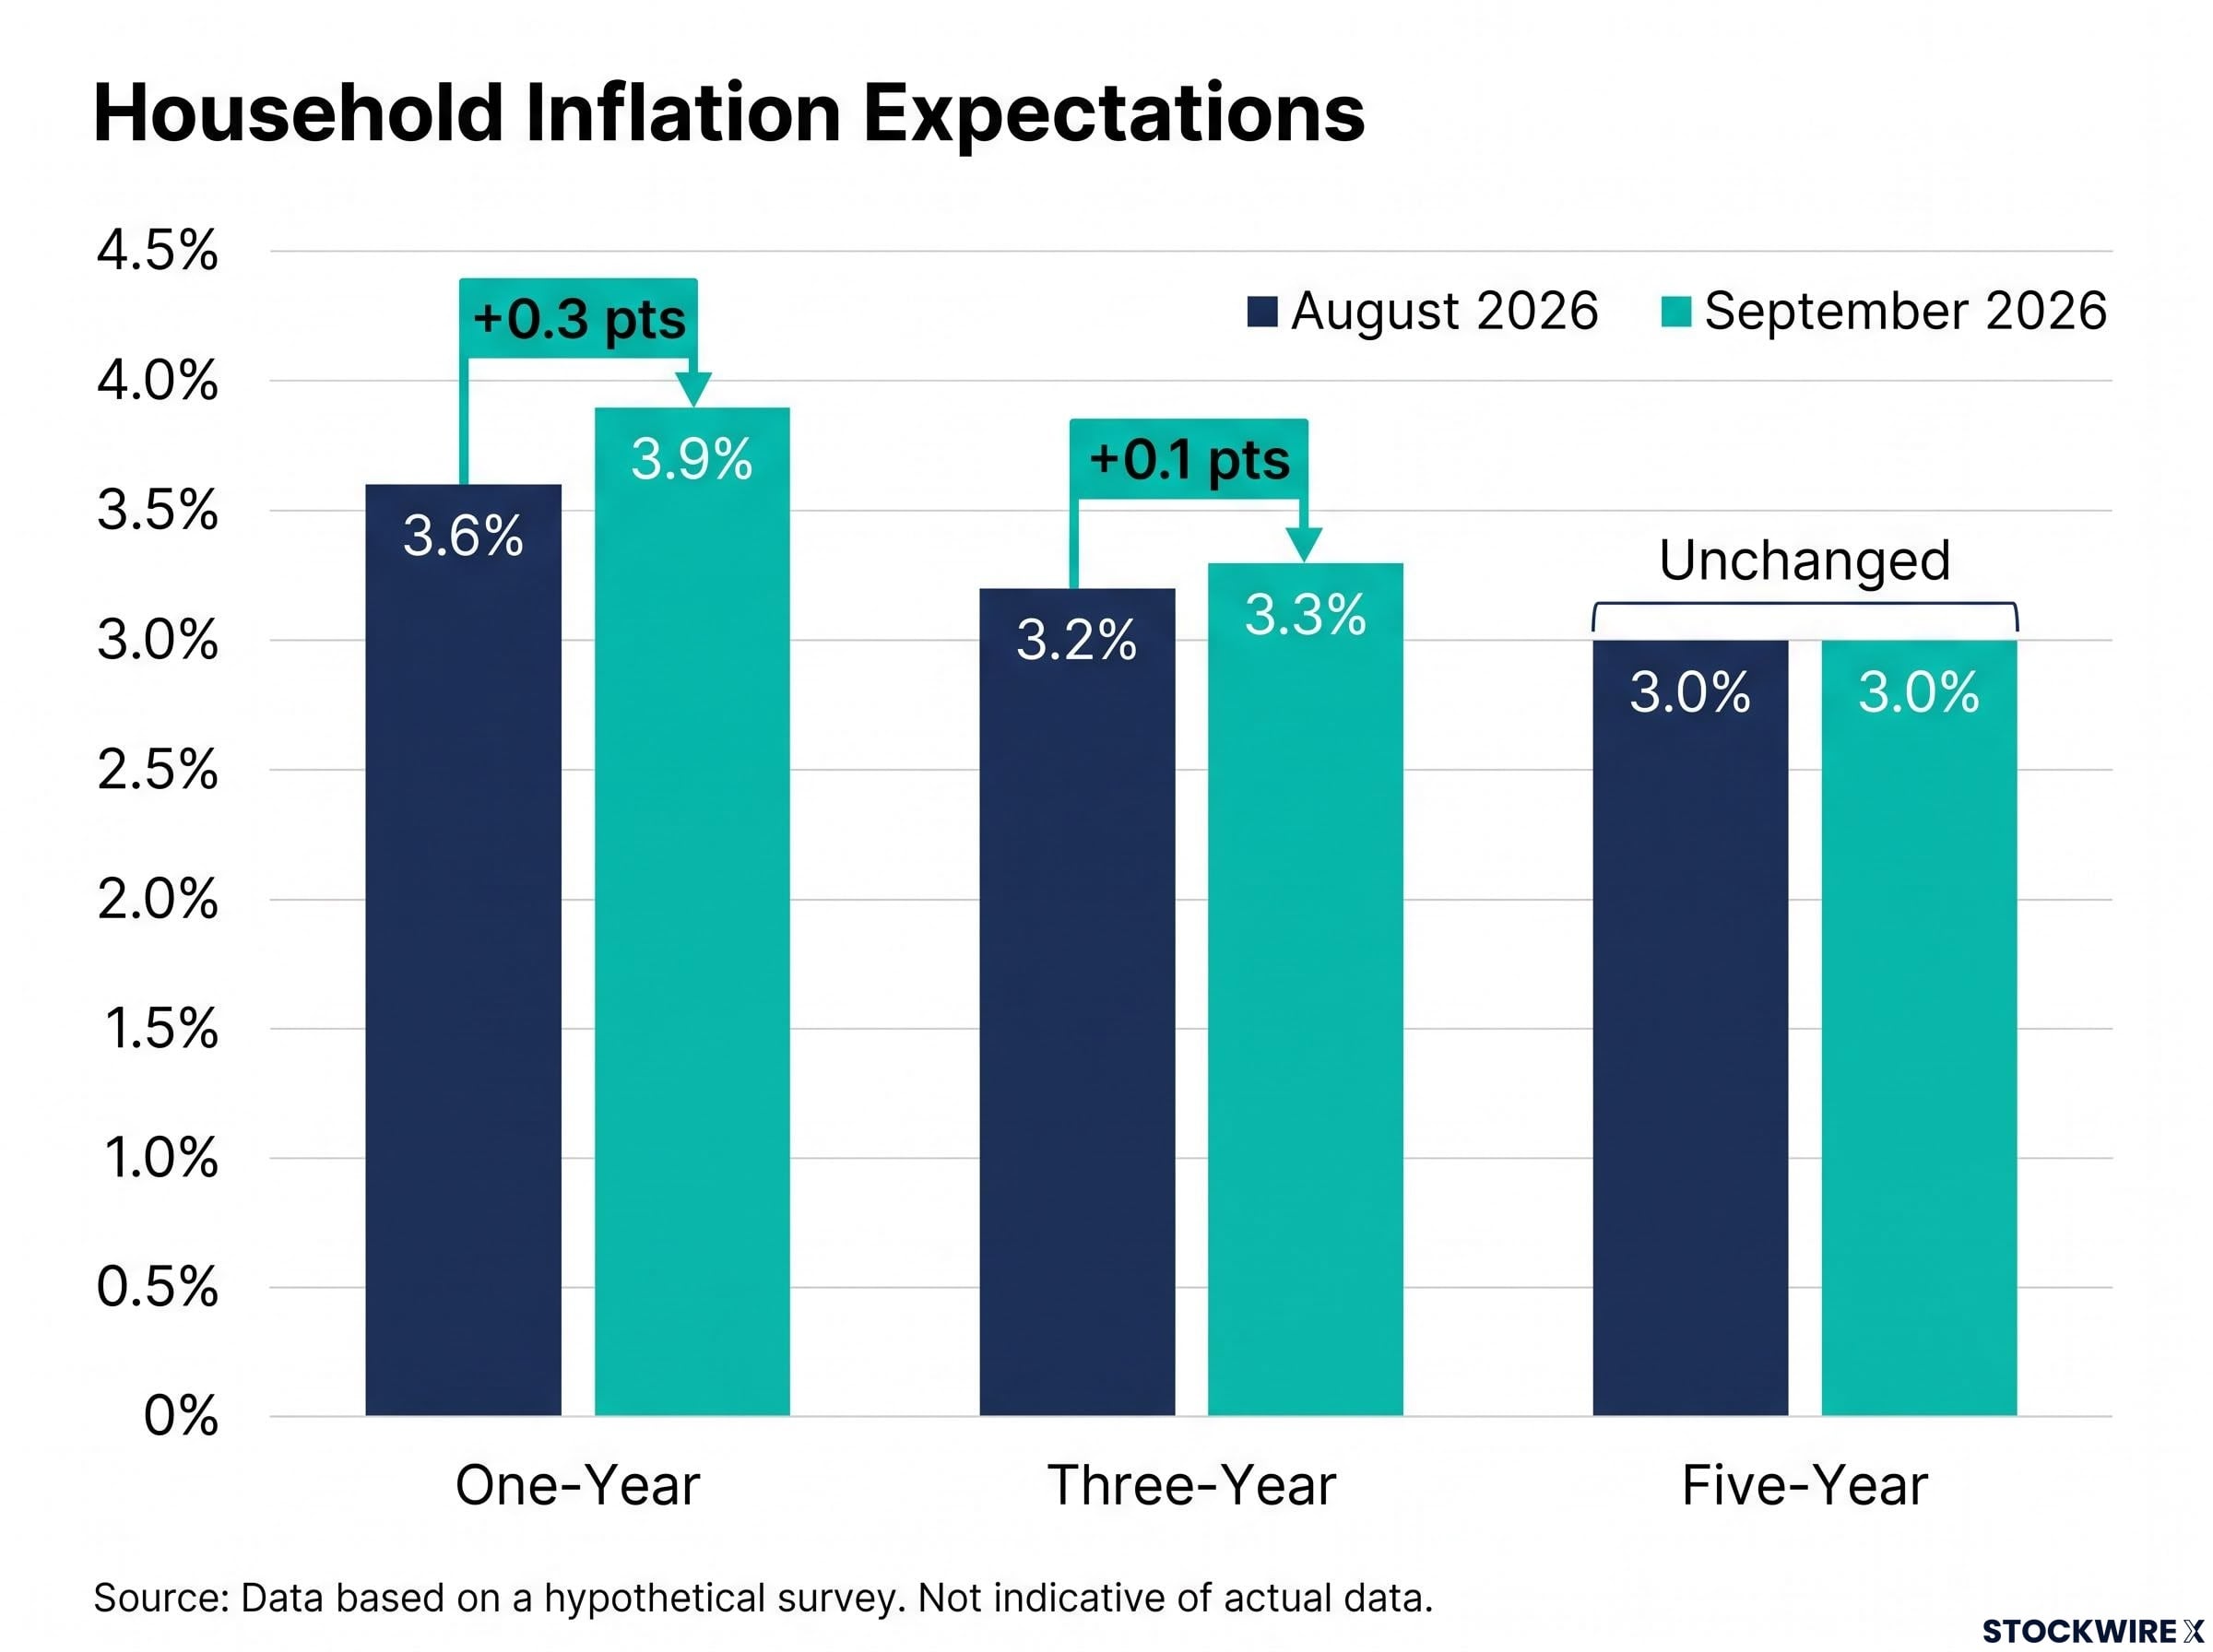
The NY Fed Survey of Consumer Expectations was fielded from 1-30 September 2026 and released on 7 October 2026. The near-term readings rose. The long-term reading did not move.
| Horizon | August 2026 | September 2026 | Change |
|---|---|---|---|
| One-year | 3.6% | 3.9% | +0.3 pts |
| Three-year | 3.2% | 3.3% | +0.1 pts |
| Five-year | 3.0% | 3.0% | Unchanged |
The household details make the picture harder to read. More respondents said their finances were worse than a year earlier, and more expected them to worsen further. They also marked down their ability to access credit. Even so, expected spending rose to its highest level since May 2023, and labour market expectations improved overall.
Why short-term expectations are rising
Gasoline is the clearest driver in the survey coverage. The NY Fed reported higher expected price rises for gas, food, medical care, college education and rent. Category percentages for September were not available.
Worries about real income add to the pressure. Real income is pay adjusted for inflation. Households that expect their pay to fall behind prices tend to forecast higher inflation, because they feel the squeeze every week. The research found no explicit link between this rise and tariffs or wages, so neither should be assumed to be the cause.
Why the caveats matter
The survey has four known weaknesses:
- Recent moves in gasoline and grocery prices strongly influence the answers.
- Many respondents know little about the consumer price index (CPI) or PCE and extrapolate from their own shopping.
- How a question is framed shapes the answers, so shifts of a few tenths may be noise.
- Higher-income and more financially literate respondents report lower, steadier expectations, which complicates the average.
Read the 3.9% as a measure of how households feel about prices they see every week, not as a CPI forecast. Weigh it alongside the University of Michigan survey and Treasury inflation-protected securities (TIPS) breakevens. A breakeven is the inflation rate the bond market is implicitly pricing in. The figure carrying real information is the steady five-year reading, not the jump in the one-year number.
The University of Michigan survey showed a similar pattern in September, with one-year expectations at 4.6% and five-year expectations edging up to 3.4%, a useful cross-check on the New York Fed reading.
When big ASX news breaks, our subscribers know first
Why does the Fed care what households expect?
It is tempting to dismiss these numbers as opinion. The trouble is that opinions about prices tend to turn into prices.
When workers expect 4% inflation, they ask for raises to match. When businesses expect their costs to rise, they lift their own prices pre-emptively. Enough of that behaviour can make expectations self-fulfilling. That is why the Fed wants expectations “anchored”: settled near its 2% target and slow to move when a single month of data comes in hot.
The FOMC voting structure matters here, because only twelve members cast votes and the minutes reveal how firmly the broader Committee views the risk of expectations drifting away from the 2% target.
The backdrop gives policymakers little room to relax. The minutes of the 29 July meeting, released on 19 August, showed nine members agreeing to hold the range at 3½-3¾%. PCE inflation through May ran at 4.1% headline and 3.4% core, which excludes food and energy. The 16 September statement kept the language firm:
FOMC statement, 16 September 2026 “Inflation remains elevated,” with the Committee saying its action would support a “timelier return” to its 2 percent goal.
The research could not confirm the September target range or the vote breakdown, so whether rates changed that day remains unverified. A Reuters report on 30 September said August inflation rose less than expected. The exact figures were not available.
The two readings of the survey look like this:
- De-anchoring risk: rising one- and three-year expectations combined with PCE above 4% mean that cutting rates quickly could lock in expectations of 3-4% inflation.
- Anchored case: five-year expectations holding at 3.0% suggest partial anchoring, and many economists see the de-anchoring risk as contained if market and professional measures stay near target.
The easing debate is now constrained by the Fed’s credibility. Treat any hopes for rate cuts as conditional on expectations holding, and listen for how the Minutes describe that risk.
How could rates, the dollar, gold and equities react?
Markets had already started to lean one way ahead of the Minutes. Higher US yields supported the dollar. USD/JPY traded near 158.50 and AUD/USD sat below 0.7000. Precise 10-year Treasury yield and US Dollar Index (DXY) levels were not available in the research.
The trouble is that the same data can push each asset in opposite directions.
Rates and the dollar
Higher expected inflation lifts nominal bond yields and hurts long-duration bonds most. Duration measures how sensitive a bond’s price is to changes in interest rates. The 2021-2023 experience showed the dollar strengthening when real rates rose under a restrictive Fed. A real rate is the interest rate after subtracting inflation. The same experience showed the dollar can weaken once markets suspect the Fed is behind the curve, meaning it is responding too slowly to inflation.
Gold, equities and crypto
Gold fell, then recovered above $4,100 an ounce even as yields and the dollar rose. That resilience hints at doubts about the Fed’s credibility. Sharply higher real yields could still cap the metal.
The relationship between gold and real yields explains the metal’s mixed response, since oil-driven inflation can prompt a Fed reaction that lifts yields and the dollar at the same time.
Higher discount rates weigh on equity valuations, because future profits are worth less in today’s money. Energy and consumer staples have historically held up better than long-duration growth stocks, whose value depends heavily on profits far in the future. Risk appetite looked thin elsewhere. About $550M in crypto positions were liquidated and Bitcoin was rejected near $87,200. Eurozone inflation reached 3.8%, a three-year high, which shows the pressure is not only a US story.
| Asset | If Fed stays firm | If Fed seen behind curve | Key swing factor |
|---|---|---|---|
| Long-duration Treasuries | Yields rise, prices fall | Yields rise on inflation premium | Long-run expectations |
| US dollar | Supported by real rates | Can weaken | Fed credibility |
| Gold | Pressured by real yields | Tends to gain | Real yields |
| Equities | Valuations compress | Pricing-power sectors favoured | Discount rates, margins |
Your outcome depends on which story investors adopt: a hawkish Fed, or one falling behind. The Minutes are where that verdict may form.
What should a US investor do with this signal?
The proportionate response is a review, not an overhaul. Five considerations stand out, each with a trade-off:
- TIPS: principal adjusts with CPI, though holders benefit only if inflation surprises above what is already priced in.
- Shorter duration: maturities of 2-5 years, floating-rate notes or bond ladders reduce rate risk, but you give up gains if yields fall.
- Gold and real assets: these hedge policy uncertainty, but gold is sensitive to real yields.
- Equity tilts: energy, materials, staples and infrastructure offer pricing power, at the cost of missing rallies in growth stocks.
- Cash: it preserves optionality, but loses purchasing power if inflation runs above cash yields.
Expectations may revert if upcoming inflation data improves. For you, this survey is a prompt to check how much duration and inflation exposure you hold, not a reason to rebuild your portfolio.
The concentration trap Moving everything into a single hedge, such as all gold or all TIPS, exposes you to a sudden shift in policy or growth.
This is general information, not personal advice. Past performance does not guarantee future results, and any scenarios described are subject to change as markets develop.
Investors exploring broader protection should read our dedicated guide to building an inflation hedge portfolio, which shows how to layer dividend equities and real assets without concentration risk.
What the 3.9% reading changes, and what it does not
The September survey raises the bar for rate cuts without proving that expectations are de-anchoring. The five-year reading at 3.0% is the evidence that households still expect inflation to moderate over time. That makes it the number to defend.
Three markers will tell you which way this resolves:
- The September FOMC Minutes, and how firmly they describe inflation risk
- The next survey’s three- and five-year readings
- Upcoming CPI and PCE prints
If the long-horizon figures hold, this reading is likely to fade as a gasoline-driven blip. If they drift higher, the case for shorter duration and diversified inflation hedges strengthens.
This article is for informational purposes only and should not be considered financial advice. Investors should conduct their own research and consult with financial professionals before making investment decisions.