
The Federal Reserve cut interest rates in September 2024, and by January 2025 mortgage rates had climbed back above 7%. If you assumed the Fed sets the rate on your home loan, that sequence should give you pause. Freddie Mac’s 30-year fixed average now sits at 7.28% as of 1 October 2026, which shows why mortgage rates are so high: the cause sits somewhere other than the Fed’s headline decisions.
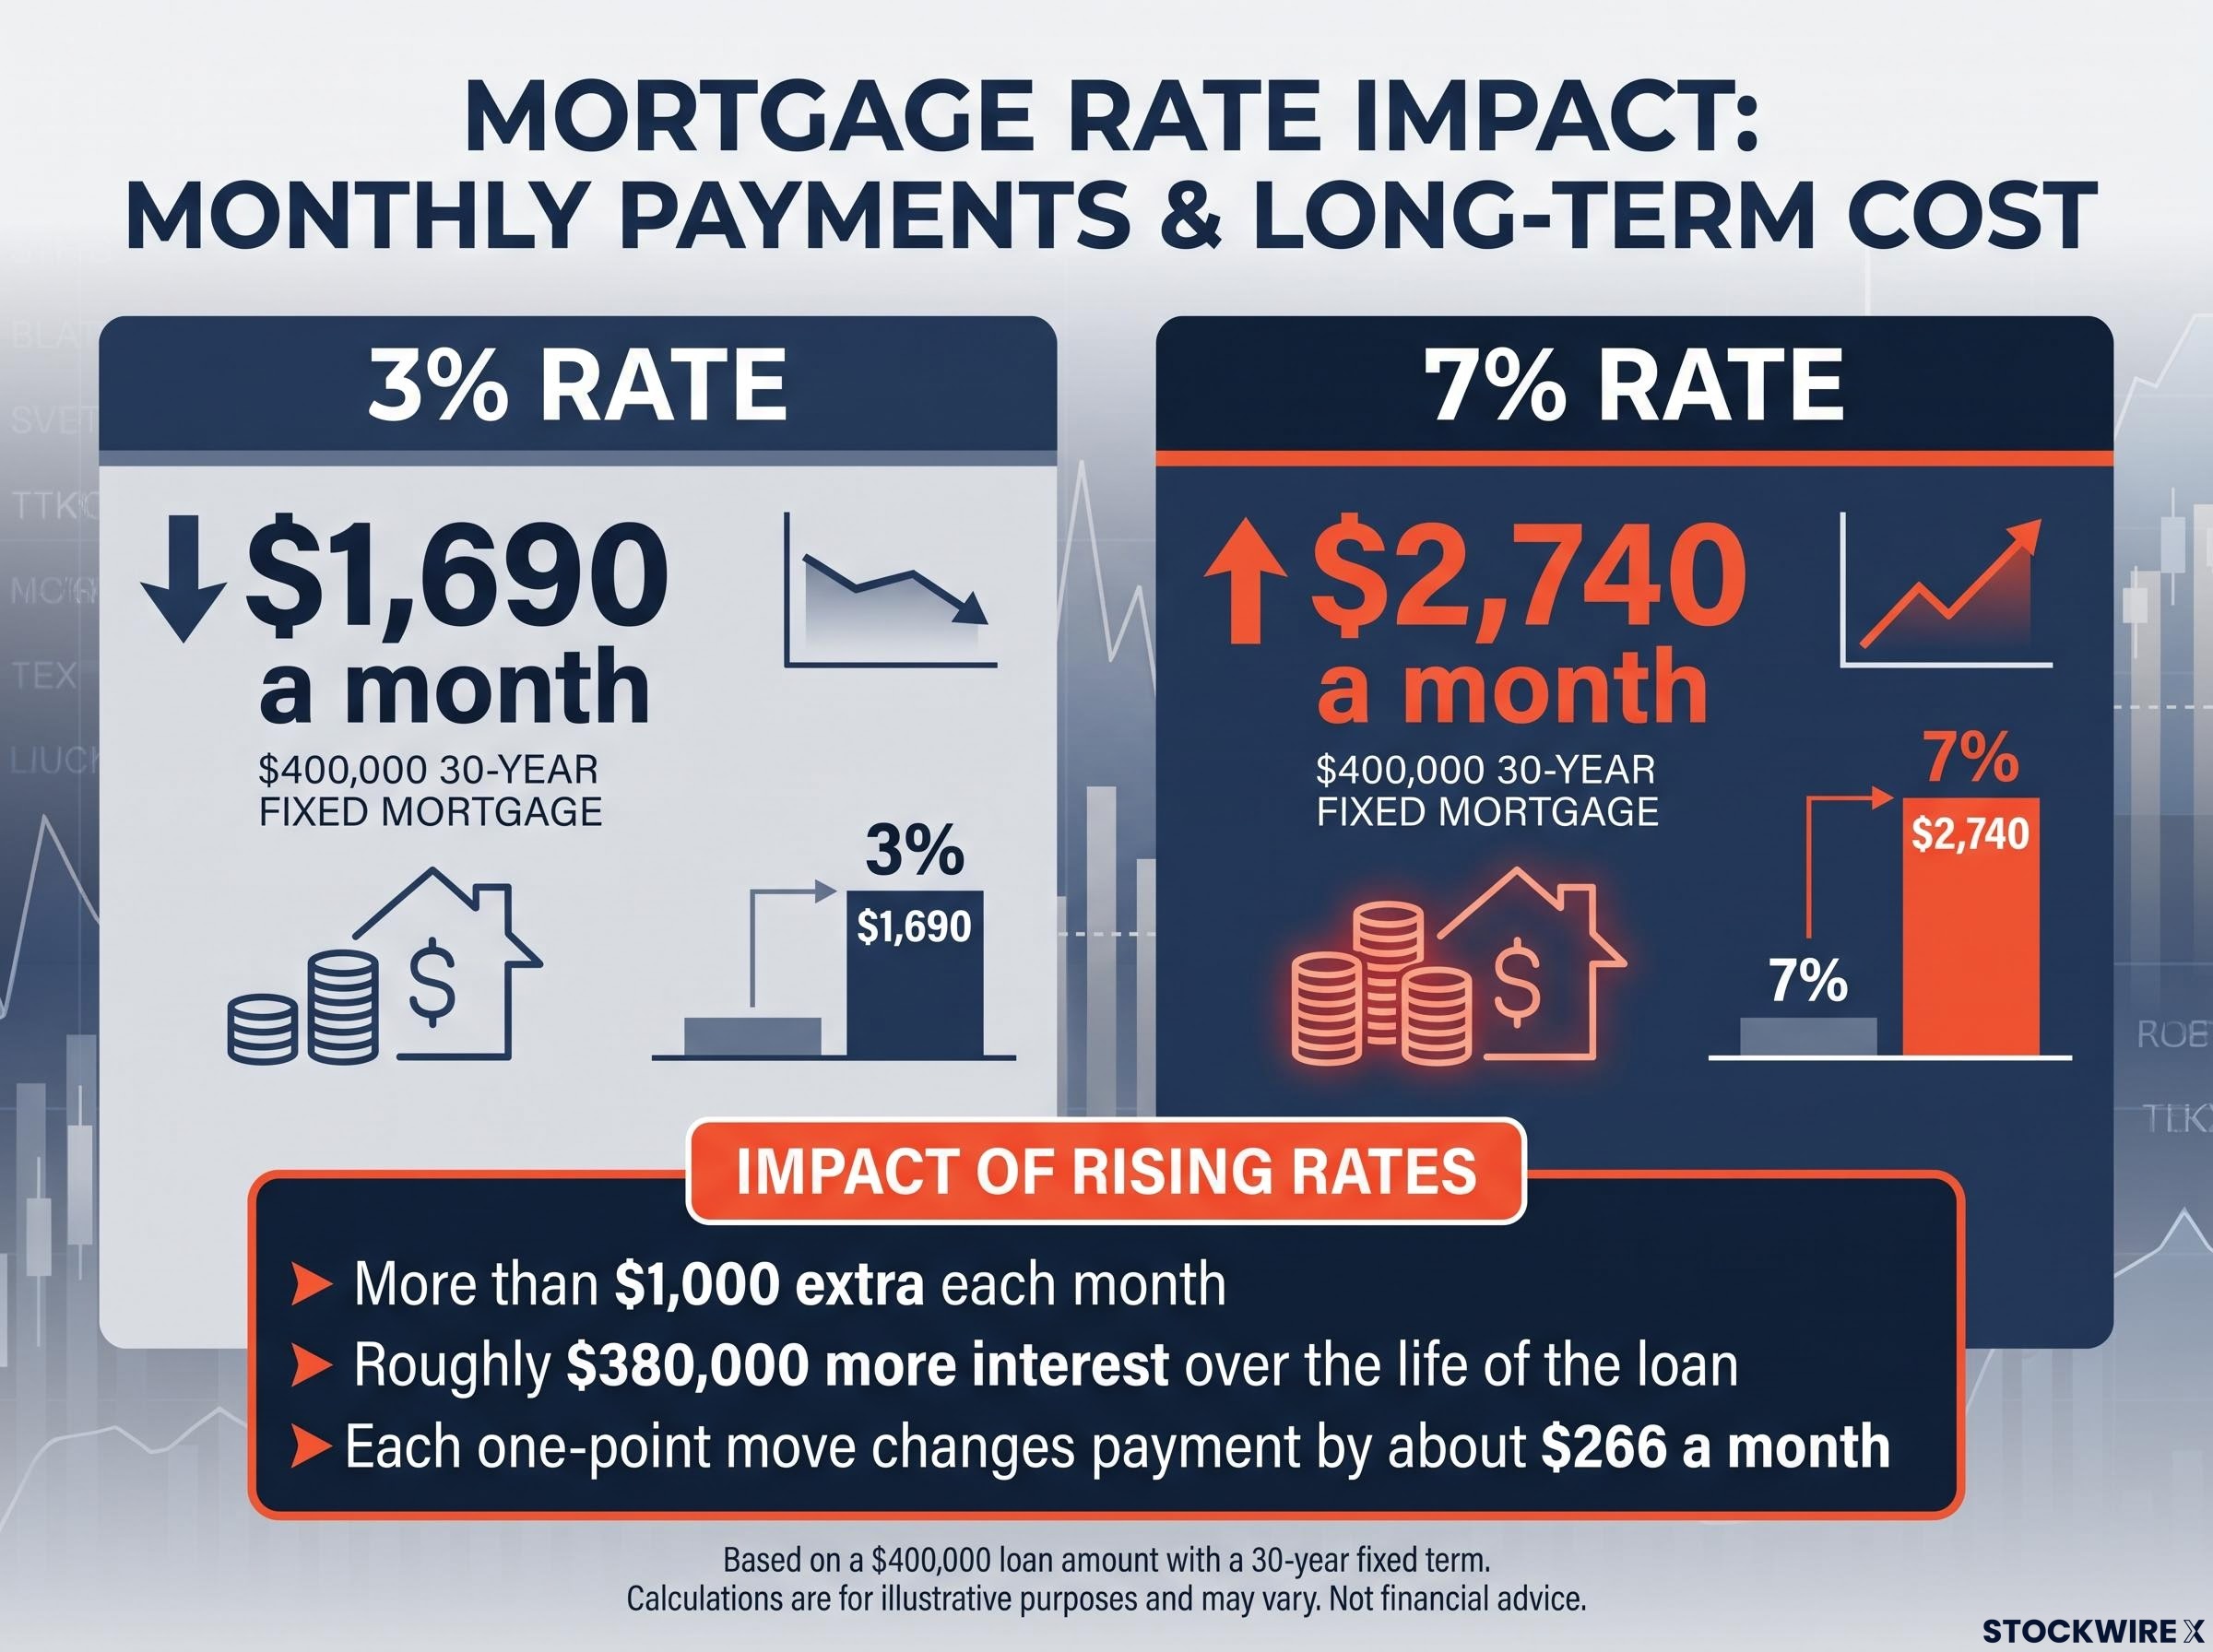
The stakes are concrete. On a $400,000 mortgage, the gap between a 3% loan and a 7% loan comes to more than $1,000 a month.
Three forces are pulling in the same direction. The 10-year Treasury yield is hovering around 5.2-5.3%. Federal debt has passed $40 trillion. And Britain has already shown what happens when bond markets lose patience with a government.
Here is how the chain from Fed policy to your monthly payment works, whether the US is heading for a UK-style break, and which three numbers will tell you.
Why mortgage rates follow Treasury yields, not the Fed
The Fed controls the overnight rate that banks charge each other. Your 30-year mortgage is a different kind of loan, and lenders price it against a different benchmark.
The overnight rate is the only borrowing cost the Fed sets directly, and the long lags before its effects reach mortgages and business loans explain why headline cuts so often seem to do nothing for household borrowing.
That benchmark is the US Treasury. A Treasury is a loan you make to the government, and its yield is the annual return lenders demand for making it. Because Washington is treated as the safest borrower available, lenders price mortgages, auto loans and business loans off Treasury yields, then add a margin for extra risk.
The 10-year yield closed near 5.23% on 1 October, according to Fox Business, and other reports put it around 5.3% in early October, the highest since 2002. Figures vary slightly by source and time of day. Last week the 30-year mortgage average rose from 7.03% to 7.28%.
Four drivers push long-term yields, and then mortgage rates, higher:
- The expected rate path plus a term premium. Fed officials, including Chair Jerome Powell, have described long yields as the expected path of the fed funds rate plus a term premium. The term premium is the extra return investors want for locking money away for many years when the future is uncertain.
- Deficits and supply. The Congressional Budget Office (CBO) says persistent deficits push up real interest rates, and the International Monetary Fund (IMF) has made a similar point. Goldman Sachs and Morgan Stanley pointed to heavy long-dated issuance as a reason term premiums rose in late 2023.
- Real yields. A real yield is the return after inflation. Commentators at Bloomberg and the WSJ argued that long yields have risen since mid-2023 mainly because real yields are higher, while inflation expectations have stayed fairly stable.
- Mortgage spreads. This is the gap between mortgage rates and Treasury yields.
Why the mortgage spread is wider than usual
Freddie Mac, Fannie Mae and mortgage-data analysts all point out that your rate is not simply the 10-year yield plus a fixed markup. The spread changes, and right now it is wide. When rates fall, borrowers refinance, so investors in mortgage bonds lose their higher-paying loans early. Banks also face regulatory capital and liquidity costs when they hold long, prepayable loans, and volatile rates add a further cost.
The double layer Your mortgage rate sits above an already elevated 10-year yield because lenders are charging an unusually large premium on top of it.
Spreads move in cycles. They widen when markets are stressed and narrow when they calm down. The upshot for you is that a Fed cut can leave your mortgage rate exactly where it is, because the rate depends on long-term yields and risk spreads, not the overnight rate.
When big ASX news breaks, our subscribers know first
Is the debt-and-yield loop a spiral or just a squeeze?
If Treasury yields drive your mortgage rate, the next question is what is driving Treasury yields. One answer is a loop that reinforces itself:
- The Fed keeps rates high to control inflation.
- Washington’s interest bill grows.
- Deficits widen.
- The Treasury borrows more by issuing more bonds.
- Lenders absorb that supply only at higher yields, which keeps mortgage rates elevated.
The numbers show the loop working. Debt passed $40 trillion around 18-19 August 2026 and reached about $40.25 trillion in early October, compared with under $20 trillion in January 2017. It reportedly went from $39 trillion to $40 trillion in about five months. Net interest for FY2026 is estimated at about $1.1 trillion, roughly 19-20% of federal revenue and second only to Social Security. A separate tally of cumulative payments, which uses a different basis, reached $1.27 trillion over 11 months. The annual deficit is close to $2 trillion.
The case for alarm
The CBO, IMF and Moody’s warn that rising interest costs crowd out other spending. They also warn that investors could demand bigger risk premiums if they doubt the government can sustain its debt, and that the debt-to-GDP ratio can accelerate. Larry Summers and Ken Rogoff argue that r\*, the neutral interest rate that neither speeds up nor slows down the economy, has moved higher. If they are right, indebted governments have less room than they had in the 2010s.
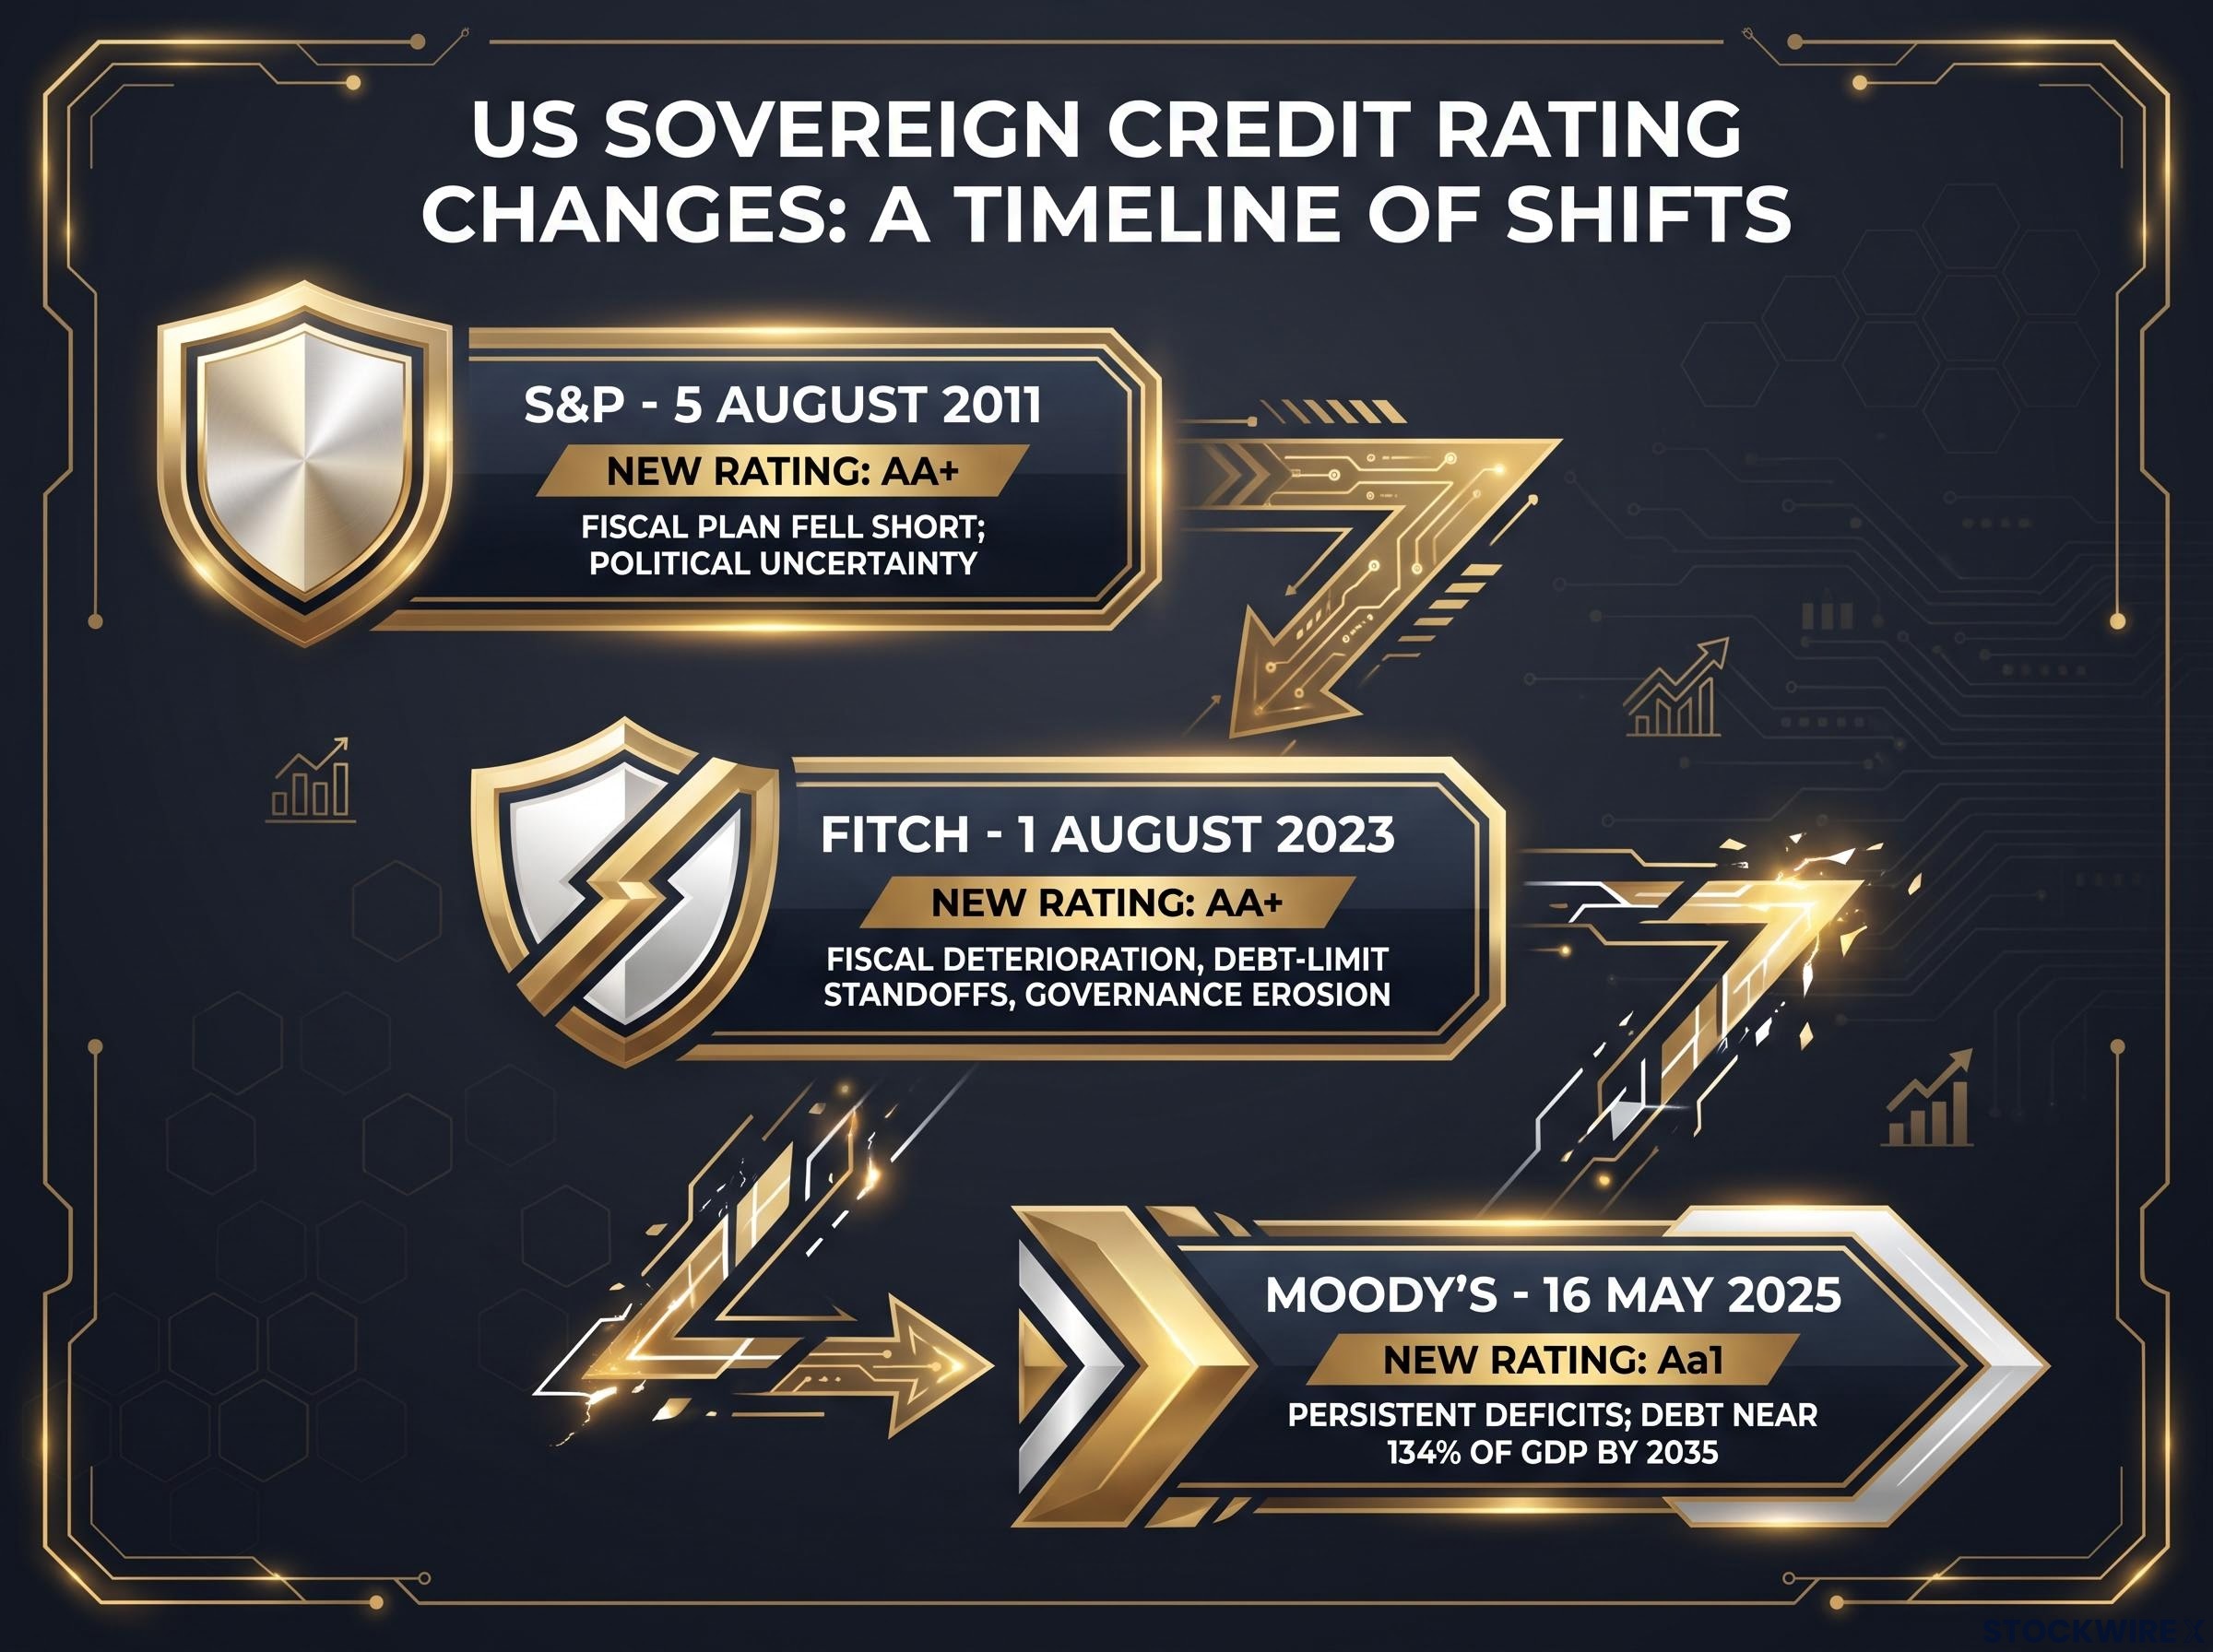
The rating agencies have moved in the same direction.
| Agency | Date | New rating | Stated reason |
|---|---|---|---|
| S&P | 5 August 2011 | AA+ | Fiscal plan fell short; political uncertainty |
| Fitch | 1 August 2023 | AA+ | Fiscal deterioration, debt-limit standoffs, governance erosion |
| Moody’s | 16 May 2025 | Aa1 | Persistent deficits; debt near 134% of GDP by 2035 |
None of the three major agencies now gives the US its top rating.
The case for calm
The US issues the world’s dominant reserve currency and has the deepest bond market. Less than 10% of its debt is linked to inflation, compared with about a quarter in Britain, so interest costs can ease as inflation falls. Strategists at Goldman Sachs, JPMorgan and BlackRock see little near-term risk that the US loses access to markets, as long as inflation stays under control and the Fed remains credible.
Those buffers have limits. Debt-ceiling standoffs, reserve holders diversifying away from Treasuries and delays on entitlement and tax reform could all wear them down. The practical point for you is that part of today’s mortgage rate is a price for fiscal risk, so it is unlikely to fall quickly just because the Fed eases.
What Britain’s 2022 gilt crisis does and does not tell us about the US
Britain is the case that shows how fast this kind of pressure can turn into a crisis. In September 2022, events moved quickly:
- The government announced about 45 billion pounds of unfunded tax cuts.
- 3,961 mortgage deals were on offer on announcement day. More than 1,600 disappeared within about a week, including a record 935 in a single day.
- The average two-year fixed rate rose from about 4.7% to about 6.65% within a month.
- Pension funds using liability-driven investment (LDI), a strategy that uses leverage and derivatives to match future payouts, faced margin calls and had to sell gilts. Those sales pushed gilt prices down further.
- The Bank of England bought gilts from 28 September to 14 October 2022. It pledged up to 65 billion pounds but bought only 19.3 billion (12.1 billion conventional and 7.2 billion index-linked).
Most British borrowers fix their rate for two or five years, so the shock reached their household budgets almost immediately.
The 2022 gilt crisis showed that even a G7 sovereign with its own currency can face a confidence shock when fiscal policy moves faster than credibility can absorb, forcing emergency central bank intervention.
It is tempting to read that as a preview of America. Some of it does carry over. Britain’s 30-year gilt yield stood near 5.96% on 5 October 2026, and one source puts it just over 6% for the first time since 1998. The US 30-year yield is near 5.7%, and the two are moving closer together.
Where the US comparison breaks down
| Factor | UK 2022 | US 2026 |
|---|---|---|
| Leveraged pension structure | Concentrated LDI exposure | No equivalent in long Treasuries |
| Trigger event | Mini-budget shock | No single shock of that scale |
| Inflation-linked debt share | About a quarter | Under 10% |
| Market depth | Smaller gilt market | Largest, most liquid bond market |
Fed communication has also been more predictable than Britain’s was in 2022. A closer American precedent may be 1993-94.
The 1993-94 bond massacre The 10-year yield rose from about 5.2% to about 8%, partly on deficit fears. A credible deficit-reduction plan calmed the market, and the budget was in surplus by 1998.
The source behind this research concludes that the US has more room than Britain but is using it up quickly. Treat the UK episode as a warning about how fast confidence can break, not as a forecast. The 30-year fixed mortgage protects you if you already own a home. It does nothing for a buyer taking out a loan today.
What high rates mean for your household, and three numbers to watch
Translated into a monthly budget, the difference is large.
The payment gap A $400,000 30-year loan costs about $1,690 a month at 3% and about $2,740 at around 7%. That is more than $1,000 extra each month and roughly $380,000 more interest over the life of the loan. Each one-point move in the rate changes the payment by about $266 a month.
That gap also explains the lock-in effect. Owners who refinanced at very low rates have little reason to sell, so fewer existing homes come to market. Redfin and Zillow economists note that thin supply keeps prices high for new buyers.
The lock-in effect now extends beyond housing supply: homeowners holding 3% loans face more than $200,000 in extra lifetime interest on a $300,000 refinance at 7%, which keeps the home equity channel largely shut.
Who feels it first
The considerations below are general, not personal financial advice.
| Reader type | Key consideration |
|---|---|
| Variable-rate borrowers | Rate rises reach you first; paying down this debt is often valuable |
| Existing mortgage holders | Avoid refinancing into a higher rate; treat HELOCs, which are usually variable-rate, with caution |
| Homebuyers | Budget at today’s rate; consider buydowns or seller concessions; be wary of ARM resets |
| Savers | T-bills, CDs and ladders; Treasury interest is exempt from state and local tax; avoid chasing yield |
| Retirement savers | Check bond duration, including in target-date funds; US bonds fell about 13% in 2022 |
Bond duration measures how sensitive a bond’s price is to changes in interest rates. The longer the duration, the larger the price fall when yields rise.
Three indicators to watch
- The 10-year Treasury yield. If it stays above 5% for months, expect borrowing to remain expensive.
- Treasury auction results. A weak bid-to-cover ratio (the value of bids received compared with the amount on offer) or a “tail”, where the auction clears at a higher yield than expected, suggests buyers are struggling to absorb the new supply.
- Freddie Mac’s weekly survey of mortgage rates, along with daily trackers such as Mortgage News Daily, which show how lenders are passing those pressures on.
Reading the loop without waiting for a rescue
High mortgage rates are not the result of a single Fed decision. They come from elevated long-term yields, wide lending spreads and a growing price for fiscal risk, all at the same time.
The US still has more room than Britain had in 2022. That room is shrinking, though, which makes a quick drop in rates unlikely.
The practical approach is to plan around the rate you can get today, not the one you hope for. Use the 10-year yield, Treasury auction results and the weekly Freddie Mac survey to tell when conditions have genuinely changed.
This article is for informational purposes only and should not be considered financial advice. Investors should conduct their own research and consult with financial professionals before making investment decisions. Past performance does not guarantee future results, and forward-looking views are subject to market conditions.