The US Energy Information Administration (EIA) published its latest oil forecast on 6 October, and it points higher: Brent crude averaging about $105 a barrel in Q4 2026. On the same day, veteran floor trader Todd Horowitz said he expects crude below $70 by year-end. He also expects the 10-year Treasury yield to climb toward 6% from roughly 5.2%.
Those are two very different forecasts for oil and Treasury yields. Each one has direct consequences for what you pay at the pump, what a mortgage costs and how your portfolio behaves.
Horowitz, of bubbatrading.com, is short crude and short long-dated bonds. Being short means he profits if prices fall. Both views sit well outside institutional baselines, and three Federal Open Market Committee (FOMC) meetings remain in 2026. The FOMC is the Federal Reserve committee that sets the main US policy rate. Meanwhile, the average 30-year fixed mortgage stood at 7.28% on 1 October, according to Freddie Mac.
This analysis sets out the evidence for each call, the evidence against it and the signposts that would show which side is gaining ground.
Why is a veteran trader short oil when the EIA just raised its forecast?
The two forecasts are $35 apart. The EIA expects Q4 Brent near $105. Horowitz wants crude under $70 within three months.
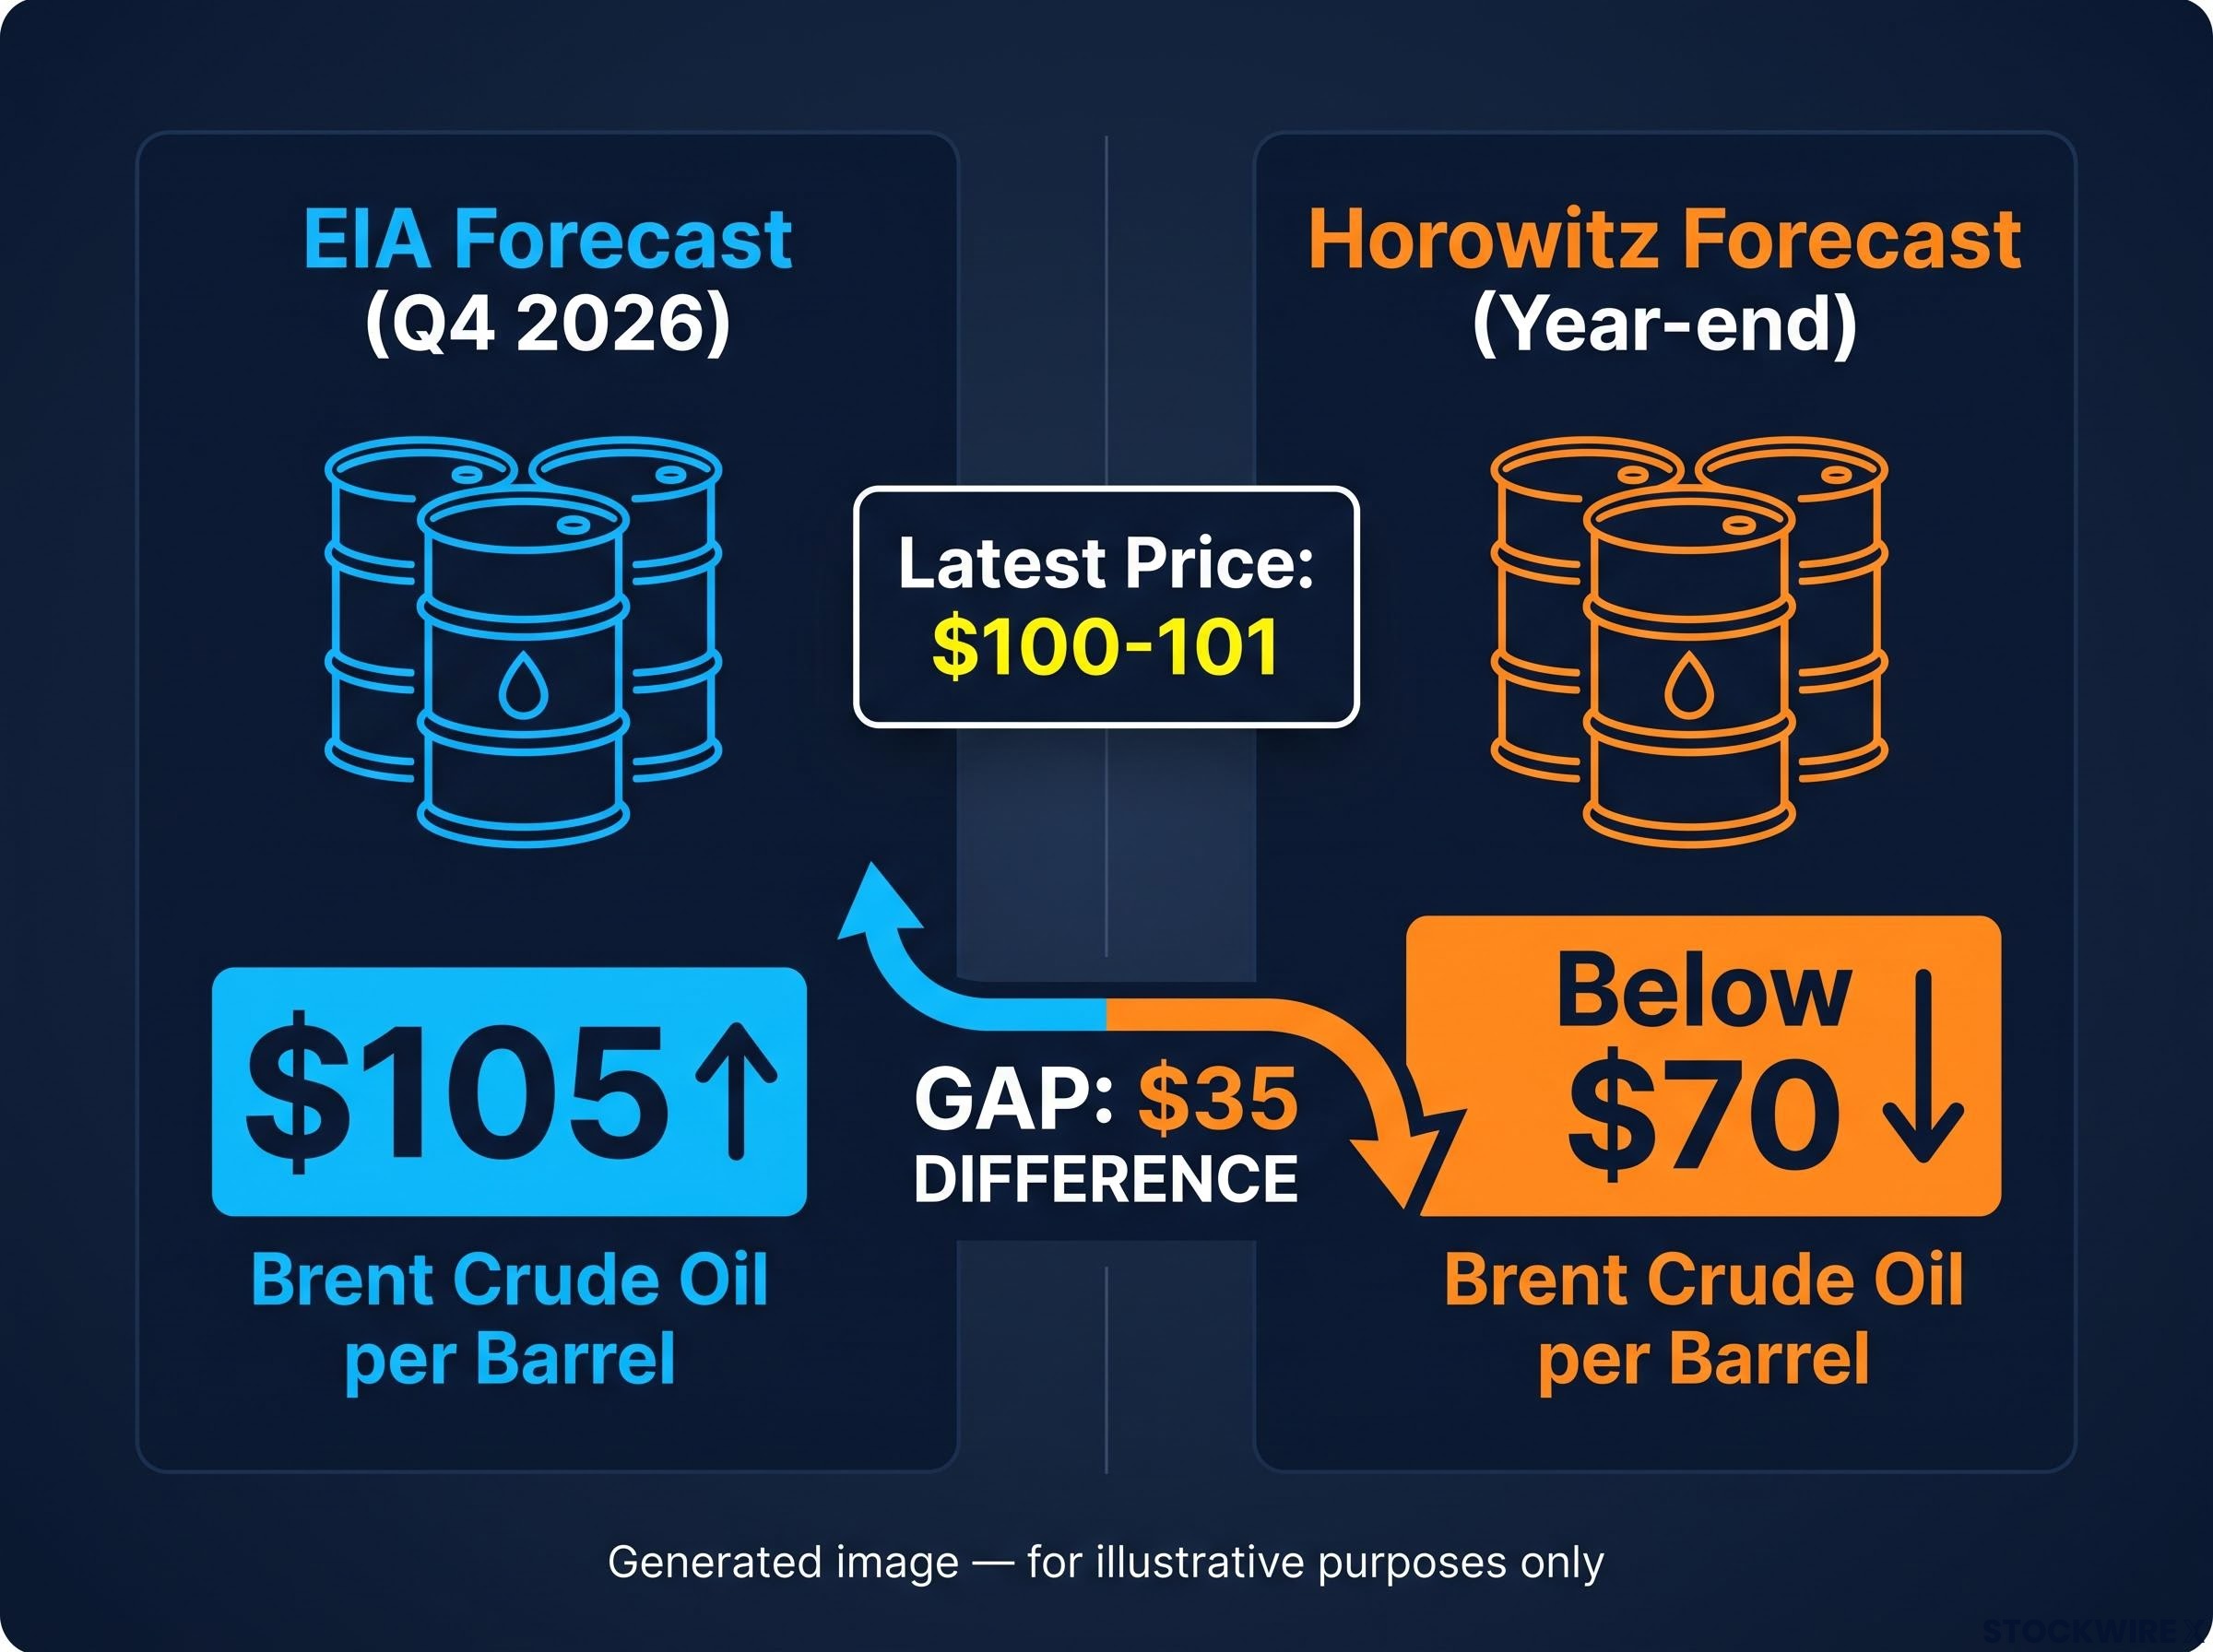
Before you pick a side, it helps to look at what each forecaster is assuming.
The bear case Horowitz makes
Horowitz points to the fall in crude from a peak near $120 as proof that the shortage story is overstated. His argument is that the world has a surplus of crude that simply is not being refined. In his view, that bottleneck keeps fuel prices high and lifts profits at Exxon and Shell, while US supply is ample and domestic usage is declining.
He adds a political argument. With the election about a month away, he expects Republicans to push for lower fuel costs and to address the Iran situation. He also claims that institutions such as the EIA and major banks publish views that suit their own positions. That is his assertion, and it is not an established fact.
His positioning matches his conviction. He has been short since roughly $110-$120, expects about $85 within the week and has standing orders to sell more at $95. The research found no named analyst support for his claim of an unrefined surplus.
What the EIA sees instead
The EIA’s October Short-Term Energy Outlook is the agency’s monthly forecast for energy markets. It lifted Q4 Brent by $14 from the previous month and raised the 2026 average to about $96 from $91. This was its second consecutive upward revision. The EIA cites ongoing Middle East supply disruption, attacks on infrastructure and falling global inventories.
| Measure | Horowitz | EIA | Latest price |
|---|---|---|---|
| Brent | Below $70 by year-end | $105 (Q4 2026); $96 (2026 avg); $84 (2027 avg) | About $100-101 (Sept avg $114) |
| WTI | Below $70; about $85 near term | $88 (2026 avg); $80 (2027 avg) | About $89-90 |
The table shows that the two sides agree on more than the headlines suggest. Even the EIA expects Brent to ease to $84 in 2027. The real dispute is about how fast and how far prices fall, not which way they move. That matters for you because a call can be right on direction and still lose money on timing.
When big ASX news breaks, our subscribers know first
What would have to go right (or wrong) for crude to fall below $70?
A sub-$70 price is a conditional outcome. It needs several things to happen at once, and it is exposed to one sharp risk.
Bulls emphasise supply risk and thin inventories. Bears argue that high interest rates are dragging on demand and that Middle East tensions could ease. Both arguments are credible, and the research found no named bank forecasts to settle the debate. Any confident claim about where Wall Street stands should be treated with caution.
Some evidence supports Horowitz. Strait of Hormuz shipping volumes have nearly returned to pre-war levels on some measures, and oil has already fallen sharply from $120. Tight refining and distillate margins also fit his point about elevated fuel prices, even though his surplus claim remains unconfirmed.
Hormuz supply risk has proved resilient even during diplomatic pauses, since constrained shipping lanes and drawn-down strategic reserves mean sentiment-driven sell-offs can outpace any real improvement in barrels reaching the market.
The timing problem is harder to get around. The EIA’s path keeps prices high through the fourth quarter before easing. Recent pipeline disruptions and continued Middle East constraints are still pushing up oil and distillate prices. A sudden spike can force short sellers to post more collateral, known as a margin call. It can also trigger a short squeeze, where shorts rush to buy back their positions and push prices higher still.
Horowitz acknowledges this risk himself:
Horowitz’s own caveat He concedes that flare-ups involving Iran could send oil back into the $90s.
His $95 sell order is how he manages that upside risk. If he is wrong, he plans to add to the position at a better price rather than exit.
Signposts that would support the sub-$70 view:
- Hormuz flows holding at near pre-war levels
- Visible de-escalation with Iran
- Evidence of demand softening under high rates
- Inventories rebuilding in later EIA reports
Signposts that would undermine it:
- Fresh attacks on infrastructure or pipelines
- Further inventory draws
- Brent pushing back through $95
- Another upward EIA revision in November
For you, the practical takeaway is that oil prices over the next quarter will likely depend more on Middle East headlines and inventory data than on any single forecast. Watch those indicators rather than the forecasts.
Can the 10-year Treasury really reach 6%, and what do prediction markets say?
The 10-year yield traded between 5.17% and 5.28% on 2 October. Reaching 6% would require another climb of roughly 75 basis points (a basis point is one hundredth of a percentage point). Prediction markets offer a way to judge how likely that move is.
How to read prediction-market odds
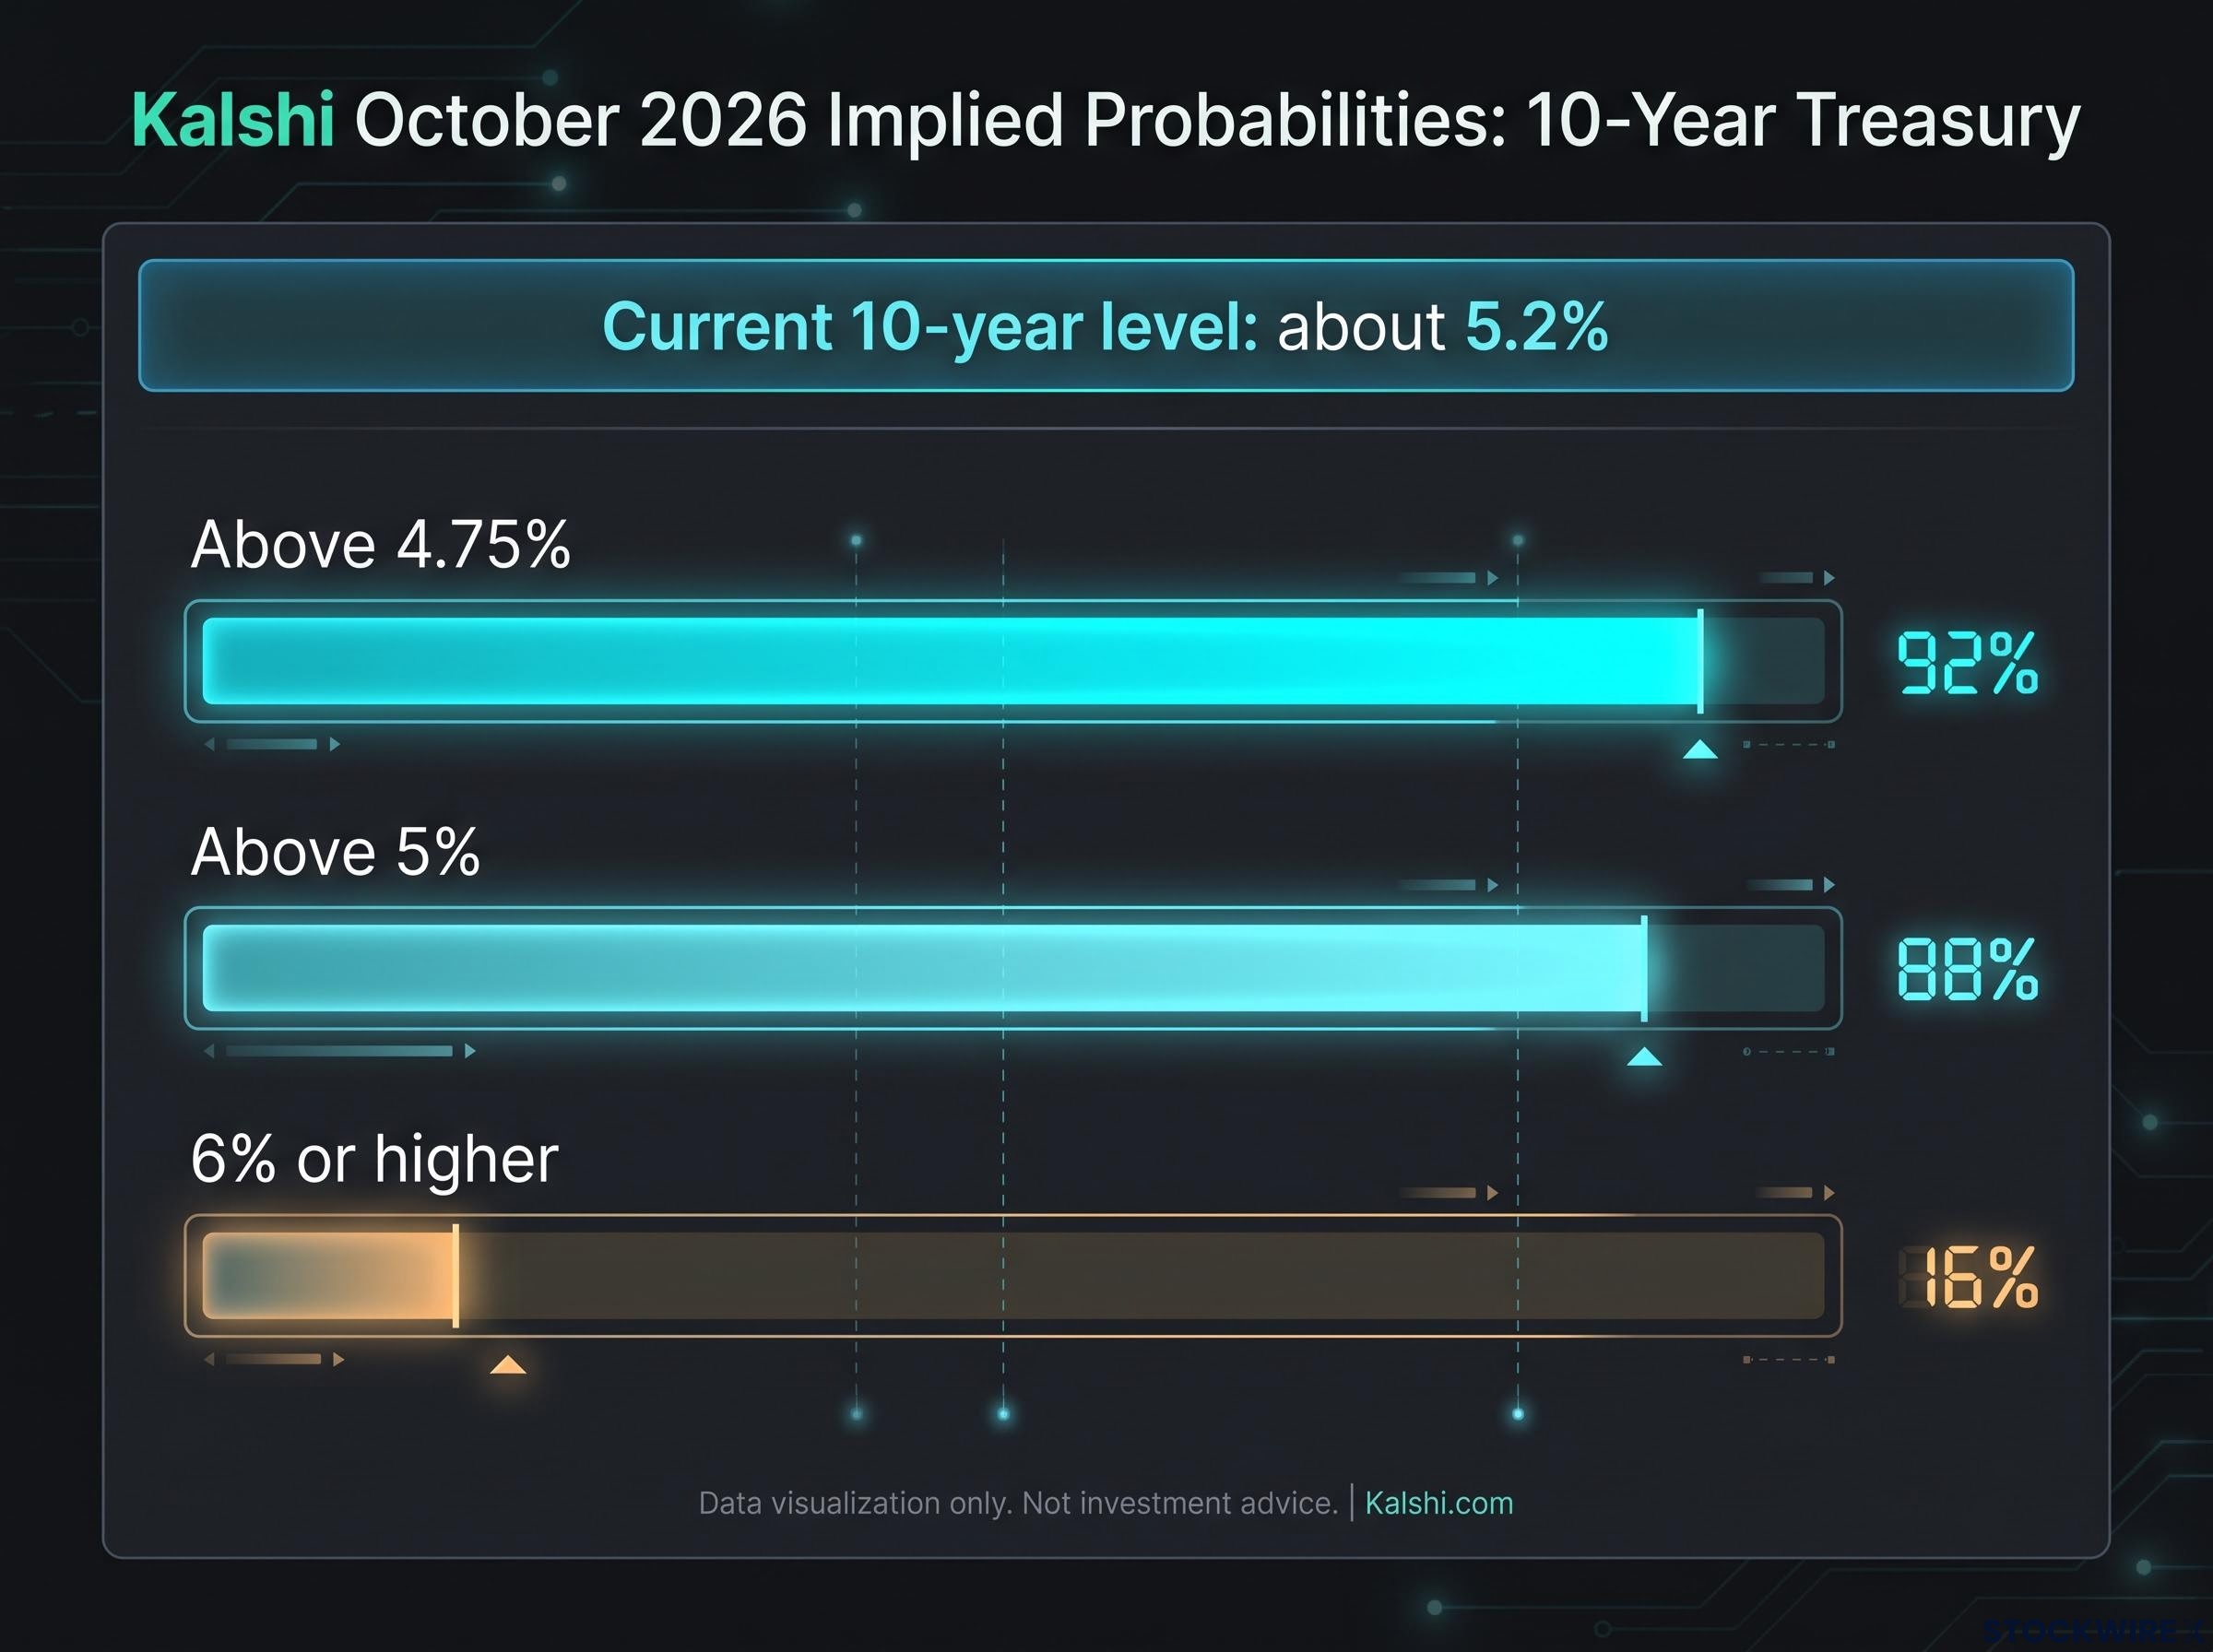
Kalshi is a regulated exchange where traders buy contracts that pay $1 if an event happens and nothing if it does not. A contract trading at 16 cents therefore implies roughly a 16% crowd-assessed probability. These prices reflect what traders are willing to bet, not what experts forecast. Thin trading volumes can distort them, and odds from different dates are not directly comparable.
| Source and date | Threshold | Implied probability | 10-year level at the time |
|---|---|---|---|
| CNBC, 24 August 2026 | At or above 4.75% | About 56% | Near 4.7% |
| CNBC, 24 August 2026 | Above 5% | About 27% | Near 4.7% |
| Horowitz-cited, October 2026 | Above 4.75% | 92% | About 5.2% |
| Horowitz-cited, October 2026 | Above 5% | 88% | About 5.2% |
| Horowitz-cited, October 2026 | 6% or higher | 16% | About 5.2% |
The jump from 27% to 88% for a year-end yield above 5% does not mean the two sources contradict each other. The 10-year crossed 5% in late September, and the odds moved with it. Horowitz notes that a $50 bet on 6% or higher could pay $256, a payout that reflects how unlikely traders consider that outcome.
His bond trades are already profitable. He sold 30-year bonds at 114 (now 102) and 10-year notes at 109 (now 104). Bond prices fall when yields rise, so those lower prices are gains for a short seller. He says one rate hike has occurred this cycle and expects one or two more. The research did not establish the exact federal funds range, so that point cannot be confirmed.
In practical terms, Horowitz links a 6% 10-year yield to mortgages near 9%, compared with 7.28% now (the 15-year fixed rate is 6.60%). A 16% probability means traders see 6% as a real but minority outcome. For your planning, treat it as a stress scenario to test your finances against, not as the base case.
The mortgage link runs through the 10-year Treasury yield, because lenders price 30-year fixed loans at a spread of roughly 2 percentage points above it; a climb toward 6% would therefore feed directly into borrowing costs for new buyers.
What is really driving rates and energy prices, and where do they diverge?
Horowitz points out that oil and yields have moved apart since late September. The reason is that different forces drive them. Oil responds to supply disruption and inventories. Yields respond to inflation and the term premium, which is the extra return investors demand for holding longer-dated bonds.
Based on the available research, which offers analytic synthesis rather than named strategist commentary, the main forces behind rates rank as follows by weight of evidence:
- Persistent inflation above target, which keeps the expected policy path and real rates high
- A higher term premium reflecting uncertainty about future inflation
- Heavy Treasury issuance and fiscal deficits
- Strong demand for credit, which Horowitz attributes to a heavy flow of debt deals
Inflation is where Horowitz departs furthest from official data. He puts true inflation near 10%. August consumer price index (CPI) figures showed 3.4% headline and 2.4% core, which excludes food and energy. Shelter was the biggest contributor, and energy actually held the headline figure down.
The oil and inflation channels work on different timelines: direct energy costs hit headline CPI quickly, while second-round effects through logistics and manufacturing can take 6-12 months to appear in core measures.
Where the 6% call is most exposed
A yield above 6% could undermine itself. At that level, housing demand could collapse, recession fears could build and investors could buy Treasuries as a safe haven, all of which would pull yields back down. Softer inflation or a more dovish tone from new Fed chair Kevin Warsh, who took office on 22 May, could also cap yields. So could changes to Treasury issuance.
Signs of strain are already showing up in credit markets. Corporate bond yields sit near 5.99%, and 30-year TIPS (inflation-protected Treasuries) yield about 3.29%-3.37%. Horowitz cited a Wall Street Journal report that commercial property buyers are threatening to walk away from deals. He also claims Las Vegas has more than 10,000 listings, along with 30% credit card rates, 19% of card balances 90 or more days past due and 8% of mortgages in default. None of these household figures were independently confirmed, and research shows mortgage delinquencies remain low.
For your budget, high oil prices and high rates squeeze from two directions at once: fuel costs and borrowing costs. That pressure is real even if neither extreme forecast comes true.
Weighing two contrarian trades before the next Fed meeting
Both calls are tail views. The EIA’s forecasts, Kalshi odds and current price levels all sit against them. The main threat to each is different: renewed Middle East disruption for the oil short, and a shift in policy or the economy for the bond short.
Four variables are worth tracking:
- Brent relative to Horowitz’s $95 sell trigger
- The 10-year yield against 5% and 5.5%
- The three remaining FOMC decisions
- The next CPI release
Several gaps remain in the evidence. Named bank forecasts, the exact federal funds range and verified delinquency figures were all unavailable. Keeping those gaps in mind helps you separate a well-reasoned contrarian view from a low-probability bet.
This article is for informational purposes only and should not be considered financial advice. Investors should conduct their own research and consult with financial professionals before making investment decisions. Past performance does not guarantee future results. Financial projections are subject to market conditions and various risk factors.