
“Deeply oversold” sounds like an invitation to buy. For the Australian dollar right now, that reading is a trap. AUD/USD has slid since mid-September to sit just under 0.70, and UOB still expects only limited upside from here, even after a modest rebound.
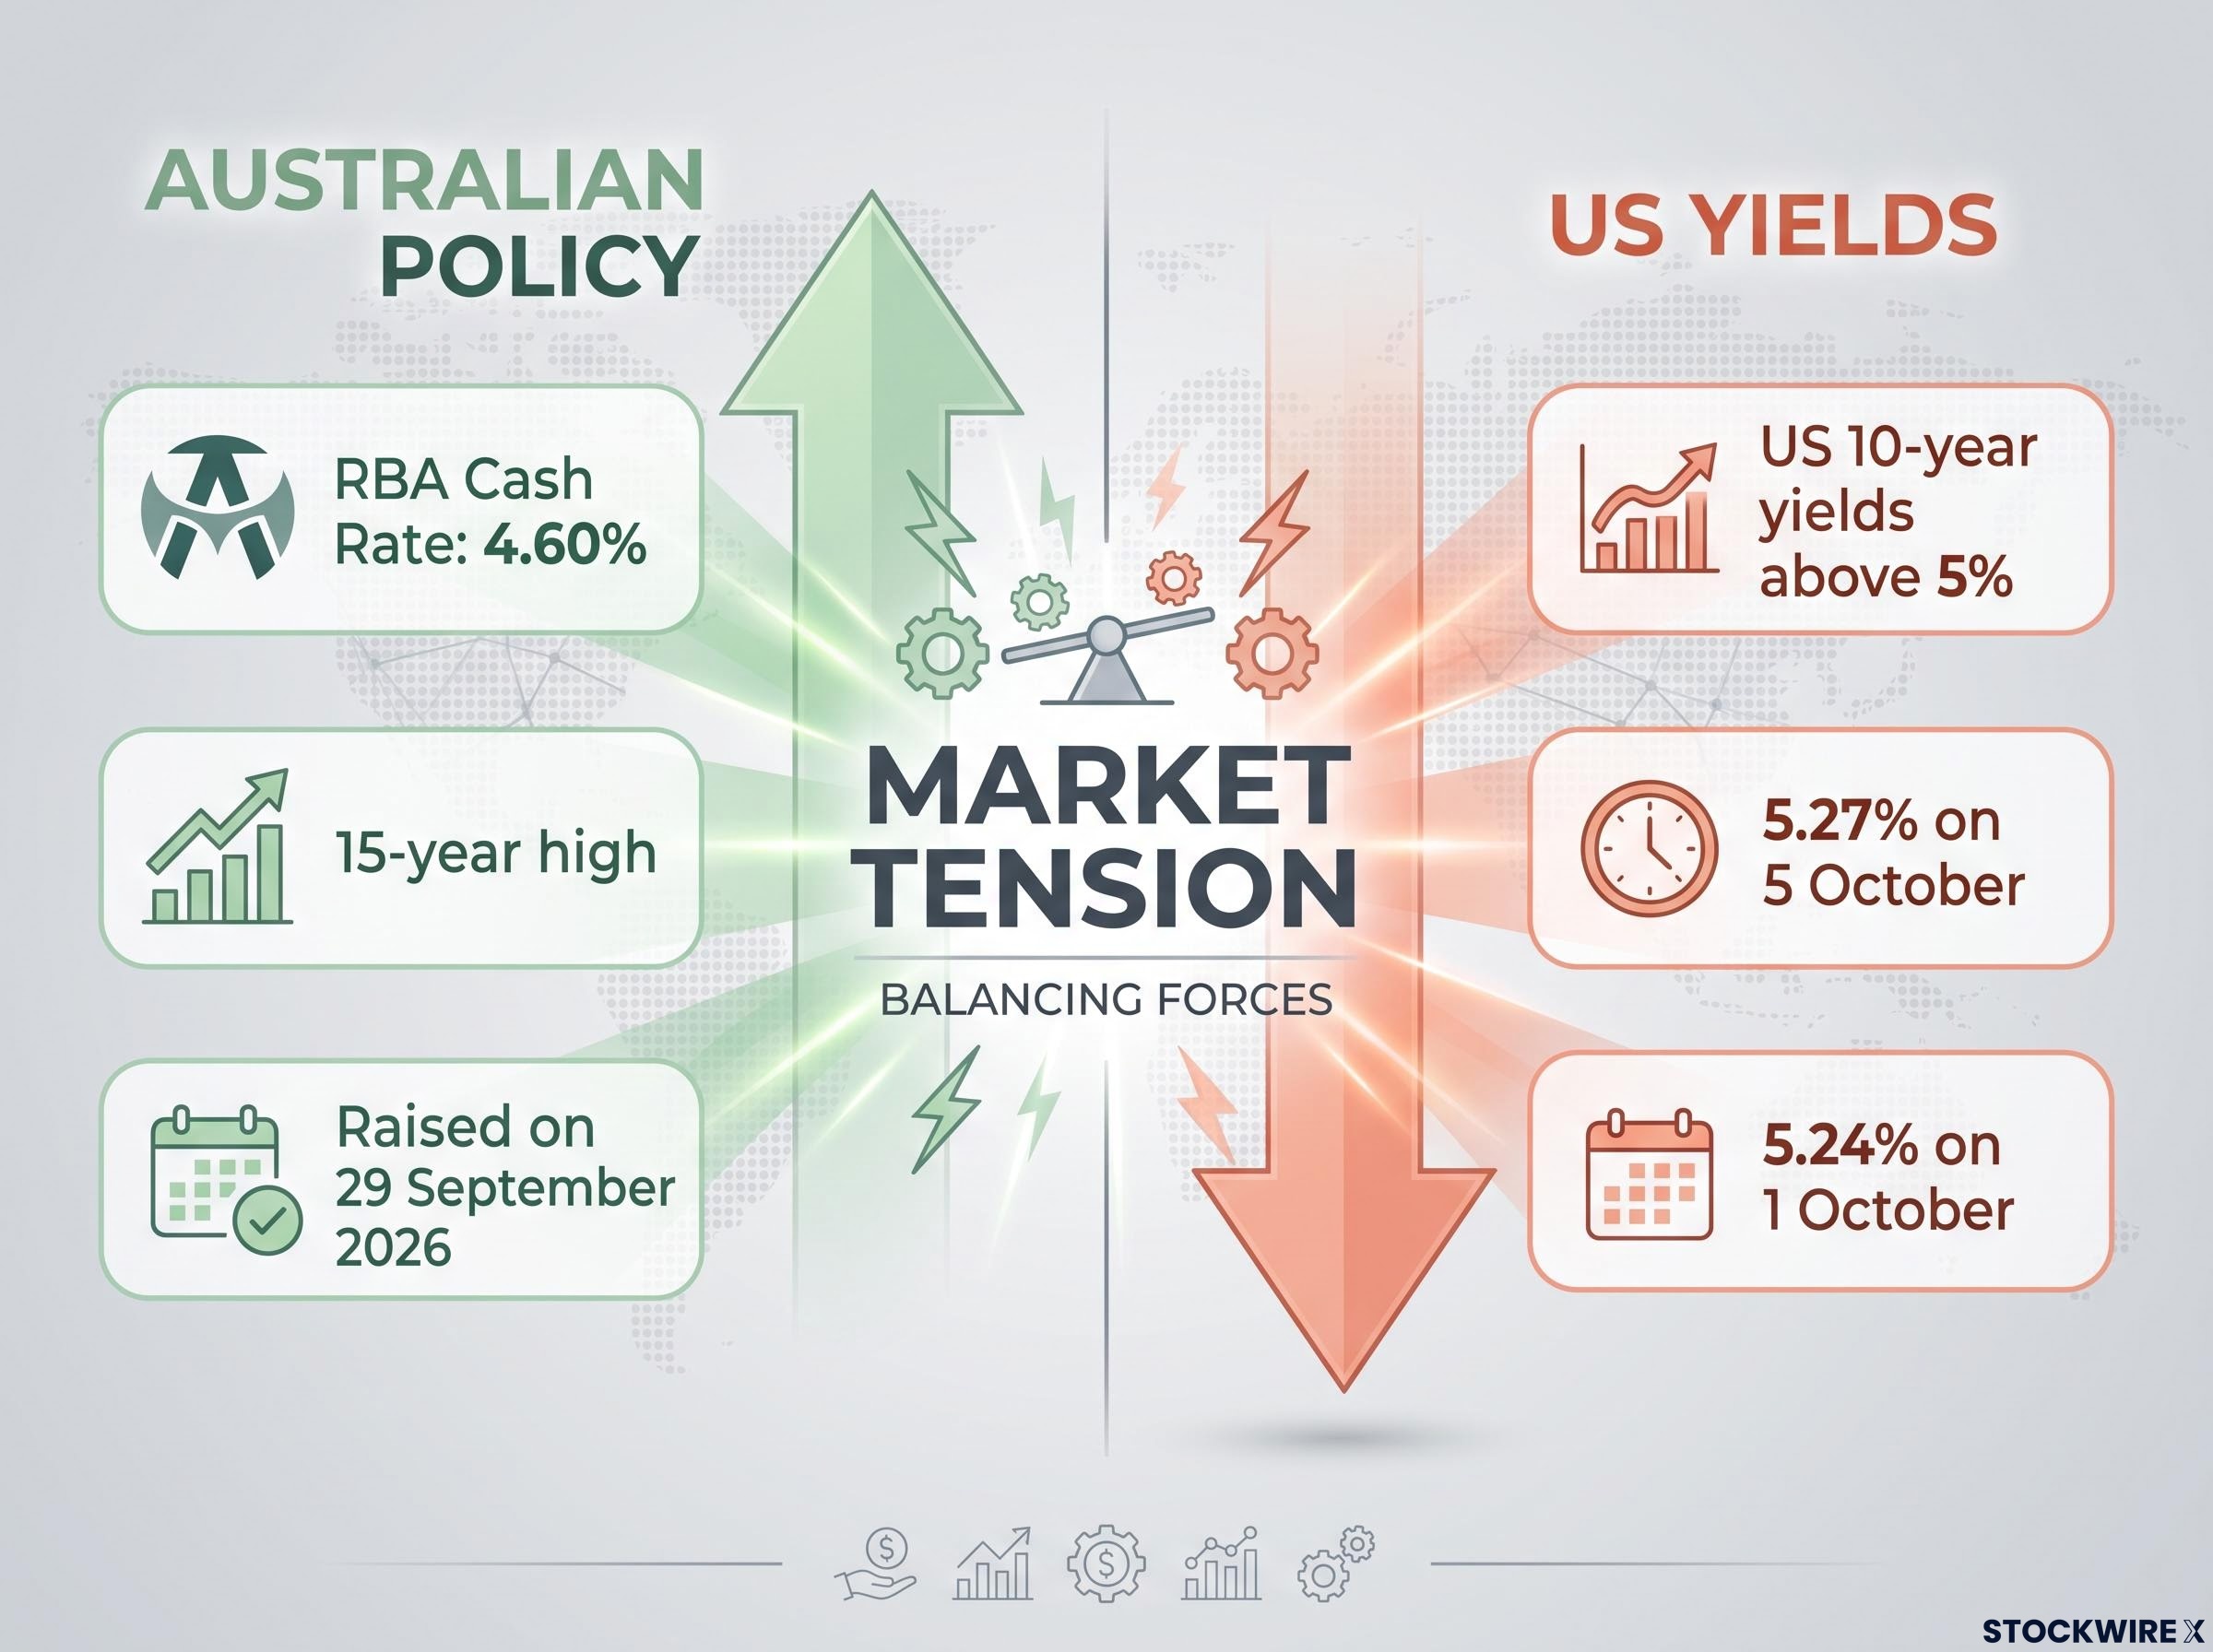
The puzzle deepens once you add the macro picture. The Reserve Bank of Australia (RBA) lifted its cash rate to 4.60% last week, a 15-year high. In theory, that should help the currency.
It has not, because US 10-year Treasury yields above 5% are pulling harder in the opposite direction. That tug-of-war between Australian rate hikes and US yield strength is the tension shaping the AUD/USD outlook over the coming weeks.
Here is what that means in practice. You will see which levels matter over the next one to three weeks, how to read the momentum signals behind them, and which developments would prove the current view wrong.
What is UOB actually saying about AUD/USD right now?
UOB’s FX strategists Quek Ser Leang and Lee Sue Ann hold a clear headline stance: the Aussie has a limited upside bias while it stays below 0.6985, and medium-term risks still lean lower. That single view is assembled from three separate time horizons, and each adds a layer.
The 24-hour view
AUD rebounded from a low of 0.6904 the prior Thursday, and downward momentum slowed. According to the 5 October UOB note syndicated by FXStreet, the pair briefly reached 0.6976 in New York trade before closing 0.29% higher at 0.6951.
A later UOB note, covering Monday’s session, cites a close near 0.6972, up 0.30%, within a 0.6933-0.6974 range. The two figures may reflect different sessions or note editions, so treat each as its own data point. For the next day, UOB expects trade between 0.6945 and 0.6985.
UOB on the rebound The rise “did not result in any increase in upward momentum,” according to the bank’s strategists.
The 1-3 week view
In its 2 October assessment, UOB argued that the slide begun in mid-September was still intact, yet the heavily oversold backdrop meant any extra losses could stop before reaching the next major support at 0.6866. Downward momentum is now easing.
The condition that matters is resistance at 0.6985. Per the 5 October note, only a sustained break above that level would indicate the weakness is stabilising.
The 1-3 month view
Over the longer horizon, UOB flags a bearish exponential moving average (EMA) crossover. An EMA is an average of recent prices that gives more weight to the latest data, and a bearish crossover occurs when a faster average drops below a slower one. The July low of 0.6923 serves as a reference level.
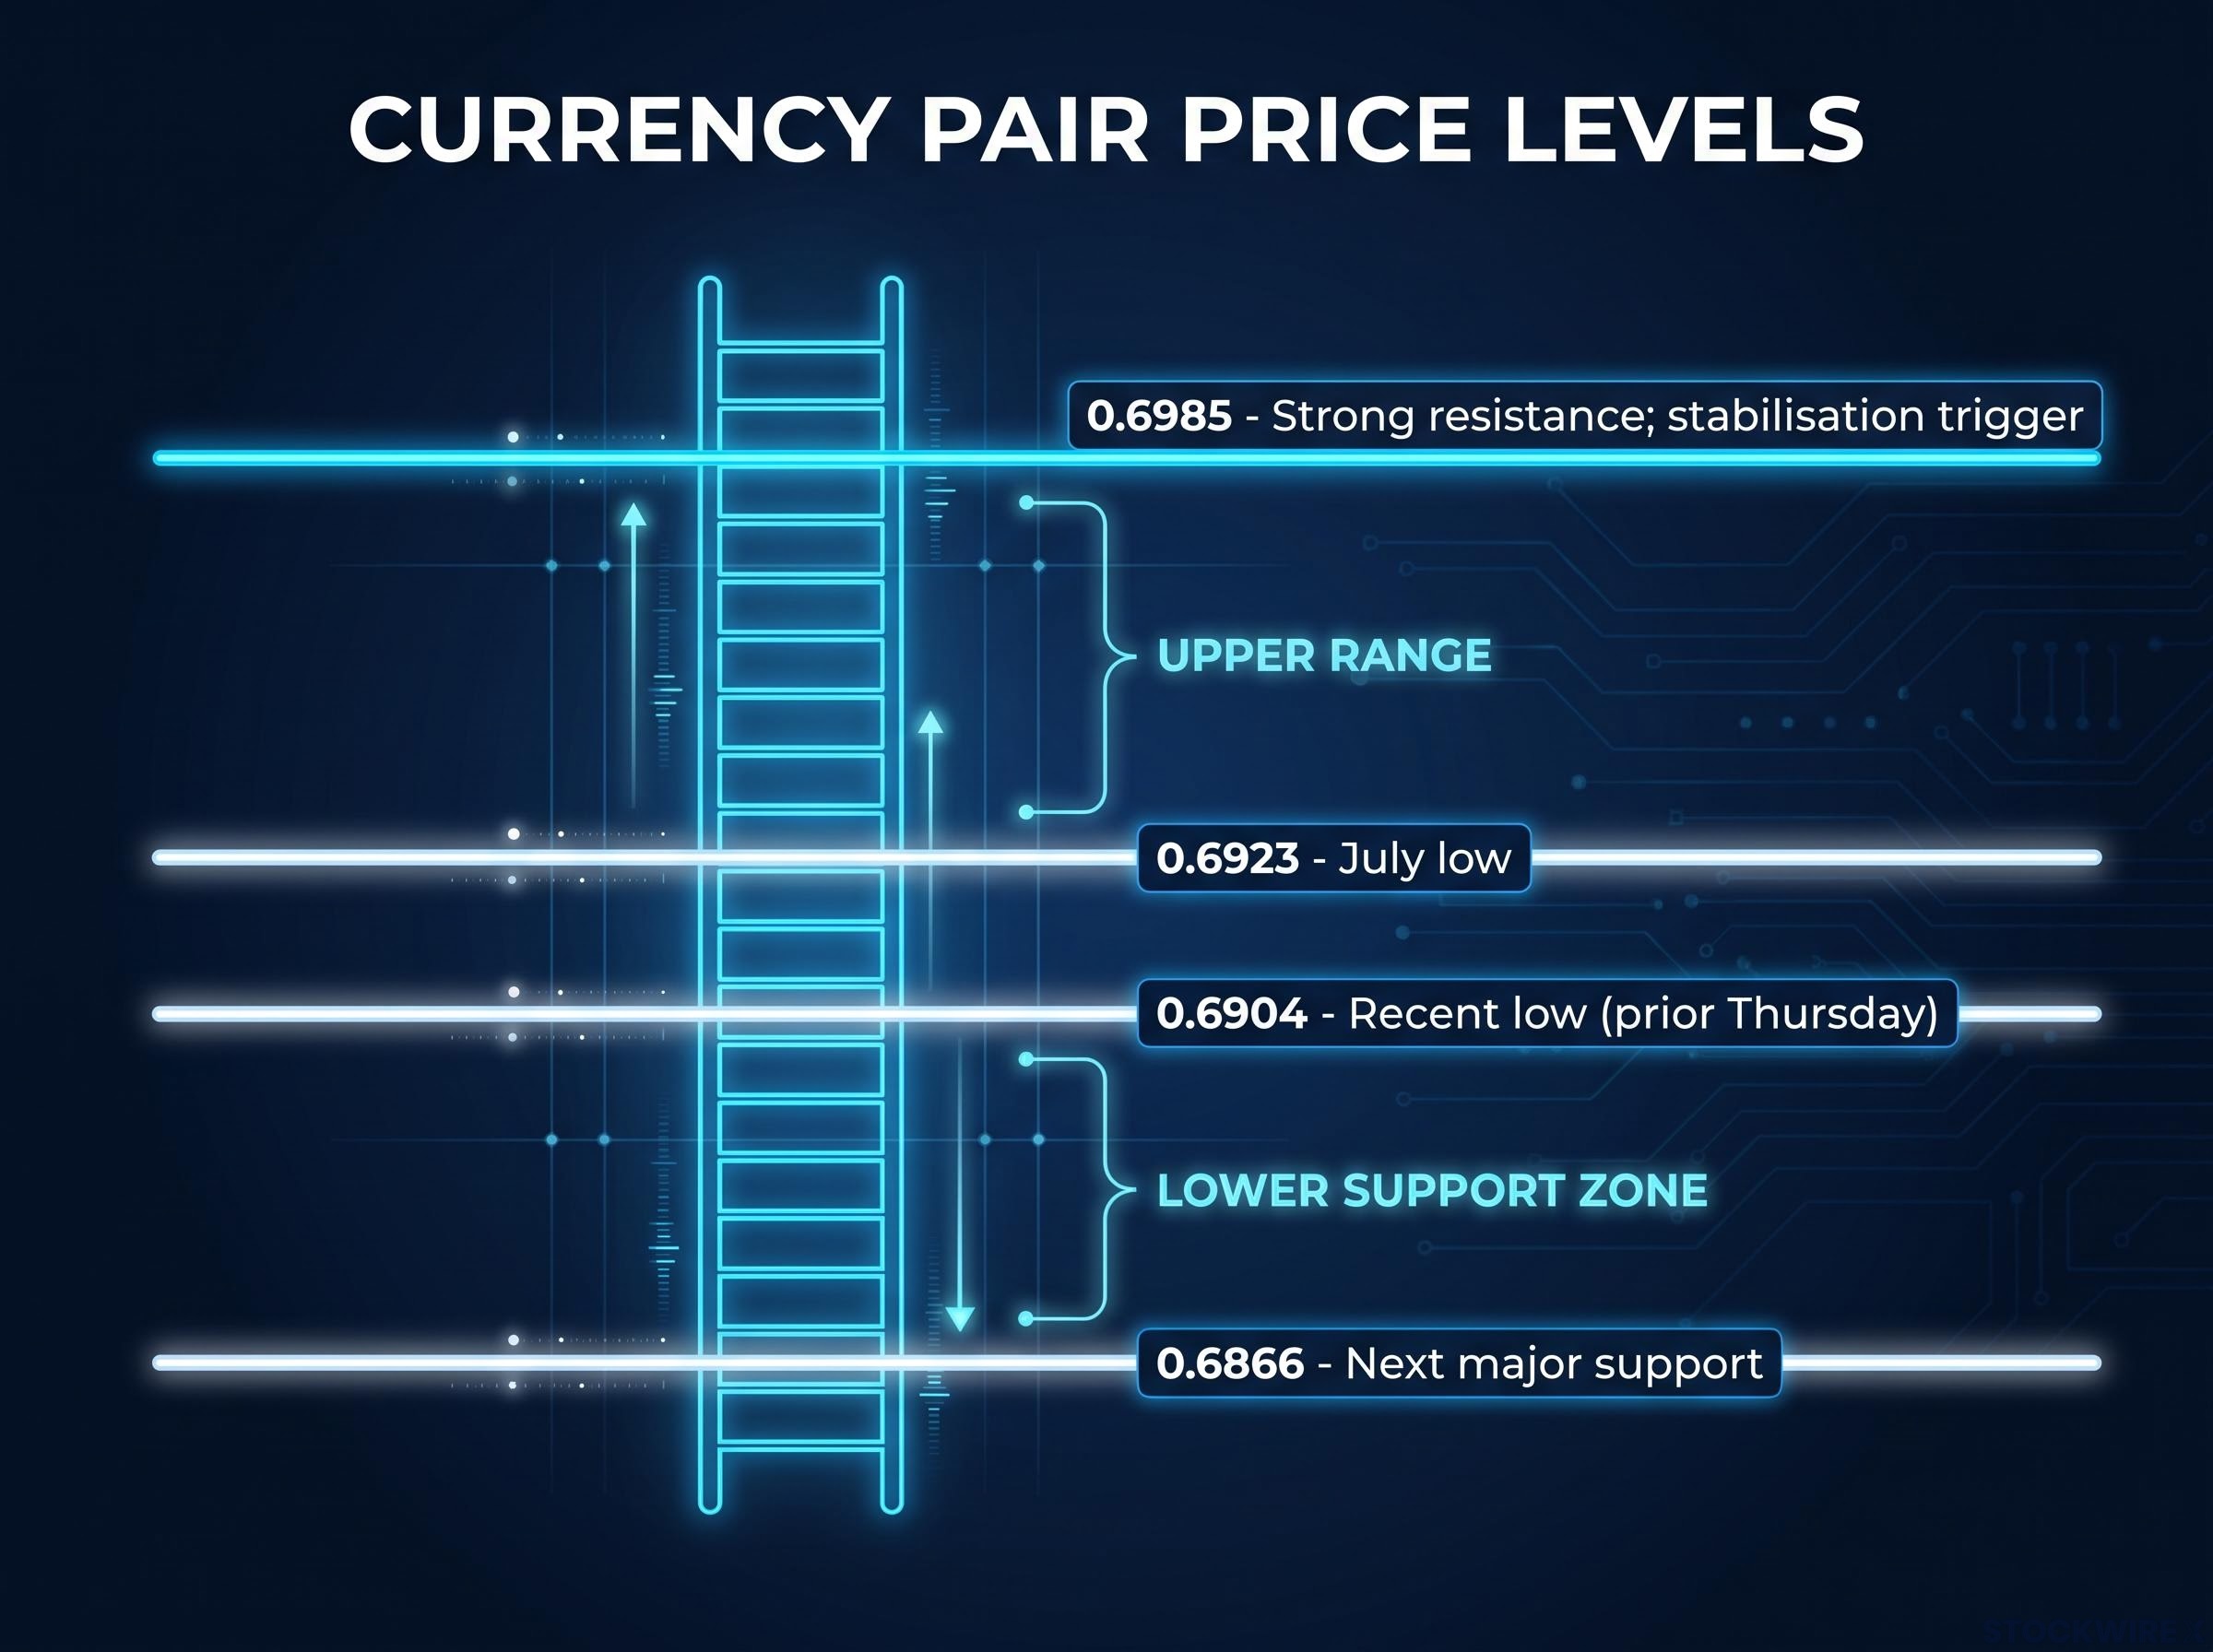
| Level | Role | Source note |
|---|---|---|
| 0.6985 | Strong resistance; stabilisation trigger | UOB 1-3 week view |
| 0.6923 | July low | UOB 1-3 month view |
| 0.6904 | Recent low (prior Thursday) | UOB 24-hour view |
| 0.6866 | Next major support | UOB 1-3 week view |
None of these horizons contradict each other. A short-term bounce can sit inside a longer decline, so a move toward 0.6985 is the ceiling you should watch, not proof that the trend has turned.
On the other side of the pair, dollar index momentum has stayed firm, with the DXY holding above its 20-day EMA, which helps explain why AUD rebounds have struggled to gain traction.
When big ASX news breaks, our subscribers know first
How to read momentum, support and resistance (and why oversold is not a buy signal)
How can a currency be deeply oversold and still be falling? The answer lies in what these indicators actually measure.
Momentum: easing is not reversing
Momentum measures the speed of a price move. When downward momentum eases, sellers are pushing less hard, but they are still in control. A reversal only occurs when buying pressure actually takes over.
Oscillators such as the Relative Strength Index (RSI) and stochastics compare recent closes against a recent range to flag overstretched moves. In a persistent trend, they can sit in oversold territory for weeks.
Oversold thresholds carry little proven edge on their own, whereas RSI divergence at structural levels has shown far stronger results in academic testing, which is why a bare oversold reading should not drive a decision.
Oversold can stay oversold An oversold reading tells you how hard price has fallen. It does not tell you buyers are coming back.
Some historical patterns support this caution, though they are indicative and have not been independently verified. During parts of 2018 and late 2022, AUD/USD reportedly stayed oversold while US rate hikes kept the dollar strong, producing only brief, shallow bounces. Attempts near 0.70-0.71 also reportedly stalled repeatedly when US real yields were high and Chinese demand was soft.
The Aussie is a commodity-linked, pro-cyclical currency, meaning it tends to track global growth. During growth anxiety, its oversold signals are less reliable.
Support and resistance as zones, not walls
Support is a price area where buying has tended to appear; resistance is where selling has tended to cap gains. Treat both as zones of probability rather than fixed barriers. Stop-loss and take-profit orders often cluster around levels like 0.6866 and 0.6985, which can leave the pair stalling between them while it waits for a catalyst.
You can apply the same logic to any short-term technical call:
- Identify the prevailing trend (here, lower since mid-September).
- Check momentum (easing, not reversing).
- Mark resistance and support (0.6985 and 0.6866).
- Define the invalidation level (a sustained close above 0.6985).
The practical takeaway is patience. Wait for confirmation, such as a break above 0.6985, before trusting a rebound.
Why RBA hikes are not lifting the Aussie: the rate tug-of-war
A cash rate at a 15-year high would normally attract capital to a currency. Yet the Aussie has slipped through the RBA’s tightening cycle.
On 29 September 2026, the RBA raised its cash rate target by 25 basis points to 4.60% from 4.35%, its fourth hike of 2026, in what outlets including ABC and SBS reported as a unanimous decision. The statement said the Board would keep doing what is necessary, “including increasing the cash rate target further if needed.” Westpac reads that as firmer than the prior meeting’s language, and now says the bar for a November hike is “low”, making it the base case.
The resolution of the paradox sits in the United States. TradingEconomics data shows the US 10-year yield at 5.27% on 5 October, up 0.48 percentage points over the month, while FRED recorded 5.24% on 1 October. That keeps the dollar’s yield advantage intact.
The currency impact of any RBA move depends on rate differentials with the US, where capital flows toward the higher real return; a hike only lifts the Aussie when it widens that gap rather than merely matching it.
| Institution | Stance | Peak or base-case rate |
|---|---|---|
| UOB | Technical: capped upside below 0.6985, medium-term downside risk | Not specified |
| Westpac | November hike now base case | Above 4.60% implied |
| ANZ | Hikes in September and November | 4.85% peak |
| CBA / NAB | Earlier baseline per Domain’s table | 4.60% |
The CBA and NAB figures reflect an earlier baseline; Westpac sat there too before shifting. Energy costs and Middle East conflict cut across the story, feeding RBA hawkishness while driving safe-haven demand for the US dollar. Fed expectations for early October were not available in the research, so the US policy path remains an open question.
- Supports AUD: RBA at 4.60%, open to further hikes, with Westpac’s base case pointing to November.
- Caps AUD: US 10-year yields above 5%, safe-haven dollar demand and growth pressure on Australian households.
What this tells you is that further RBA hikes help the Aussie only if they outpace US yield strength. A November hike is a support factor to watch, not a guaranteed catalyst.
What could break the AUD/USD outlook, and what to watch next
A clean forecast is only as good as the conditions that would overturn it. Short-term technical views can be overwhelmed by US yield shocks, RBA surprises, China or commodity news, liquidity events and large option expiries.
The research also found no explicit October 2026 AUD/USD calls from other major banks, so UOB’s is the clearest published technical view. Read it as one perspective, not a consensus.
| Trigger | What it implies | Level to watch |
|---|---|---|
| Sustained break above resistance | Weakness stabilising; 0.6866 unlikely to be reached (per UOB) | 0.6985 |
| Drift back below the July low | Mid-September weakness reasserting | 0.6923 |
| Continued slide | Test of next major support | 0.6866 |
- Daily closes relative to 0.6985, not intraday spikes.
- The direction of US 10-year yields around the 5% mark.
- The November RBA meeting, where Westpac’s base case is another hike.
- Energy prices and Middle East developments, which feed both sides of the rate story.
The most useful way to hold this view is as a risk-management map. It tells you where stops might sit and when to reassess, not where to place a bet.
Past performance does not guarantee future results. Forecasts are subject to market conditions and various risk factors, and these statements are speculative and may change with market developments.
Reading the range, not predicting the break
The picture comes down to three layers: a capped near-term range between roughly 0.6866 and 0.6985, an RBA-versus-US-yields tug-of-war, and a bearish medium-term technical backdrop.
The real question is not whether AUD/USD bounces. Bounces have already happened. The question is whether it earns a sustained close above 0.6985, the line UOB itself sets for stabilisation.
Until then, the Aussie’s next direction likely hinges on the RBA’s November decision and whether US yields hold above 5%.
This article is for informational purposes only and should not be considered financial advice. Investors should conduct their own research and consult with financial professionals before making investment decisions.