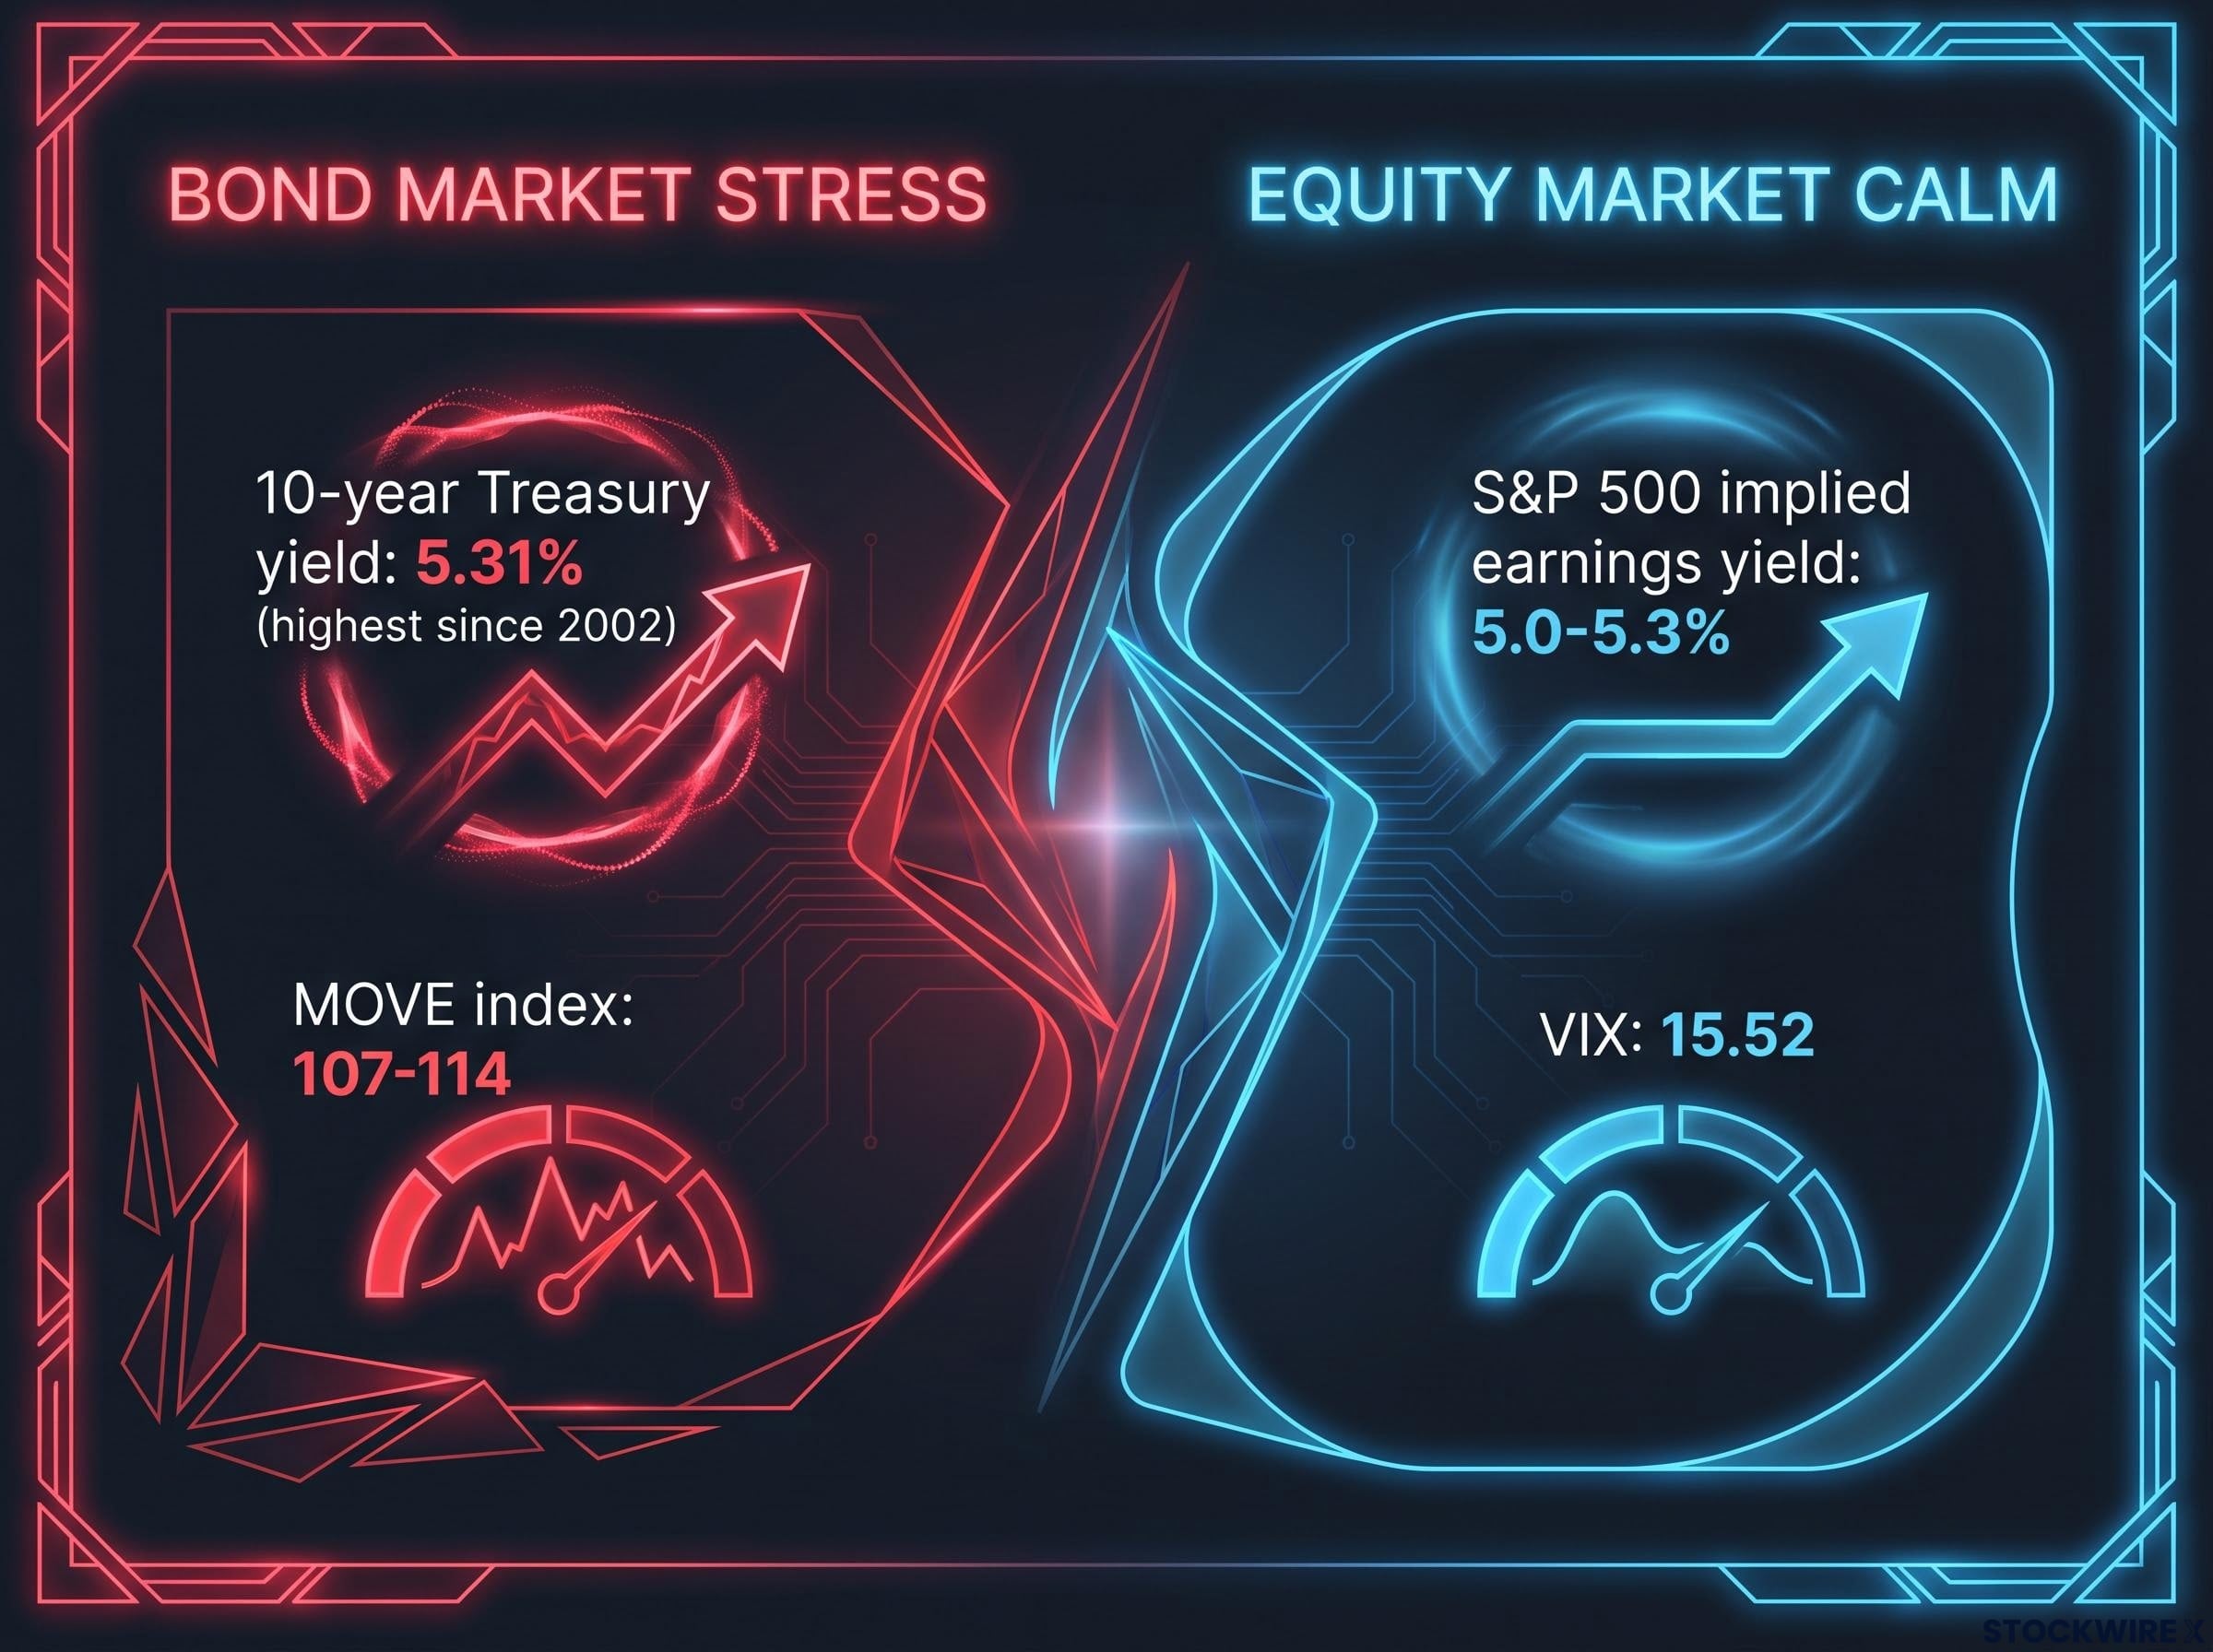
The 10-year Treasury yield closed at 5.31% on 5 October 2026, its highest level since 2002, while the VIX, Wall Street’s main equity fear gauge, sat at just 15.52. Bond traders are pricing stress that stock traders are not, and a post-election market crash prediction is now circulating on the back of that gap.
One strategist, speaking on Tasty Crumbs with host Jamal Chandler of Kai Media, argues the divergence reflects official support for markets before the 3 November midterms. He forecasts a 25-40% equity decline afterwards, followed by large-scale quantitative easing (QE), where a central bank creates money to buy bonds.
This is one speaker’s opinion and a tail-risk view, not consensus.
Here is how to separate what you can verify (yields, buybacks, valuations) from what remains speculation (market management, the crash range, the size of any QE).
What does the data show four weeks before the midterms?
Start with the verified numbers, because they decide which of the speaker’s observations hold up. The 10-year yield at 5.31% is a roughly 24-year high, so his “almost 20 years” is directionally right but understates the span.
The dollar index (DXY) closed near 102.1, at multi-month highs. The MOVE index, which measures expected bond-market volatility, sits at about 107-114, against the VIX at 15.52.
| Metric | Speaker’s Claim | Verified Figure | Assessment |
|---|---|---|---|
| 10-year yield high | Highest in almost 20 years | Highest since 2002 (about 24 years) | Directionally right, understated |
| September payrolls | Positive narrative | +29,000 vs about 90,000 consensus; unemployment 4.2% | Sizeable miss |
| Earnings yield | 4% | About 5.0-5.3% | Lower than implied, conclusion holds |
| Buyback figure | $6B “full cap” hit | $4B+ per operation; about $83B window maximum | Misdescribed |
Brent crude trades around $101-102, and the G7 agreed to release 100 million barrels from reserves. The Treasury General Account, the government’s cash balance at the Fed, stands near $984 billion, consistent with the speaker’s “about $1 trillion.”
The observation with real analytical weight is the volatility gap. Mainstream analysts read a high MOVE alongside a low VIX as bond and equity traders pricing different risks, not as proof of suppression. For you, that means the bond market is flagging a danger that equity holders have not yet priced.
Schwab’s MOVE index explainer describes how rising bond volatility alongside a falling VIX is typically read by analysts as the two markets pricing different risks, which is the interpretation that carries the most weight in this debate.
When big ASX news breaks, our subscribers know first
Why are long-end yields rising, and what does 4% versus 5.5-6% actually mean?
Picture a stock market yielding less than a government bond. That is the squeeze equity investors face now.
How earnings yield works
Earnings yield is a company’s earnings divided by its share price, which makes it the inverse of the forward price-to-earnings (P/E) ratio. The S&P 500 trades at a forward P/E of about 19.0-19.8, implying an earnings yield of roughly 5.0-5.3%.
Valuation comparison Implied S&P 500 earnings yield: about 5.0-5.3%. 10-year Treasury yield: 5.31%.
The speaker cited 4% against government yields of 5.5-6%. The data show a smaller gap, but the conclusion survives either way: equities offer little or no premium over risk-free bonds. That leaves less cushion if earnings disappoint, which matters directly if you hold broad US index funds.
The four pressures on the bond market
The 10-year has risen about 0.48 points in a month and 1.12 points in a year, and the 30-year is above 5%. Mainstream analysis corroborates the speaker’s four drivers, ranked as he ranked them:
- Refinancing of 2020-2021 debt: ultra-cheap borrowing is being rolled over at much higher rates.
- AI-capex borrowing: data centre and infrastructure spending is partly funded by long-term debt.
- Reduced foreign demand: Japan and China have cut net Treasury purchases, so domestic buyers absorb more supply.
- Hormuz-linked inflation: oil near $100 adds inflation risk and lifts term premiums.
Dealer balance-sheet limits amplify the strain when large auctions must clear. The speaker’s view that yields could reach 6-7% without intervention is opinion, but the pressures behind it are real, which is why yields are not simply a number officials control.
Is the market being managed? Weighing the evidence
The speaker’s strongest case rests on documented actions. A Treasury announcement on 19 August 2026 at least doubled long-end buyback sizes, from $2 billion to at least $4 billion per operation, from 9 September to 4 November. Reuters put the window maximum at about $83 billion.
The TGA near $1 trillion gives Treasury ample cash to operate. Add the G7 reserve release and the timing looks suggestive.
Then the counter-evidence arrives. Treasury calls the buybacks liquidity support and cash management, with about $20.1 billion and $24.6 billion respectively already conducted this quarter. Longer-term yields rose after the announcements, the opposite of what suppression would produce. The $6 billion figure is a per-announcement size, not a “full cap.”
| Claim | Speaker’s View | Counter-Evidence | Status |
|---|---|---|---|
| Buybacks support markets | Cap hit, capital freed for bonds | Yields rose after announcements | Documented, intent disputed |
| Payrolls managed | Positive narrative | +29,000 print missed consensus | Unsupported |
| Liberation Day rebound | Evidence of control | 9.5% one-day rise followed tariff pauses | Alternative reading |
The Fed has run quantitative tightening since 2022, and its mandate does not cover equity prices. Both 2008 and 2020 brought major declines around election periods despite massive intervention.
- Documented: expanded buybacks, a TGA near $1 trillion, the G7 reserve release.
- Undocumented: equity support, payrolls manipulation, coordinated one-day rallies.
Official support for Treasury market functioning is real, but it is not the same as propping up stocks. Be wary of treating any single-day rally as proof of coordination.
For readers wanting the mechanics, our full explainer on the Treasury buyback programme shows why the roughly $14 billion incremental support moved the 30-year yield more than its size implied.
What would a 25-40% decline and QE actually require?
The speaker expects a 25-40% equity fall after the midterms, then QE larger than any since 2008 through about June 2027, plus a long-end bond facility, a sovereign wealth fund and “Trump accounts.” He also relays a warning from former Treasury Secretary Hank Paulson about a coming Treasury crisis, which comes only via the speaker.
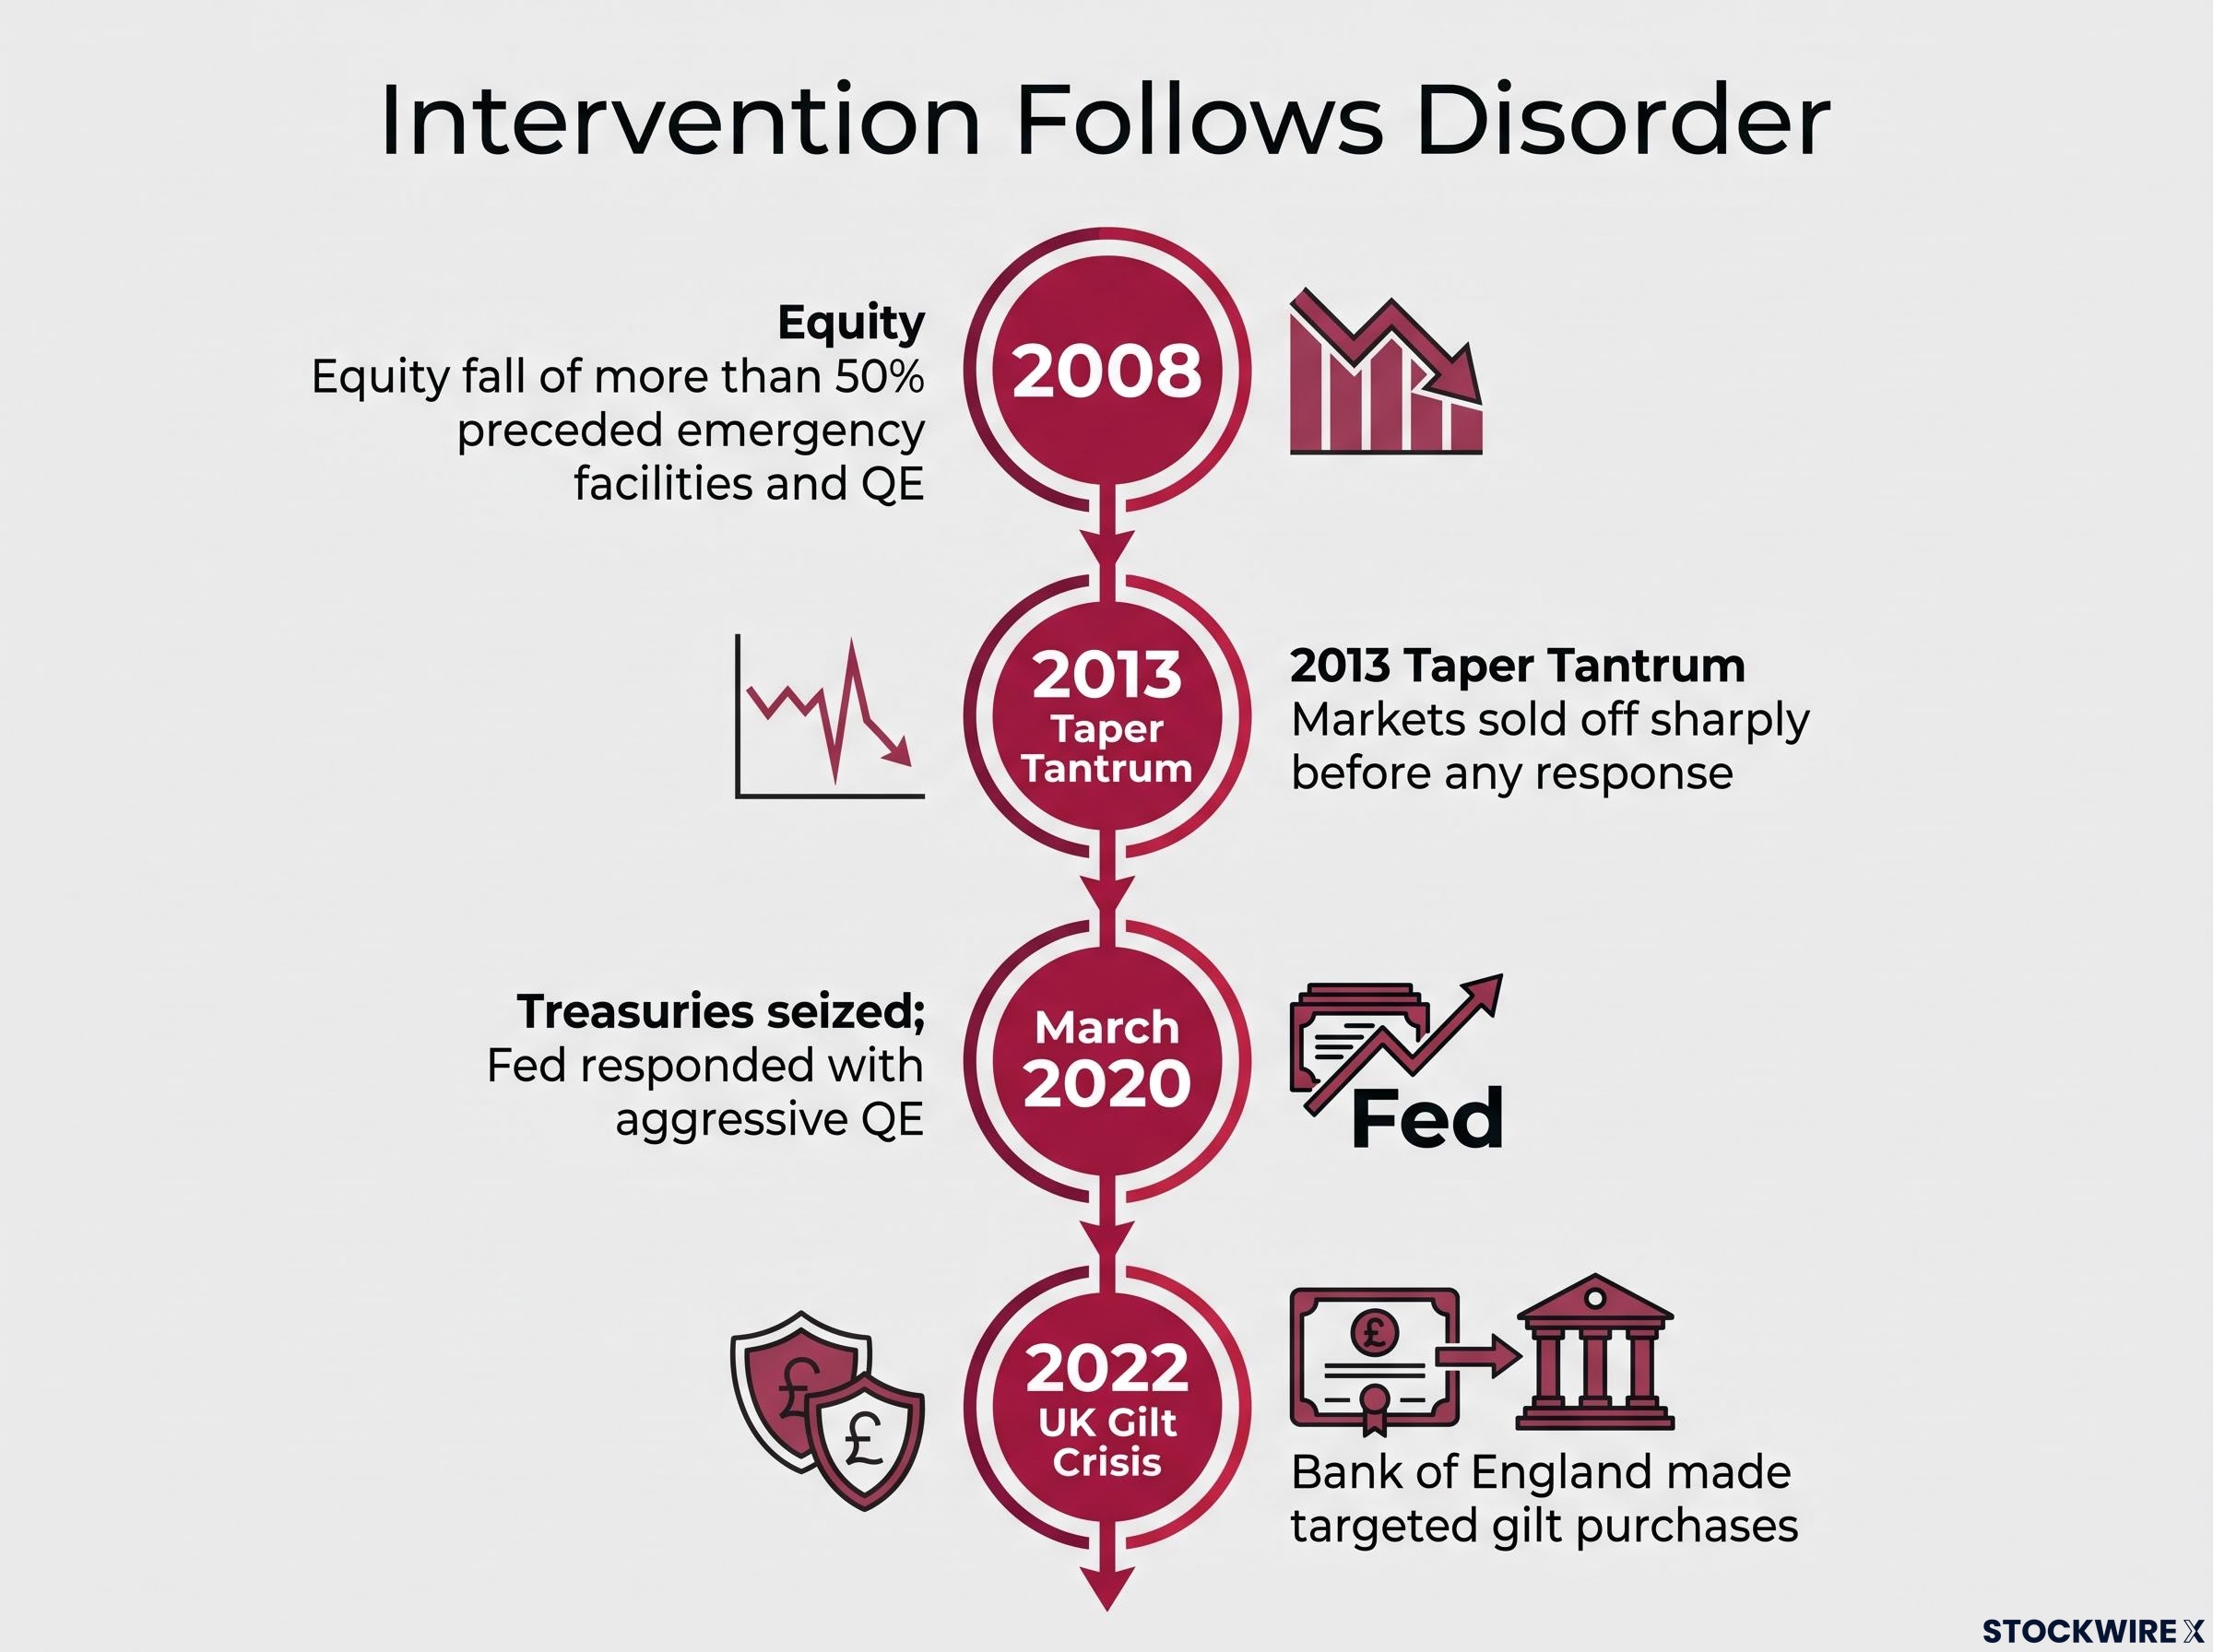
History suggests intervention follows disorder rather than precedes it:
- 2008: funding strain preceded a peak-to-trough equity fall of more than 50%; emergency facilities and QE followed.
- March 2020: Treasuries briefly seized; the Fed responded with aggressive QE.
- 2022 UK gilt crisis: the Bank of England made targeted, temporary gilt purchases, not open-ended QE.
- 2013 taper tantrum: markets sold off sharply before any response.
The closest precedent is Operation Twist, whose capped 2011-2012 programme delivered only about 15 basis points of long-end yield reduction, a useful ceiling for what bounded buybacks can achieve.
Speaker versus mainstream view The speaker sees QE as a planned post-election policy. Mainstream analysis treats QE and yield-curve control as contingent crisis tools, used only under severe stress.
His claims of negative real rates and inflating away debt, and an equity market worth roughly $300 trillion, are his own figures and opinion. A crash-then-QE sequence needs a trigger such as recession or Treasury dysfunction, so watch those rather than the calendar:
- Treasury auction stress, such as weak demand at long-end sales.
- Spikes in the MOVE index.
- Widening credit default swaps.
- Further weak labour data after the September payrolls miss.
Weighing a contrarian forecast without betting on it
The verified facts are record yields, expanded buybacks and a compressed equity risk premium. Market management, the specific crash range and QE timing remain opinion.
A tail-risk scenario deserves risk awareness (position sizing, duration exposure, diversification) rather than a trade built on a prediction. The variables to watch through the 4 November end of the buyback window are auction results, the MOVE index and credit spreads.
Forecasts of this kind are speculative and subject to change with market developments. Past performance does not guarantee future results.
This article is for informational purposes only and should not be considered financial advice. Investors should conduct their own research and consult with financial professionals before making investment decisions.