
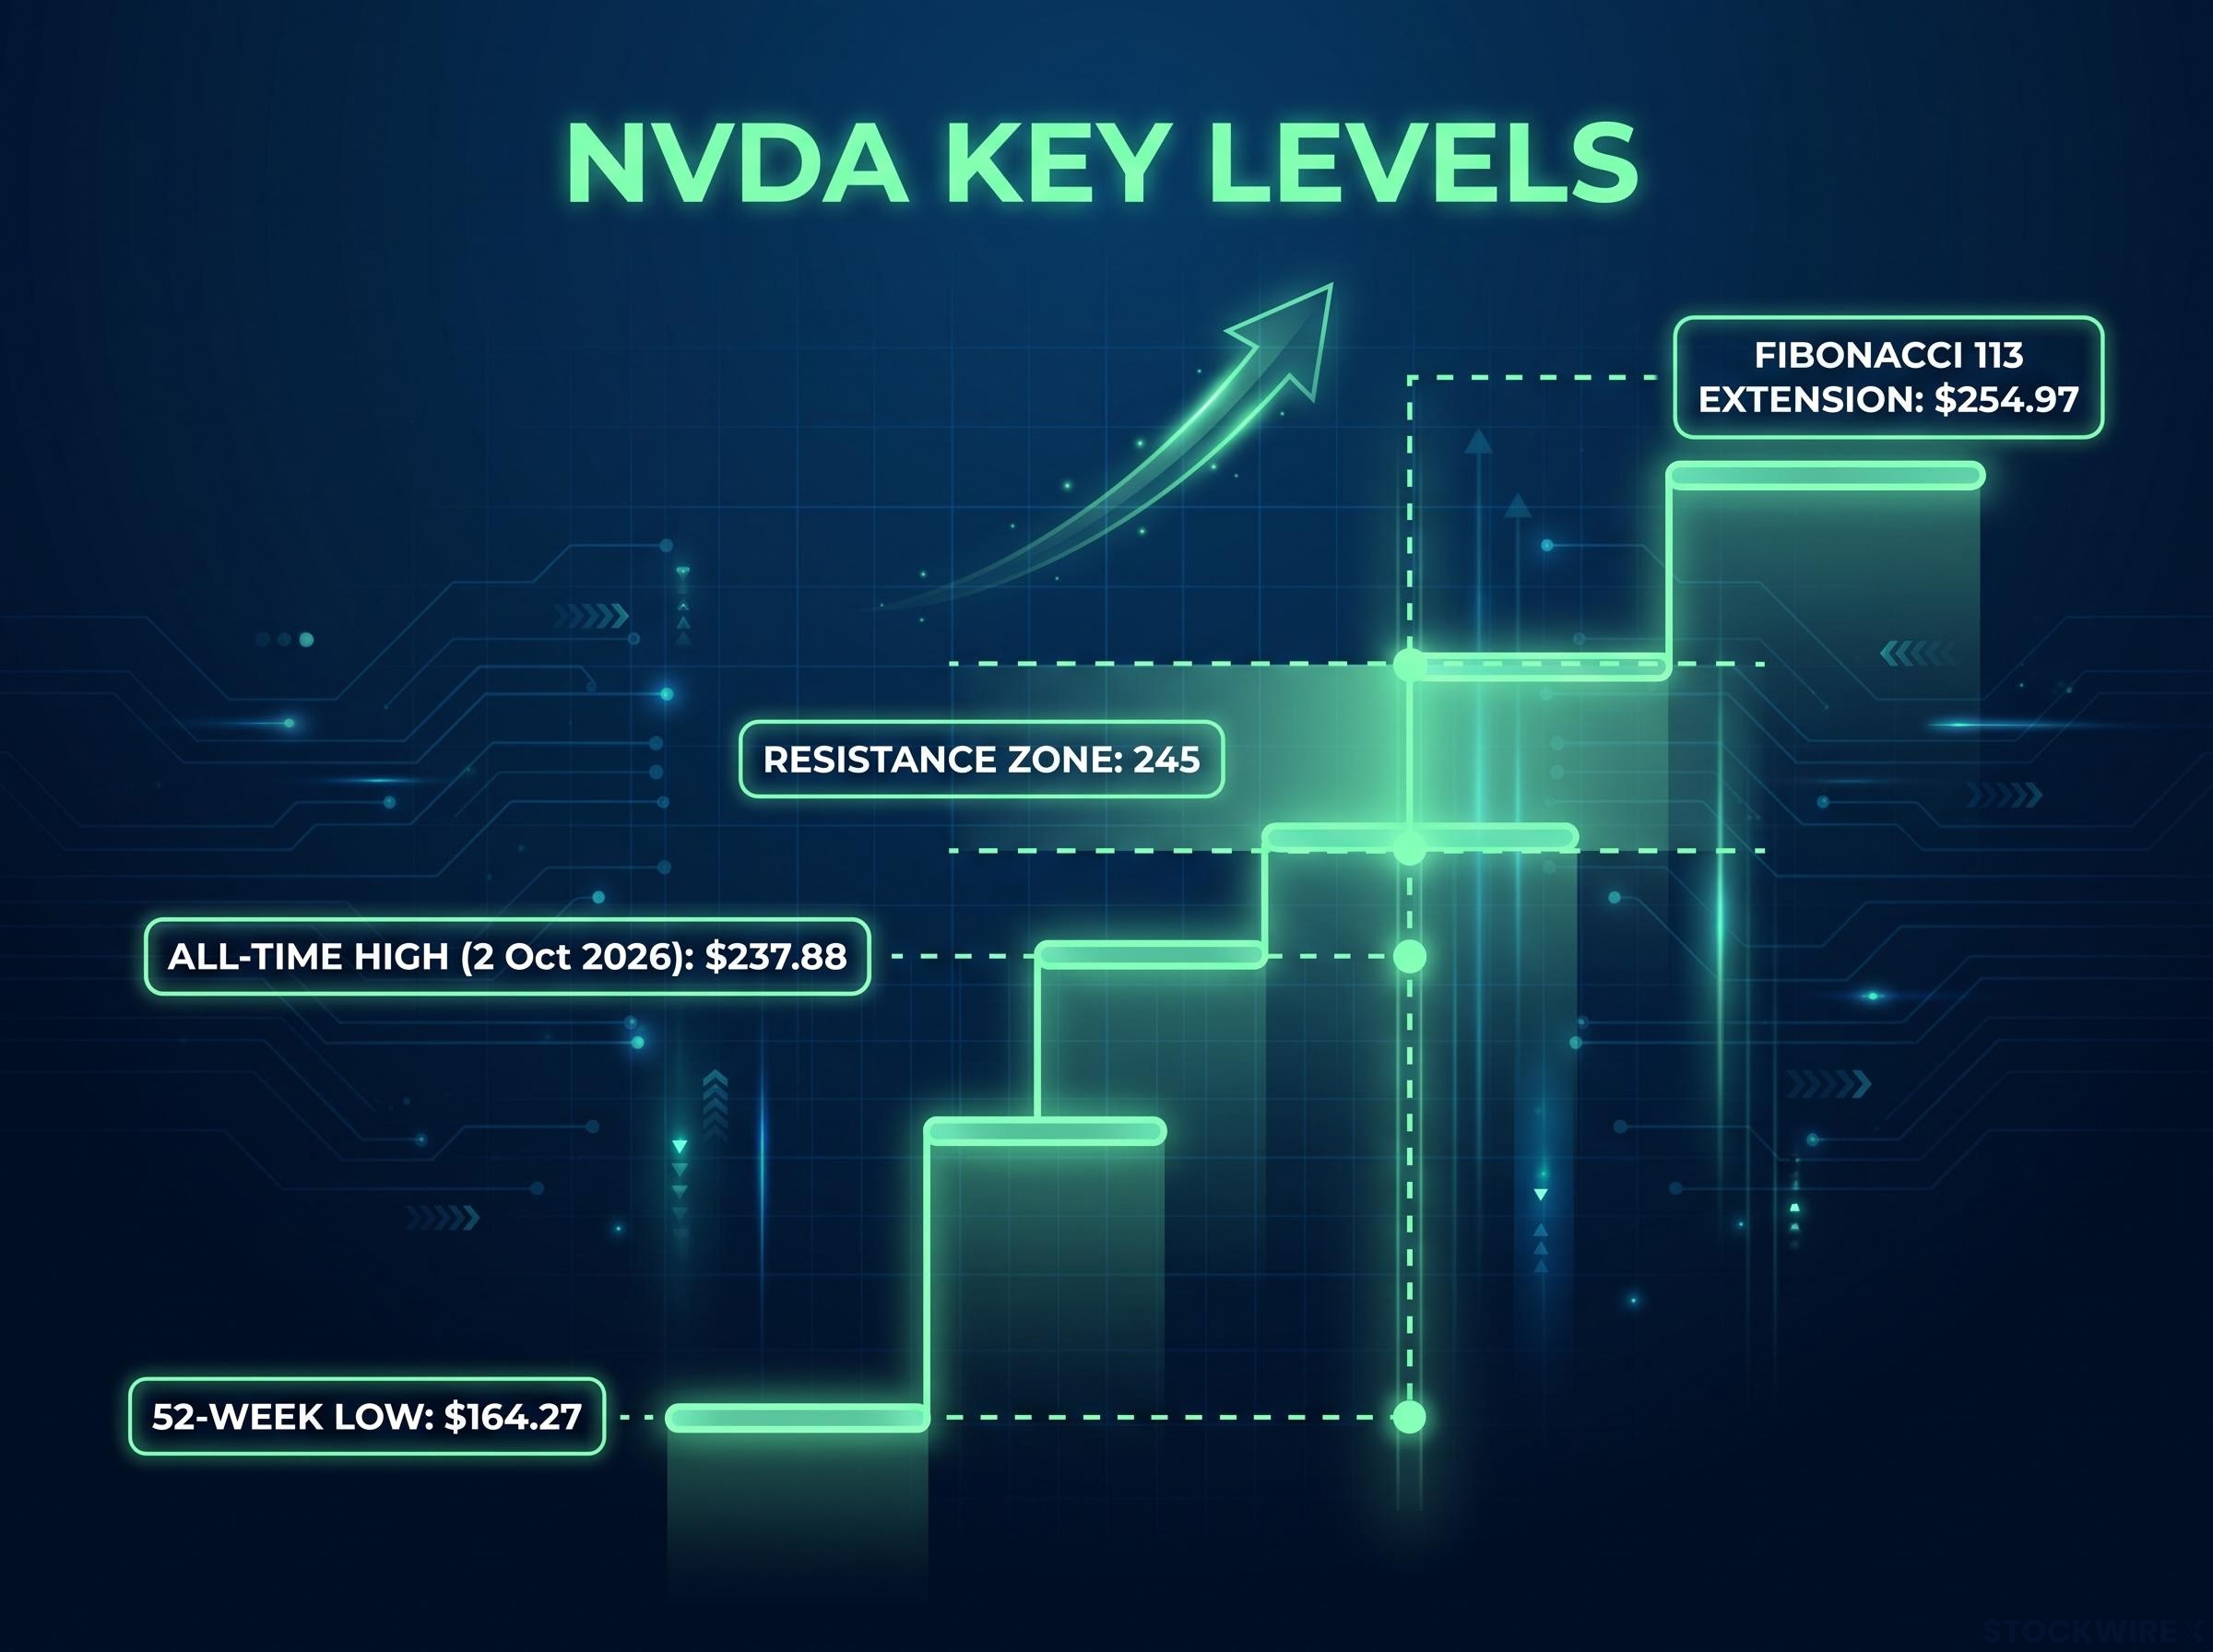
NVDA has pushed to an all-time high near $237.88, and the chart says a resistance zone sits at 245. What the chart does not say is which option to buy, how long to hold it, or how much to risk, and that gap is where most beginners get stuck.
An options chain looks like a wall of numbers, so many people skip options altogether or grab the cheapest contract on the screen. The timing makes this a useful test case: NVDA is trading in the mid-to-high $230s in early October 2026, with implied volatility (the market’s estimate of how much the stock will move) unusually low.
Here is one thesis-to-trade process, from chart levels to a specific November 20 245-strike call. It is an educational walkthrough, not a recommendation.
How do you find a resistance level worth building a trade around?
Start with what the chart shows. NVDA hit an all-time intraday high of about $237.88 on 2 October 2026 and held just beneath it with higher lows. Its 52-week range runs from roughly $164.27 to $237.88, so the stock sits at the top of it.
Resistance is a price zone where selling has tended to cap rallies. In this walkthrough, Jake Sweeney of Verified Investing leans on three tools, and each lands near the same number:
- Descending trend line: drawn from a June 2024 pivot high, it was pierced briefly in May and July before being reclaimed, and it projects to about 245.
- Parallel channel midline: the channel starts from a 29 July low, and its midline sits near 245.
- Fibonacci levels: these are ratio-based price markers. The 113 extension sits at 254.97, which becomes the secondary target.
Why confluence matters more than any single line
One line can be coincidence. When independent tools agree on one zone, the odds that the level matters rise, and you have a defined price to build a thesis around.
A resistance zone works as a supply area because profit-takers and trapped buyers both become sellers on a return to the level, and zones with three or more prior touches tend to be more reliable.
There is a catch. Widely watched levels attract crowds, and crowded anticipation can cause front-running or reversals before price even arrives.
Levels are probabilistic, not guarantees. Price can stall early, overshoot, or never reach the zone. Treat 245 as a place where the stock may pause, not a promise.
When big ASX news breaks, our subscribers know first
What does a call option actually give you, and what can go wrong?
A call option gives you the right, not the obligation, to buy 100 shares at a set price (the strike) before a set date (expiration). Standard U.S. equity contracts cover 100 shares, so one NVDA contract controls a large position for a fraction of the cost.
Hold 100 shares near $236 and you tie up about $23,600. A contract at the 245 strike costs roughly $830-$860.
The strike also defines whether an option is in or out of the money. With the stock near 236, a 235 strike is in the money, while a 240 strike is out of the money until price passes 240. Monthly options typically expire on the third Friday, and 20 November 2026 fits that pattern.
| Measure | 100 shares | One 245 call |
|---|---|---|
| Capital required | About $23,600 | Roughly $830-$860 |
| Maximum loss | The full share value if the stock went to zero | The premium paid |
| What must happen to profit | Price rises above your purchase price | Price finishes above strike plus premium (breakeven) |
Breakeven is the strike plus the premium. The stock must clear that number, not just the strike, before you make money.
A buyer needs three things to go right:
- Direction: the stock has to rise.
- Magnitude: it has to rise far enough to beat breakeven.
- Time: it has to do so before expiration.
Time decay is the cost of that last point. Every day the option loses a little time value, and the clock runs against you from the moment you buy.
You are not just betting NVDA goes up. It must rise far enough and fast enough to beat both the premium and the decay, which is why defined risk does not mean low odds of loss.
Your maximum loss as a buyer is the premium paid, but defined risk is not the same as low risk: data on retail derivatives traders shows most buyers still lose money, even when they call direction correctly.
How do you read an options chain without freezing up?
A chain splits into calls and puts, then lists expirations, strikes, bids and asks, delta, volume, and open interest. Sweeney uses Interactive Brokers, and the chain he viewed was dated 16 October, 11 days out. Only a few columns drive the decision:
- Delta: a rough measure of how much the option moves per $1 move in the stock, and a loose proxy for share exposure.
- Volume: contracts traded today, a sign of liquidity.
- Open interest: contracts currently outstanding, another liquidity check.
- Bid/ask: the prices you can sell and buy at. Tight gaps usually mean better fills.
What a zero-day call wall is telling you
The 16 October chain showed about 227,000 new zero-day contracts at the 237.5 strike and about 160,000 at 240. Zero-day options expire the same day they trade.
| Strike | New zero-day contracts | What it may signal |
|---|---|---|
| 237.5 | About 227,000 | Heavy selling interest just above the high |
| 240 | About 160,000 | A second barrier on the way to 245 |
Heavy open interest means many dealers are short calls at that strike. They hedge by selling shares as price rises and buying as it falls, which can reinforce resistance until enough volume breaks through.
For scale, Cboe reports zero-day SPX options (an index product, not NVDA) averaged 2.3 million contracts per day and about 59% of SPX volume.
One caveat: open interest is static, while hedging flows change through the day. News or large flows can override the wall.
For you, the message is that NVDA may need repeated pushes to clear 237.5 and 240, so the path to 245 may be a grind, not a straight line.
Investors exploring what heavy contract clusters really mean can use our deep-dive into reading unusual options activity, which separates institutional conviction from noise.
Why a November 20 245 call over a cheap lottery ticket?
The thesis: repeated hits on the 240 wall eventually break it, leading to price discovery toward 245, with 255 as a secondary target. That favours a strike at the resistance zone, not a distant 254 or 260 that needs a much bigger move.
Sweeney also wanted more time than the 11-day expiry. Theta, the daily decay in time value, is slower early and accelerates near expiration, so a November date gives the grind room.
| Feature | 245 call | Far out-of-the-money 260 call |
|---|---|---|
| Fit with thesis | Matches the 245 target zone | Needs a move past the secondary target |
| Probability | Better chance of finishing in the money | Lower chance of success |
| Cost | About $830 per contract | Cheaper, exact price not in the research |
The 245 call quoted at about 8.25-8.35, roughly $830 per contract (about $860 in the closing recap). Its delta of 0.426 equals exposure to roughly 43 shares, against about $23,000 for 100 shares. A delta of 0.40-0.50 is common for directional traders.
Breakeven lands near $253-$254, just under the 254.97 extension. Implied volatility was about 33.6%, with IV Rank near 10.84% on one snapshot; other snapshots ranged from 10-25% and the source cited 0%, so figures vary by provider. Low IV means you pay less for the option.
Because implied volatility drives every option price and Greek on your chain, a low reading like NVDA’s lowers the cost of entry, though it says nothing about which direction the stock will move.
The cheaper contract buys a lower chance of success, and the chosen call buys a better chance at a higher cost. Decide which you are paying for before you click buy.
Educational only, not a recommendation.
The risks that stay on the table
- Total premium loss: if NVDA finishes at or below 245, the roughly $830 is gone.
- IV crush: implied volatility can fall further after earnings. The next date is unconfirmed (about 17-18 November versus about 25 November), so it may or may not land before expiry. The latest EPS was $2.22 against a $2.09 estimate.
- Failed confluence: price can stall below 245 or never arrive.
- Poor fit: not every setup suits an options trade.
Defined risk still means the full premium can be lost.
What this walkthrough leaves you to decide
The sequence is repeatable: find the level, form the thesis, choose the contract, size the risk. It is a process, not a verdict on NVDA.
Puts come next, and whether a price is cheap, along with bid-ask spread, is left for later.
Before trading any option, you should be able to state the thesis, the breakeven, and the maximum loss in one sentence each.
This article is for informational purposes only and should not be considered financial advice. Investors should conduct their own research and consult with financial professionals before making investment decisions.