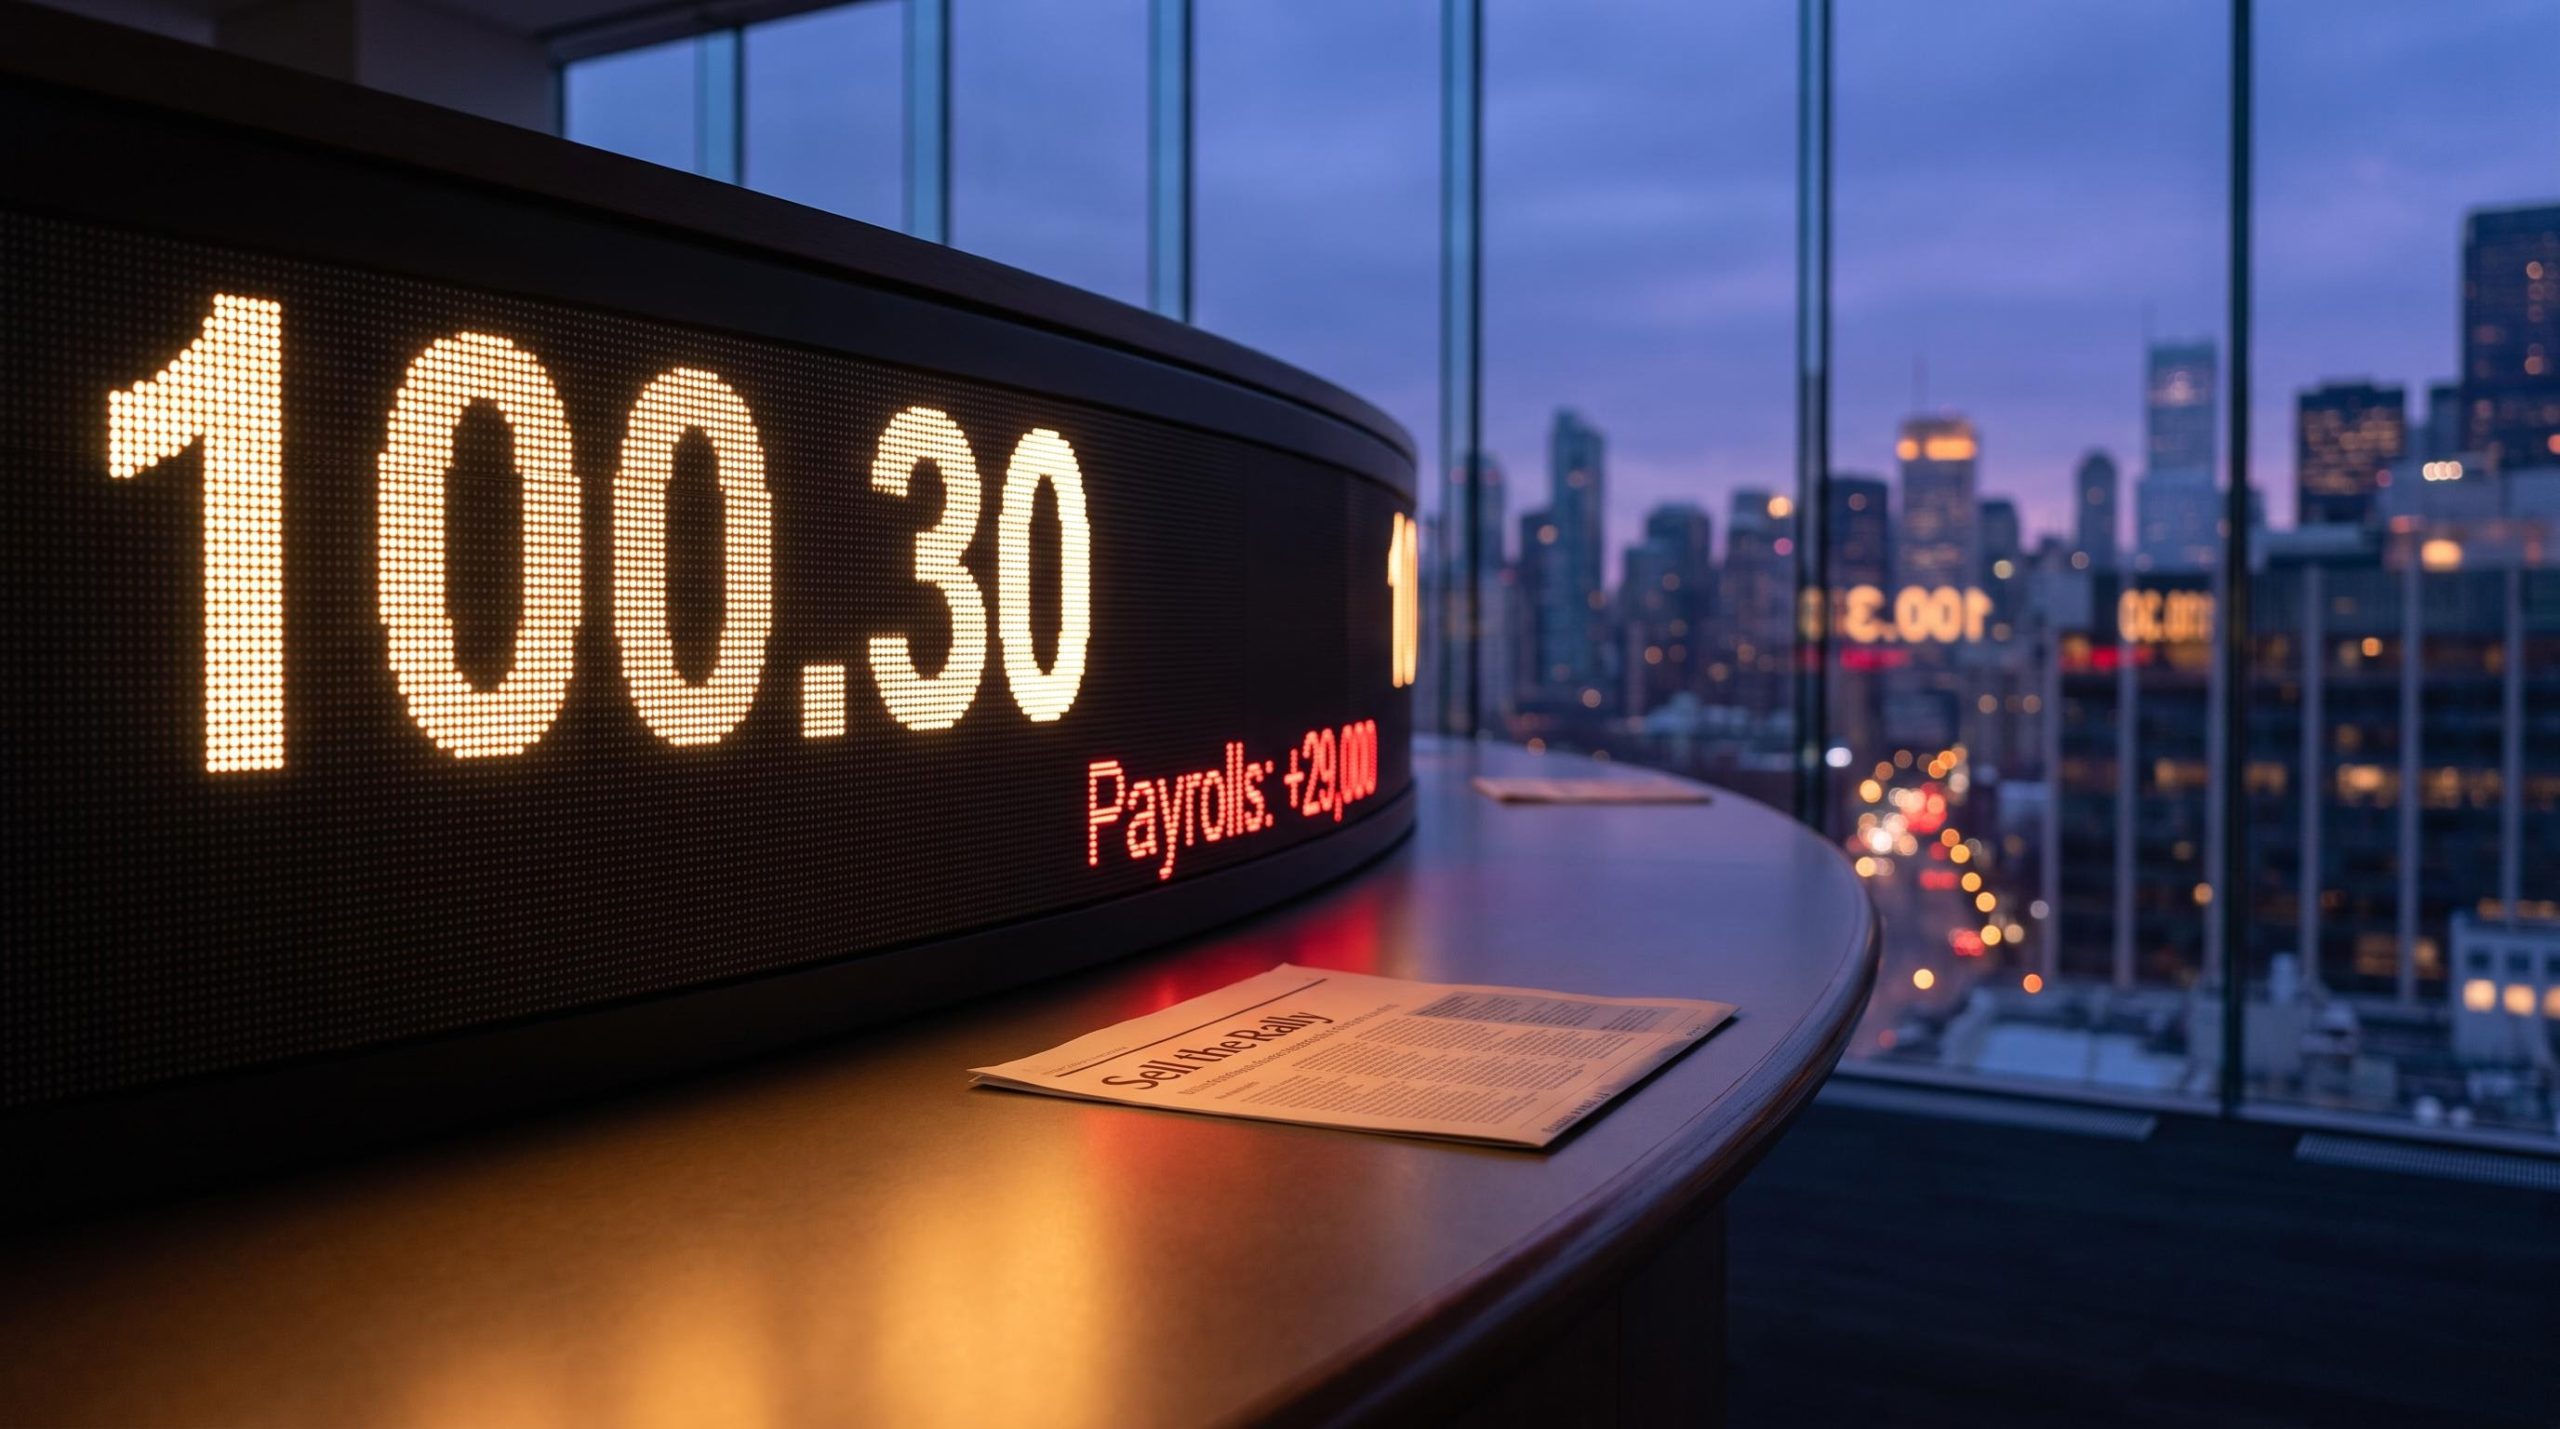
Here is a pattern seasoned currency desks recognise instantly: the moment the Federal Reserve hikes and the dollar jumps, with financial media declaring renewed strength, is often the exact point at which institutional analysts start looking to sell. That is precisely what happened when the US Dollar Index climbed to around 100.30 after the September 2026 Fed decision.
This piece is built around one concrete case: TD Securities’ research stance, formed against a Fed that had just lifted rates to 3.75%-4.00% and a labour market that added only 29,000 jobs in September 2026. The framework that explains their conviction is not a one-off trade idea. It is a repeatable analytical lens that FX desks apply across cycles.
The result is a clearer US dollar outlook than the headlines offer. What follows maps out the analytical framework behind that conviction, signal by signal, so you can understand why experienced analysts favour selling dollar rallies over chasing new highs, even when the Fed’s own guidance still sounds hawkish.
What “sell the rally” actually means in FX strategy
When the dollar rose 0.6% to roughly 100.30 on the day of the September 2026 hike, momentum traders saw confirmation to buy. TD Securities’ FX team read the same move differently: as a potential chance to reduce exposure, not add to it.
That gap in interpretation is the whole story. It comes down to a judgement about where the rate cycle sits.
“Selling rallies” is a positioning stance. It rests on the conviction that near-term upside in a currency is cyclical and capped, not the start of a new structural leg higher. Under this logic, a post-hike pop in the dollar is an exit opportunity rather than an entry.
“Chasing new highs” assumes the opposite. It implies a structural bull case: enduring US outperformance, persistently higher real yields, or lasting safe-haven demand keeping the dollar elevated for years. In that frame, every dip is a buying opportunity and each new high confirms a trend.
The distinction matters because it decides what you do with strength. Treat the rally as cyclical and you fade it. Treat it as structural and you ride it. Here is how the two logics line up:
Sell-the-rally logic
- Rate expectations are already well priced into the dollar
- Future data is more likely to erode the dollar’s advantage than extend it
- The Fed tightening cycle is mature, not beginning
- Strength is an opportunity to reduce long exposure
Chase-new-highs logic
- US outperformance is durable and structural
- Real yields will stay elevated relative to peers
- Global risk aversion keeps safe-haven demand firm
- Each new high confirms the trend rather than signalling exhaustion
TD Securities sits firmly in the first camp. The firm holds stronger conviction in selling USD rallies than pursuing new highs, judging current macro fundamentals insufficient to justify sustained moves to fresh peaks.
Cyclical ceiling vs. structural trend reversal
A cyclical ceiling occurs when the market has already fully priced the current tightening cycle. From that point, incoming data is more likely to erode the dollar’s rate advantage than extend it, which caps upside without implying a long-term bear market.
A structural reversal is a bigger claim. It requires prolonged US underperformance, sustained lower real yields versus other major economies, or a global rebalancing away from the dollar in trade and reserves.
Most 2026 commentary, TD Securities included, leans toward the cyclical ceiling reading rather than a structural reversal call. The Fed’s rate path is still hawkish and inflation remains sticky, which argues against a full trend break, but the fundamentals do not support new structural highs either.
When big ASX news breaks, our subscribers know first
How labour market data shapes the Fed ceiling thesis
Payrolls, unemployment, and wage growth are the primary inputs FX analysts use to gauge how much tightening capacity the Fed has left. The reason is direct: a hot labour market gives the Fed room to stay hawkish, while a cooling one limits it.
Watch the recent sequence rather than any single print. In August 2026, the US economy added 162,000 jobs. In September 2026, that figure dropped to just 29,000. Set against a 12-month average of roughly 45,000 per month, the deceleration is the pattern that matters.
The labour market data beneath the headline tells a more complex story: roughly 2 million Americans exited the workforce between December 2025 and August 2026, pushing participation to its lowest non-pandemic level since 1976, which means the stable unemployment rate is partly a statistical artefact of reduced job searching rather than genuine employment gains.
| Period | Nonfarm Payrolls | Unemployment Rate | Analyst Interpretation |
|---|---|---|---|
| August 2026 | +162,000 | 4.1% | Solid hiring, Fed retains tightening room |
| September 2026 | +29,000 | 4.2% | Sharp downshift, late-cycle cooling signal |
| 12-month average | ~+45,000 | n/a | Trend already softer than headline suggests |
A 29,000 print read in isolation looks weak. Read as the third data point in a decelerating trend, it does something more consequential: it shifts the analytical question from “will the Fed get more hawkish?” to “has the Fed ceiling arrived?”
That shift has direct consequences for how you hold dollar exposure. If the ceiling is in, strength becomes something to fade rather than follow.
TD Securities assessed the latest payrolls as having only a modest negative effect on the USD, and concluded that market pricing for Fed hawkishness had likely reached its ceiling. The specific configuration of the labour market is the anchor for that call.
The analytical anchor TD Securities characterises the US labour market as healthy, but neither overheating nor deteriorating. That precise middle ground limits further hawkish repricing without triggering an immediate rush to cut.
Why does that middle ground matter so much for positioning? A labour market that is still intact stops the Fed from pivoting to cuts straight away, which keeps a floor under the dollar. But one that is clearly cooling removes the fuel for fresh hawkish surprises, which caps the upside.
For you, the practical edge is this. Payrolls data is public the moment it releases. Reading the deceleration pattern rather than the single number gives you a more sophisticated sense of how institutional flows are likely to move in the hours and days after a jobs report.
Reading the Fed dot-plot: what official projections leave out
Here is the tension at the centre of the current US dollar outlook. The Fed’s own projections still point to more tightening, yet TD Securities argues the room for the dollar to rise on that tightening is nearly gone. Both can be true at once.
The dot-plot is the Fed’s forward guidance tool, a chart of where each policymaker expects rates to go. The September 2026 edition was clearly hawkish.
The Fed dot plot vs market pricing gap is where the analytical tension lives: the dots reflect each policymaker’s baseline path, while futures price a risk-weighted distribution of outcomes that already incorporates soft-data scenarios the committee has not yet acknowledged.
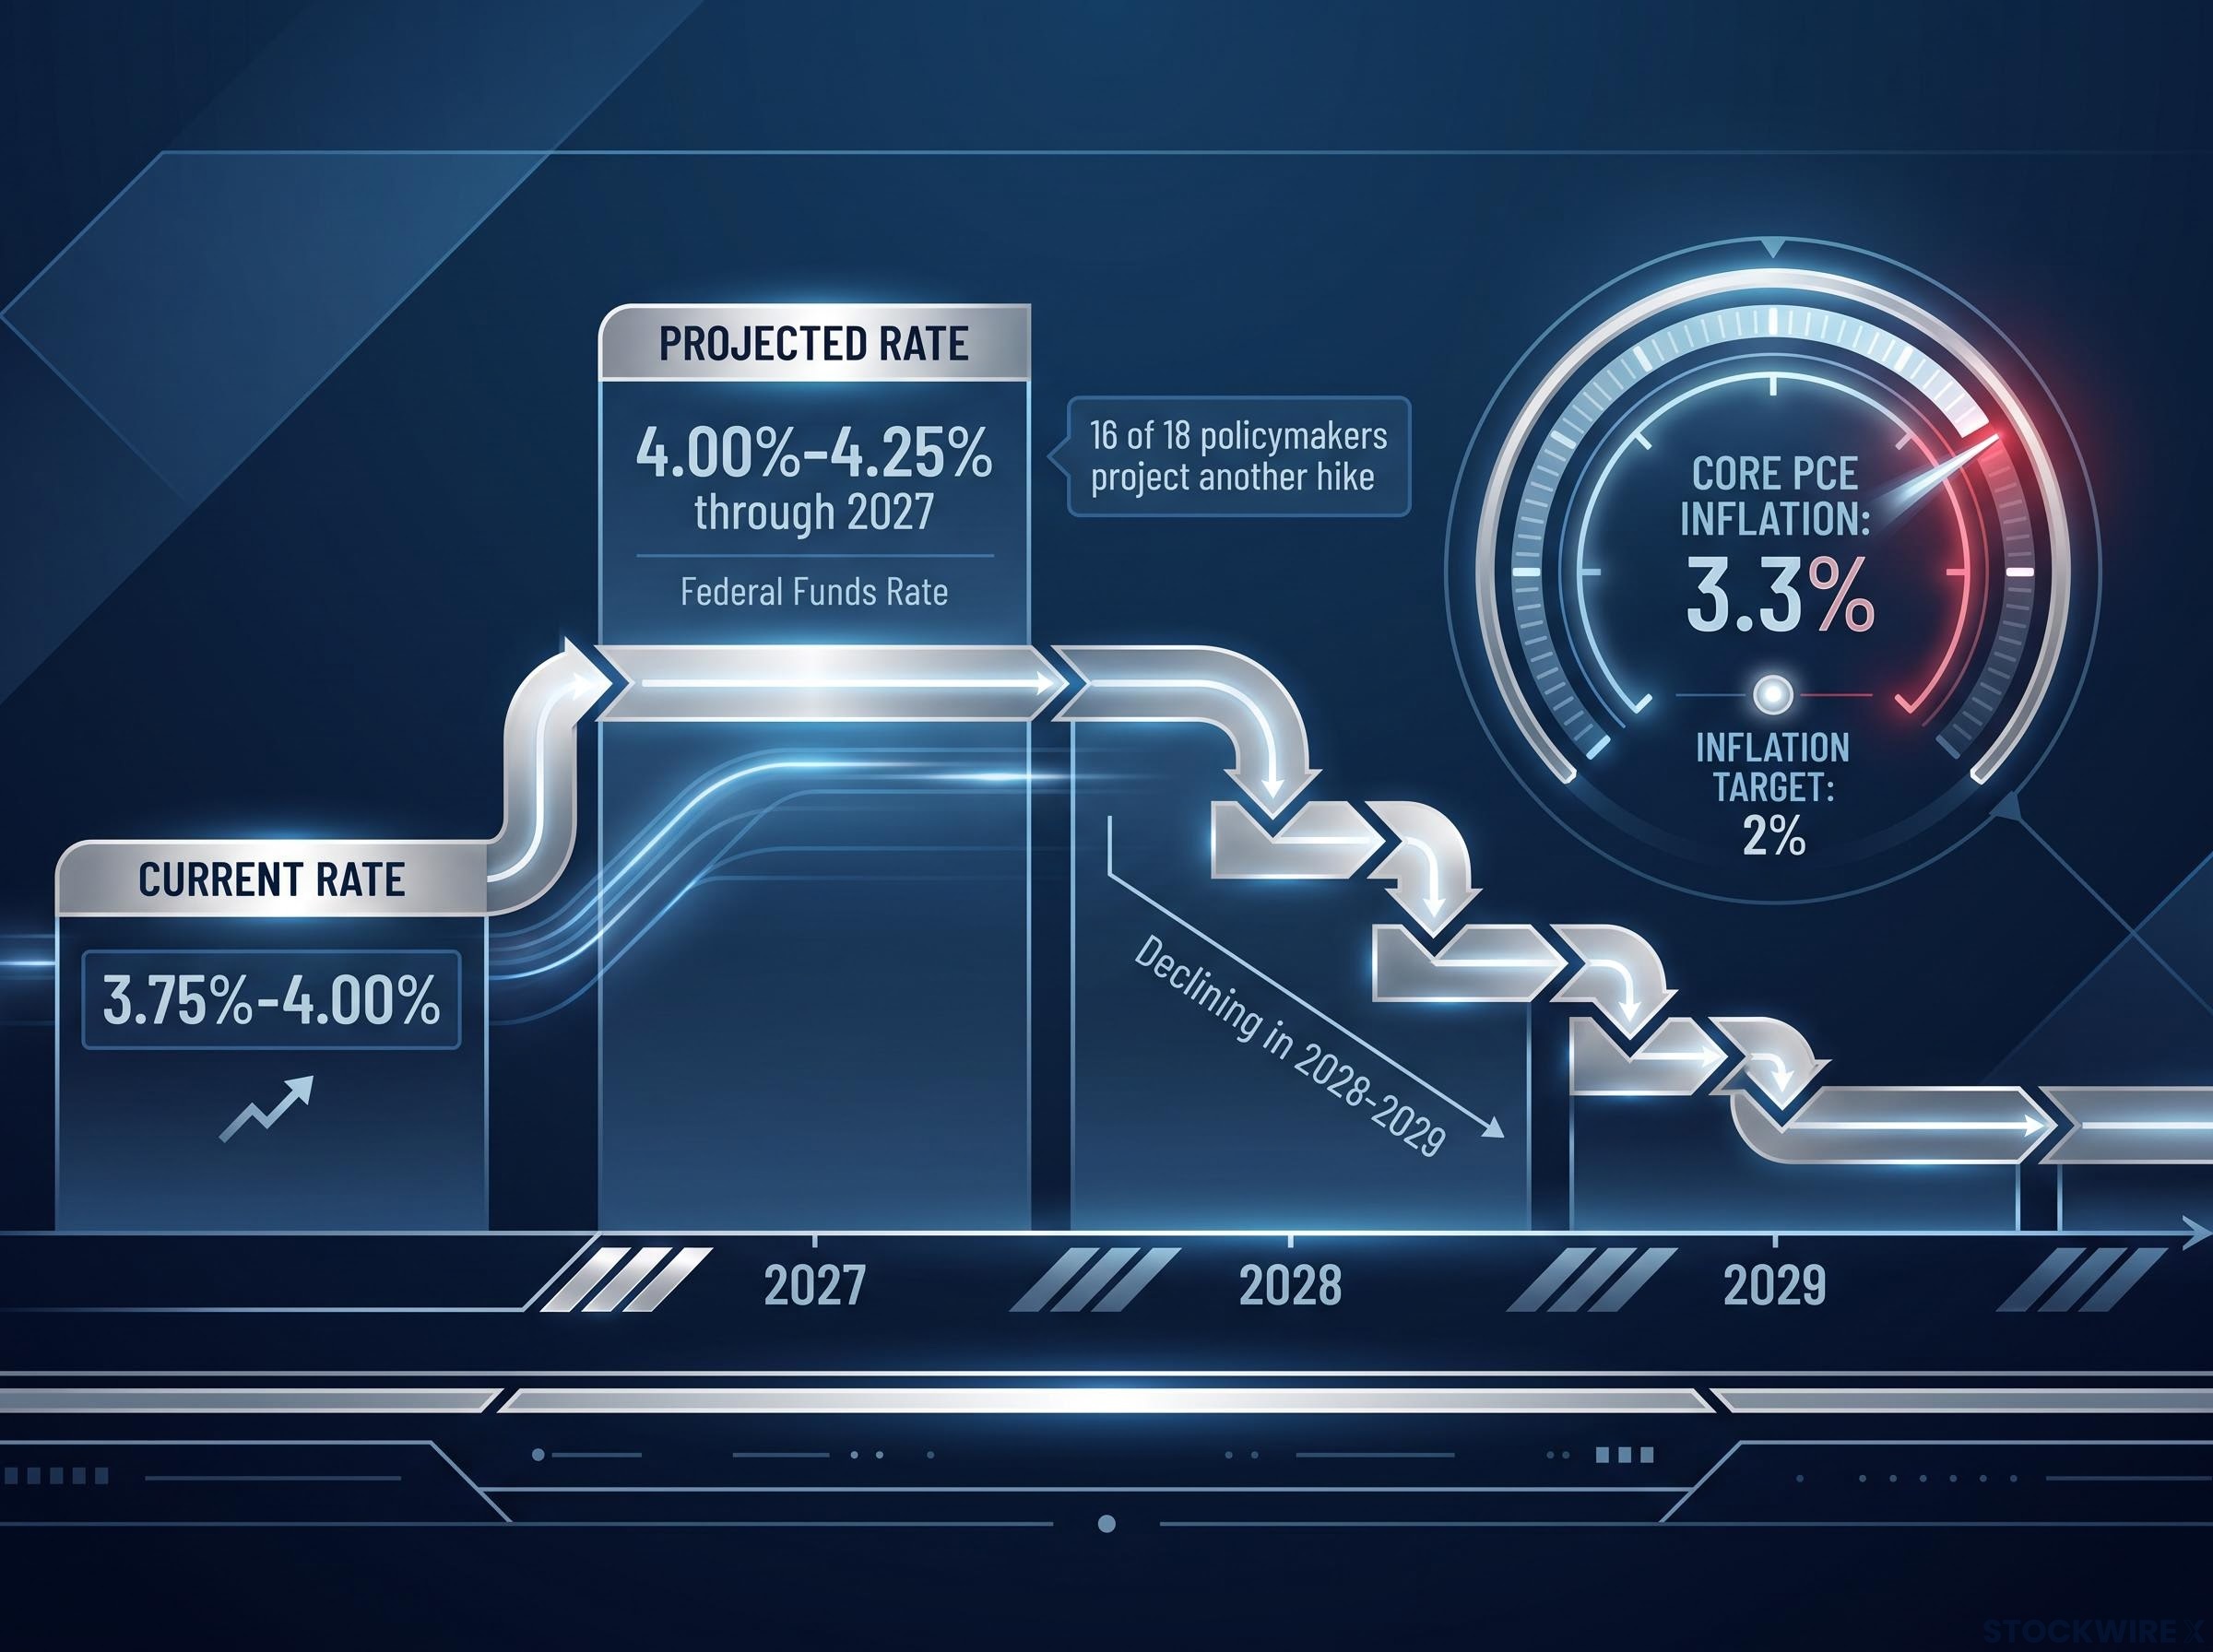
The hawkish anchor 16 of 18 policymakers projected at least one more quarter-point hike before year-end, with rates expected to reach the 4.00%-4.25% range and hold around that level through 2027 before declining in 2028-2029.
The September FOMC meeting itself raised the federal funds target range by 25 basis points to 3.75%-4.00%, the first hike in more than three years under new Chair Kevin Warsh. The policy statement emphasised a “timelier return” of inflation to the 2% target, with core PCE still running near 3.3%, well above goal.
On its face, that looks dollar-bullish. So where does the sell-rally logic come from?
The distinction is between the Fed’s projection and the market’s pricing of that projection. TD Securities is not arguing the Fed will not hike again. The firm’s argument is that markets have already priced in the additional tightening that is likely, leaving limited scope for further hawkish repricing to push the dollar materially higher.
This is the gap between institutional FX analysis and surface-level headline reading. A hawkish dot-plot only drives the dollar higher if the market can still be surprised to the hawkish side. TD Securities’ read is that the room for that surprise is largely used up, with near-term hike expectations expected to moderate across both US and European markets.
FX desks formalise this into a decision sequence:
- Identify the current rate pricing embedded in futures markets.
- Assess whether the incoming data flow can realistically shift expectations further hawkish.
- Determine whether the resulting asymmetry favours holding a long or selling into rallies.
When the answer to step two is “limited room left,” as TD Securities concludes, step three tilts toward fading strength. The key point for you is that the inflection in a dollar trend usually arrives when expectations shift from pricing more hikes to pricing cuts, not when the first actual cut lands.
Where the bearish USD view breaks down
A framework is only usable if you know what would break it. The sell-rally stance is a probabilistic conviction, not a certainty, and several credible scenarios could reinstate dollar strength.
The strongest counterargument is inflation. Core PCE sits near 3.3%, above the Fed’s 2% target, and the policy statement stressed a “timelier return” to goal. If inflation re-accelerates or simply fails to fall, the Fed may need to hike beyond its current projections, which would likely reinvigorate the dollar.
The BEA’s core PCE price index data is the Fed’s preferred inflation gauge, measuring consumer spending prices stripped of food and energy volatility, which is why a reading near 3.3% carries direct weight in the Fed’s rate path deliberations.
A second is geopolitics. Coverage around the September decision referenced an energy shock tied to the US-Israeli conflict with Iran. A sharp escalation could trigger flight-to-safety flows into the dollar and Treasuries, overpowering an otherwise bearish rate-cycle story.
A third is the AI capital spending tailwind, which deserves genuine weight. The Fed cited strong capital investment linked to the AI boom as a source of US economic resilience. If that resilience sustains US yield and growth advantages for longer than a standard late-cycle read assumes, the dollar could hold its edge even without new hikes.
Reuters also noted investors were “edgy” about the cumulative impact of higher borrowing costs after the hike. Risk-off episodes, including sharp equity pullbacks, remain a live mechanism that tends to support the dollar as investors reach for liquidity and safety.
Here are the four scenarios that could invalidate the bearish view, each with its own trigger:
- Inflation re-acceleration: watch core PCE prints above the current ~3.3% level, which would force the Fed past its projected path.
- Geopolitical safe-haven spike: watch for escalation in the Iran energy conflict driving flows into the dollar and Treasuries.
- Global relative weakness: watch for weaker growth or political shocks abroad making the USD the “least bad” option.
- AI-driven US outperformance: watch capital spending and productivity data that extend the US yield and growth advantage.
Importantly, TD Securities’ own framework is conditional. Its view that fundamentals do not support a return to peak safe-haven demand is contingent on geopolitical stability holding, not a permanent structural call.
The signals that would change the framework
For inflation, a single hot core PCE print above the recent trend would start the reassessment; two in a row would likely flip the stance from selling rallies to buying dips. For geopolitics, a confirmed escalation in the Iran energy conflict is the trigger to treat dollar strength as durable rather than fadeable.
For global dynamics, clear evidence of faster US growth or productivity relative to peers would undercut the cyclical ceiling thesis. The discipline is to hold the conviction while knowing exactly which data point would overturn it.
What this framework tells you about reading the next jobs report
History offers a clear lesson here. Major dollar turning points have aligned more closely with shifts in rate expectations than with actual Fed policy moves, and labour data is the primary input driving those shifts.
In the 2013-2015 run-up to the Fed’s first post-crisis hikes, the dollar appreciated as markets anticipated tightening, then flattened once the peak rate came into view. The same pattern recurred through the post-2008 recovery and the post-pandemic tightening phase.
The September 2026 payrolls deceleration fits that late-cycle profile. A drop from 162,000 in August to 29,000 in September, against a 12-month average near 45,000, is exactly the softening that has historically supported sell-rally positioning over chasing new highs.
The payrolls deceleration trend did not begin in September: June 2026 delivered just 57,000 jobs against a 114,000 consensus forecast, roughly half expectations, with downward revisions of 74,000 across April and May confirming the spring labour market was consistently softer than real-time data suggested.
This reframes how you read the next report. The dollar’s trajectory turns on expectations, not events, which means a jobs print matters less for whether it is “good” or “bad” and more for where it moves the Fed ceiling.
The question to carry forward When the next payrolls print lands, the question is not whether the number was strong or weak. It is whether the print moves the market closer to or further from pricing another hike, and what that means for dollar positioning.
A practical way to hold this:
- Note where futures price the next Fed move before the report.
- Ask whether the print pushes expectations more hawkish or more dovish.
- Decide whether that shift supports fading dollar strength or buying dips.
Read this way, every future jobs report stops being market noise and becomes a signal about where the ceiling sits. That is the same interpretive logic institutional desks apply.
Where the USD outlook goes from here, and how to hold the framework
The tension this piece has held throughout is the one worth keeping. Official Fed projections remain hawkish, with 16 of 18 policymakers favouring another hike and rates projected at 4.00%-4.25% through 2027. Yet the market-pricing logic suggests the ceiling on further hawkish repricing is close, which makes selling dollar rallies more defensible than chasing new highs.
This article is for informational purposes only and should not be considered financial advice. Investors should conduct their own research and consult with financial professionals before making investment decisions.
Hold the framework as probabilistic, not predictive. The risks are real: inflation near 3.3% could persist, the Iran energy shock could escalate, and AI-driven capital spending could extend US outperformance. The DXY near 100.30 post-hike and the payrolls slide to 29,000 are anchors, not guarantees.
The releases that matter most from here are payrolls, for reassessing where the Fed ceiling sits, and core PCE, for the inflation trajectory. You now have the interpretive language to read both through an institutional lens rather than reacting to headlines.
That is the durable takeaway. The next time the dollar rallies on a hawkish headline, you can interrogate it with a specific question, whether the move can still be surprised higher, rather than defaulting to momentum.
For readers wanting to apply a structured technical layer alongside the macro framework above, our dedicated guide to reading dollar rally signals walks through the three-layer approach of structural dominance, Fed policy cycles, and RSI divergence that separates a valid continuation from a genuine exhaustion signal.
Past performance does not guarantee future results. Financial projections and forward-looking assessments are speculative and subject to market conditions, geopolitical developments, and various risk factors.