Monetary policy is supposed to be the most predictable thing in markets. The Federal Reserve telegraphs its moves for weeks, bond traders settle into consensus, and the actual decision becomes a formality. That is the theory.
In the week leading into the 28 October 2026 Federal Open Market Committee meeting, the theory broke down completely.
Just weeks ago, Fed officials and the bond market appeared aligned around the same number: two more rate increases before the year closed. That agreement, forged at the September gathering, has since dissolved. A run of softening economic data has reversed market pricing so fast that Fed rate hike expectations now point toward an October pause, not a hike, even as the odds of a December move sit near certainty.
This analysis gives you a framework for reading that reversal. You will see exactly how fast institutional conviction shifted, understand the market mechanics that translate data into probability percentages, trace the economic cracks driving the repricing, and work through the portfolio trade-offs a late-cycle plateau forces on you.
Tracing the sudden collapse in market-implied odds
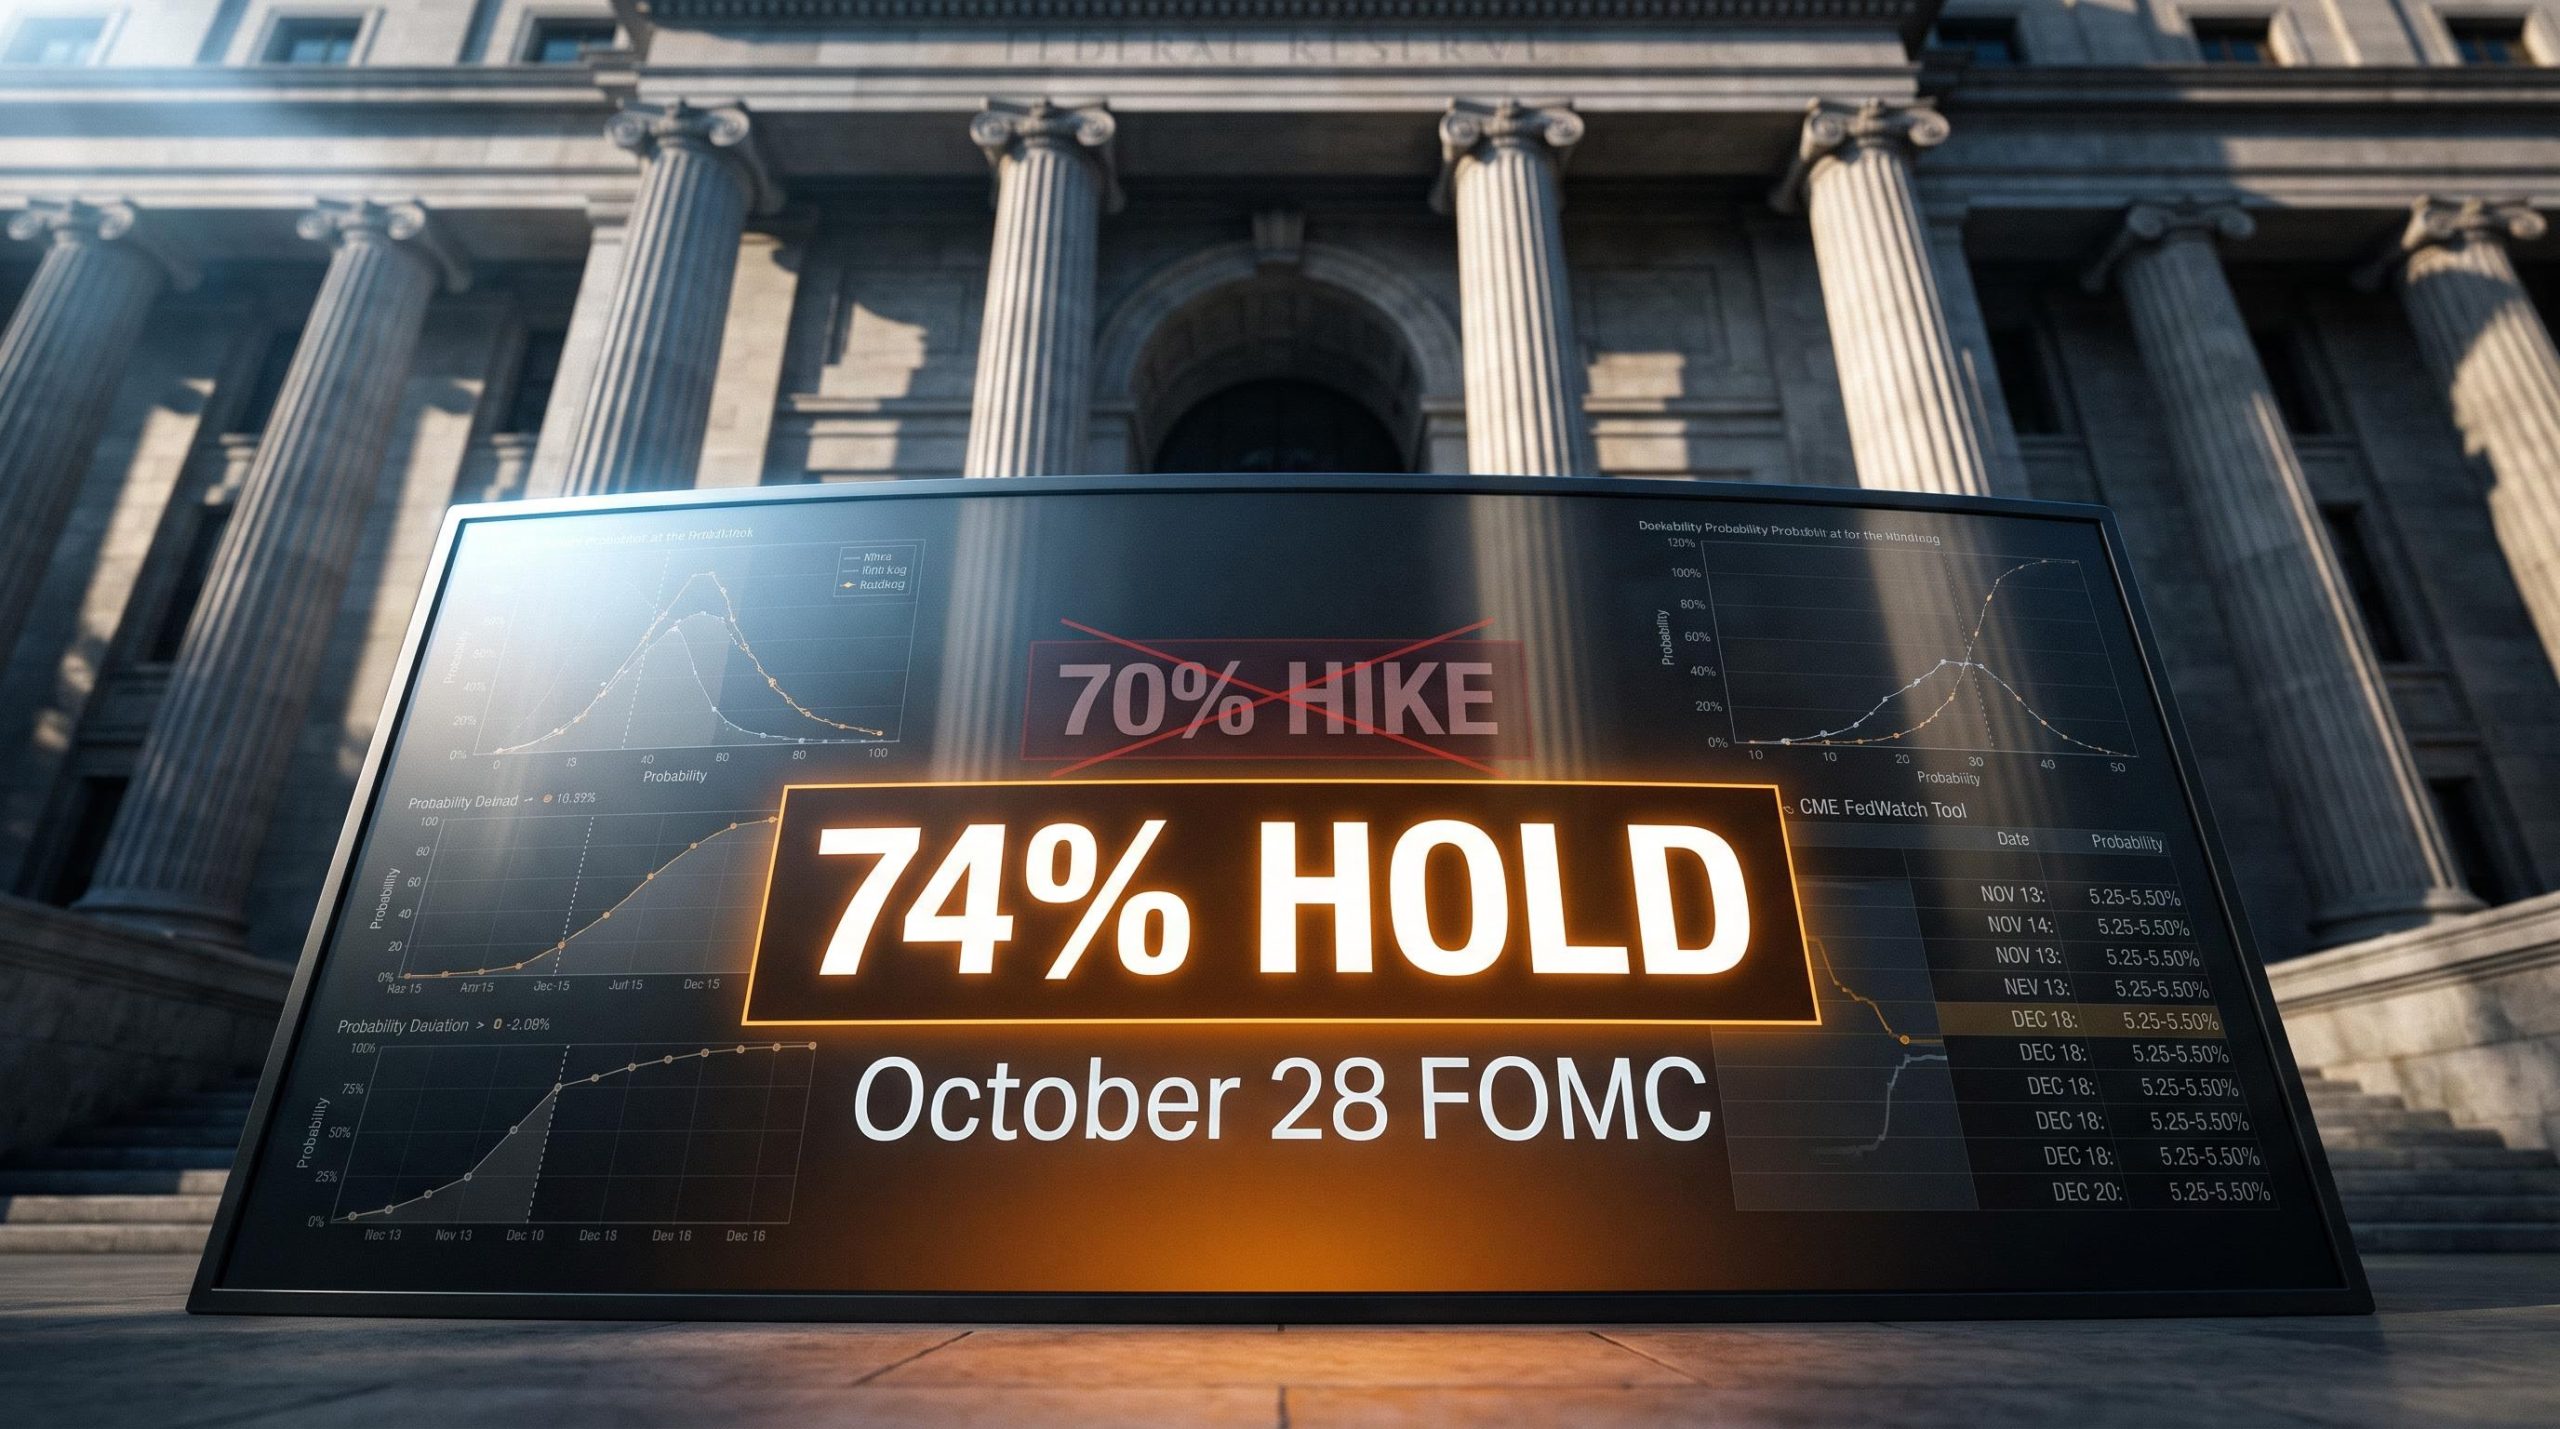
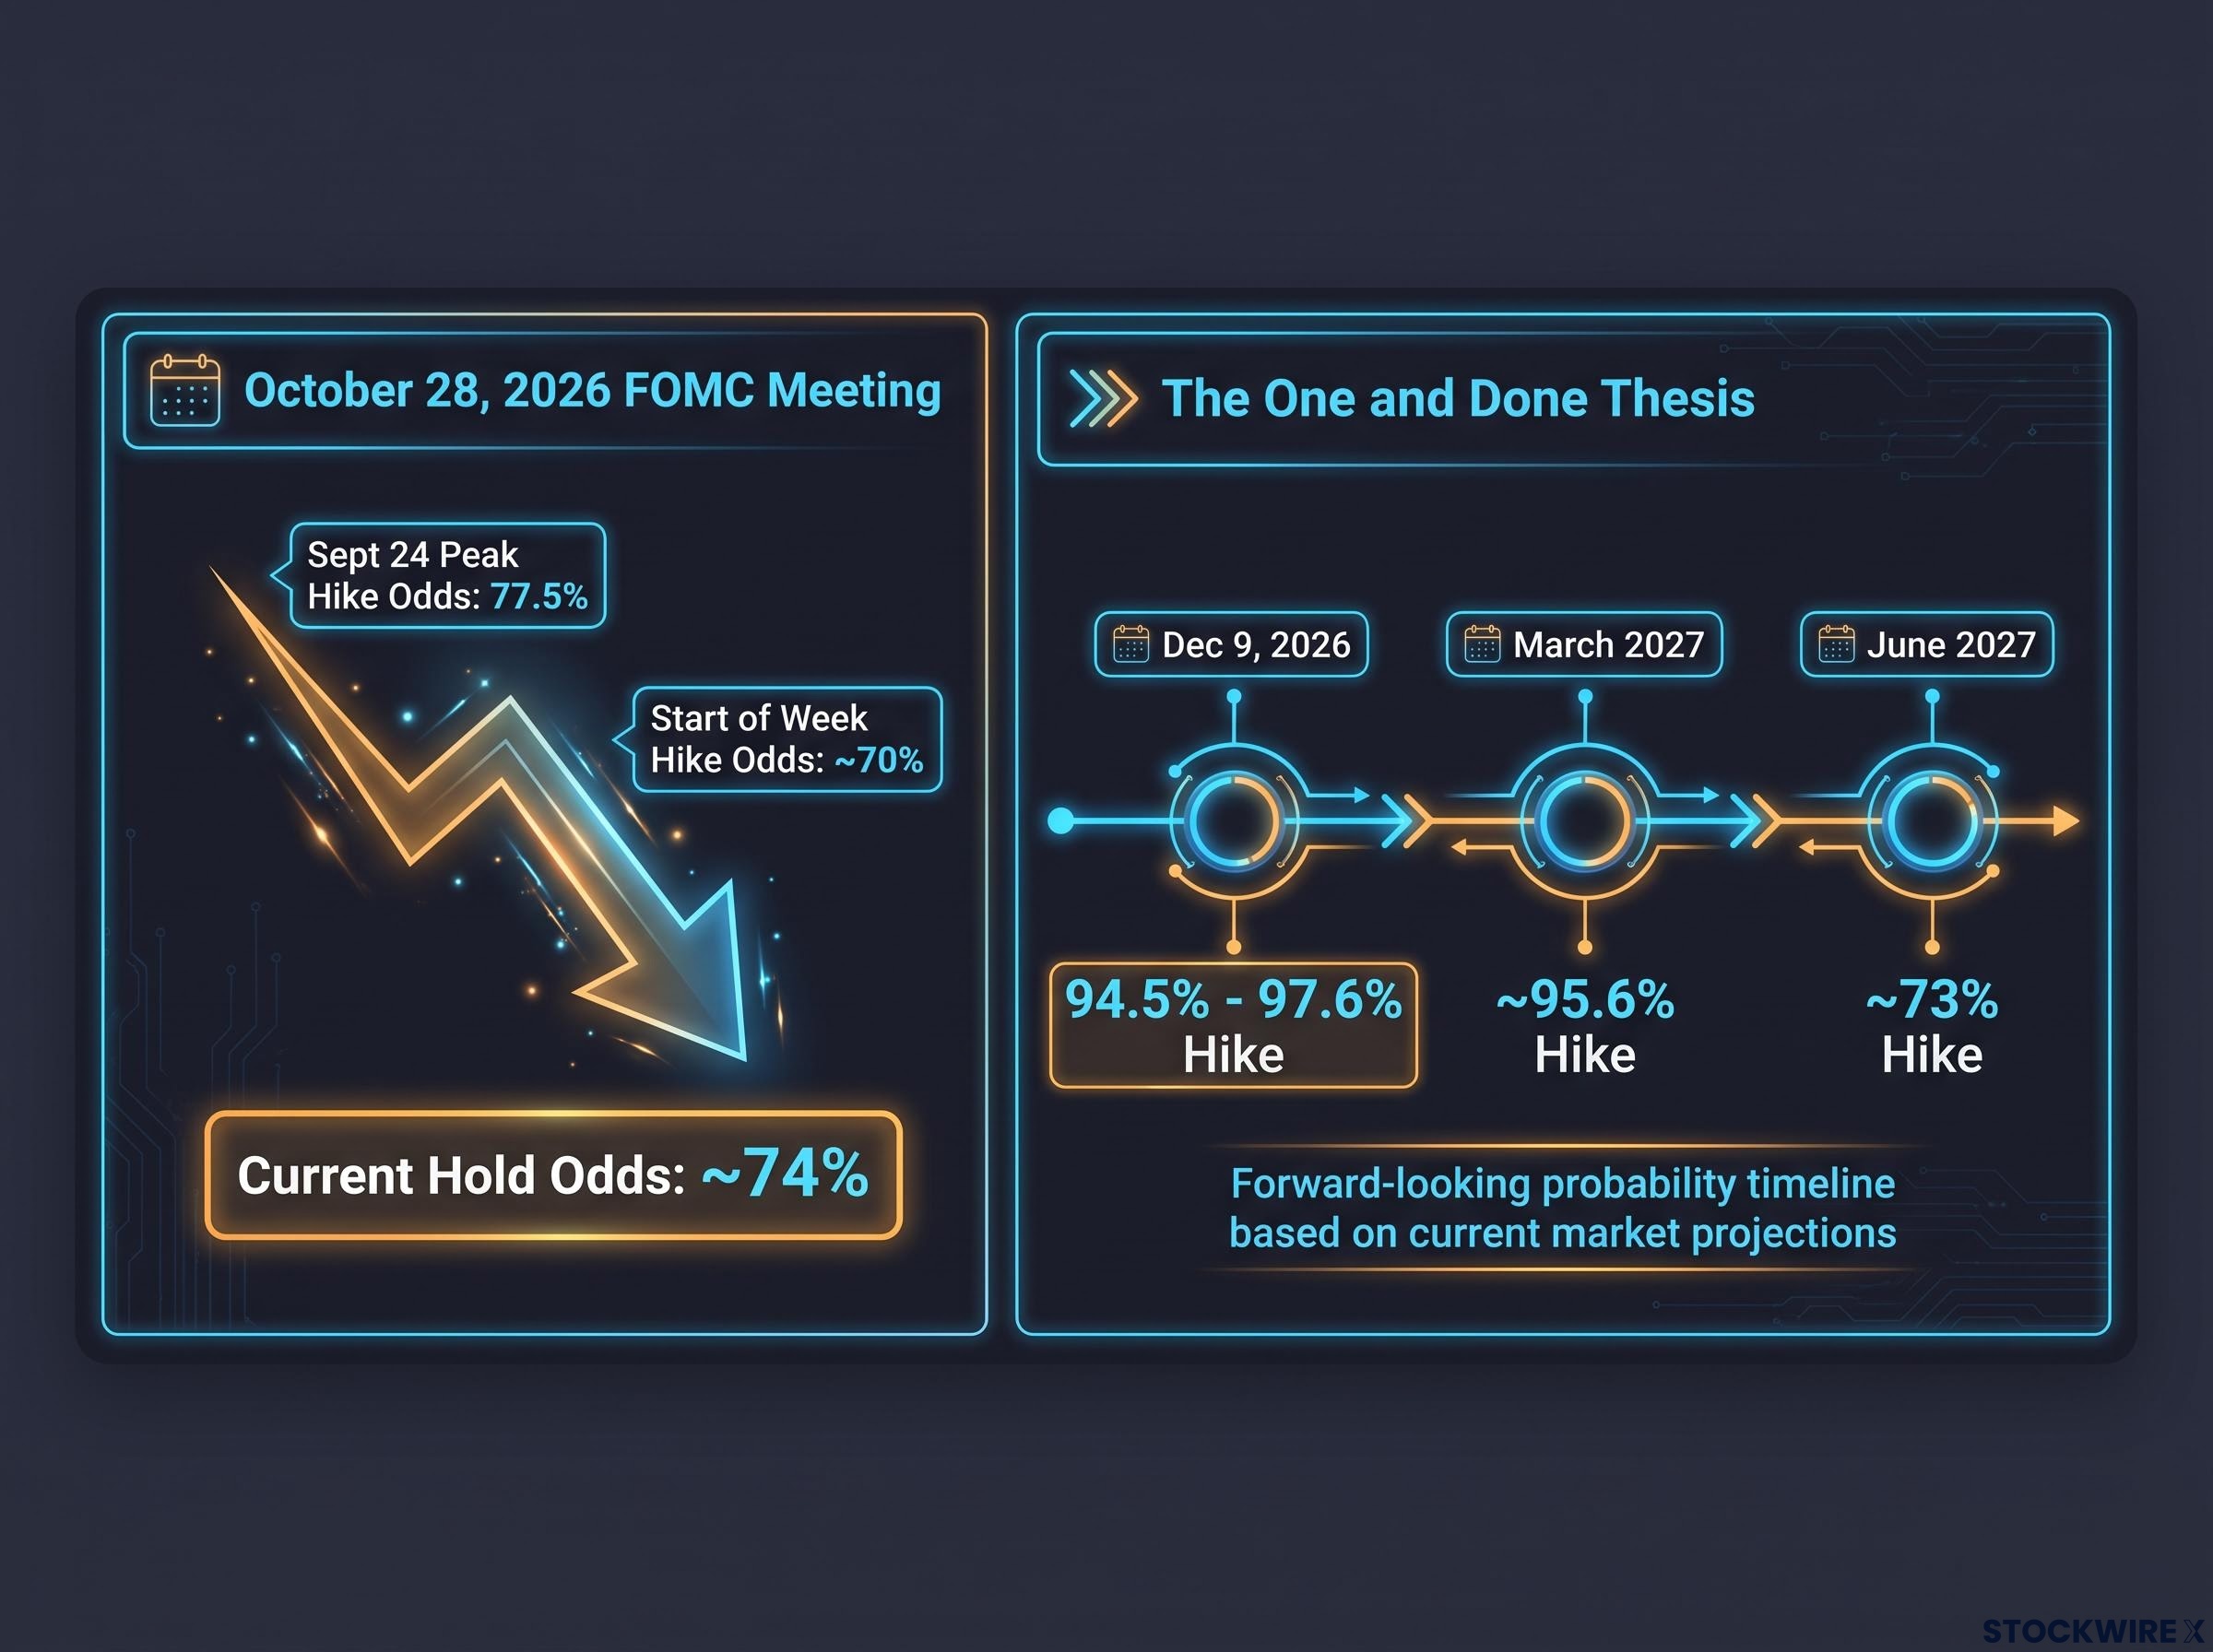
The whiplash is the story here. At the start of the week, the market leaned heavily toward another increase on 28 October, with roughly a 70% probability of a hike baked into futures. By the end of that same week, the picture had flipped: a hold now carried about 74% odds.
That is a near-complete reversal of consensus inside five trading days.
The move was not gradual. October hike odds had actually peaked at 77.5% on 24 September, according to CME FedWatch data cited by CNBC and Mortgage Professional America, before collapsing as fresh data landed. A third hike that had been nearly fully priced simply evaporated from forecasts.
The September rate hike that opened this tightening leg came with market-implied odds of a follow-up October move surging from roughly 42.5% to 56.5% in a single week, which makes the subsequent collapse in those same odds by late October a sharper reversal than the raw headlines suggest.
Here is the paradox worth sitting with. Even as the market abandoned the October hike, it stayed almost completely convinced that rates will be higher by December. Depending on the source, the December hike probability sits between 94.5% (TheStreet, citing CME FedWatch) and roughly 97.6% (as reported in the Tasty Live Macro Money commentary). The market is not saying the Fed is done tightening. It is saying the Fed will wait, then move.
This is the shape of J.P. Morgan’s “one and done” thesis, as reported by TheStreet: a single final hike, followed by a prolonged plateau rather than a quarter-after-quarter climb. The pricing beyond December supports that read, with roughly 95.6% odds of a hike by March 2027 and about 73% by June 2027.
| FOMC meeting | Prior hike probability | Current pricing | Market consensus narrative |
|---|---|---|---|
| October 2026 (Oct 28) | ~70% hike (start of week); 77.5% peak (24 Sep) | ~74% hold | Pause now, reassess on data |
| December 2026 (Dec 9) | Near certain | 94.5% to 97.6% hike | The “one and done” final move |
| March 2027 | Not firmly priced | ~95.6% hike | Plateau extends, not repeats |
| June 2027 | Not firmly priced | ~73% hike | Gradual drift, low conviction |
The speed of this repricing tells you something practical: institutional conviction in the central bank’s path is unusually fragile right now. Anchoring your strategy to last week’s consensus is a mistake, because last week’s consensus did not survive the week.
When big ASX news breaks, our subscribers know first
How futures markets actually price policy shifts
Before you trust any of those percentages, it helps to know where they come from. The numbers are not forecasts handed down by the Fed. They are extracted from what traders are actually betting with real money.
The instrument behind them is the 30-Day Federal Funds futures contract. These contracts settle based on the average effective federal funds rate over a given month, which means their price moves as traders change their view on what the Fed will do. Buy or sell enough of them, and the implied rate shifts.
Traders use these contracts two ways: to hedge against a policy move that would hurt their existing positions, or to speculate directly on the outcome of a meeting. Either way, the collective positioning becomes a live readout of market expectations.
Decoding probability tools and central bank signaling
The industry standard for translating those contract prices into plain-English odds is the CME FedWatch tool. It reverse-engineers the probability of a hike, hold, or cut at each meeting from where the relevant futures contracts are trading. When you read that there is a 74% chance of a hold, that figure is derived from futures prices, not pulled from a Fed statement.
This is the critical distinction. The Fed’s own “dot plot,” the chart where officials mark their rate projections, tells you what policymakers say they expect. FedWatch tells you where capital is actually placed. The two can diverge sharply, and when they do, the gap is where the real information sits.
The dot plot vs market pricing divergence is not an abstract curiosity; it is the mechanism through which the current October-December split in rate expectations becomes investable, because the two signals are pointing in the same direction on the final destination but disagreeing sharply on the path.
Verbal guidance from officials reprices these contracts almost instantly. New York Fed President John Williams recently said it was “reasonable” to expect another hike by year-end, while stressing that the timing remained “murky” and that decisions would stay data-dependent.
That phrasing matters more than it looks. By framing the next move as optional rather than pre-committed, Williams gave the market permission to price a high chance of one more hike but a low chance of a long sequence. Futures reacted accordingly.
Mastering this concept lets you separate two things that financial headlines routinely blur: what policymakers say in press conferences, and where institutional money is actually betting. Once you can read the second, the first becomes far less confusing.
The macro indicators driving the rate reversal
Percentages do not move on their own. Something in the data cracked, and the cracks are not where the soft-landing crowd would like them to be.
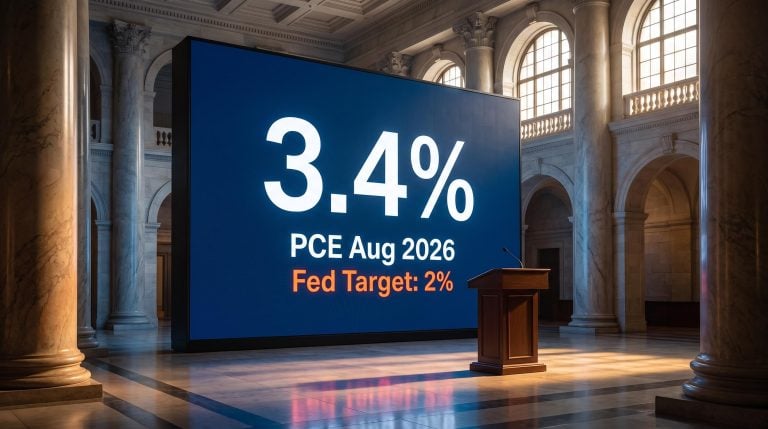
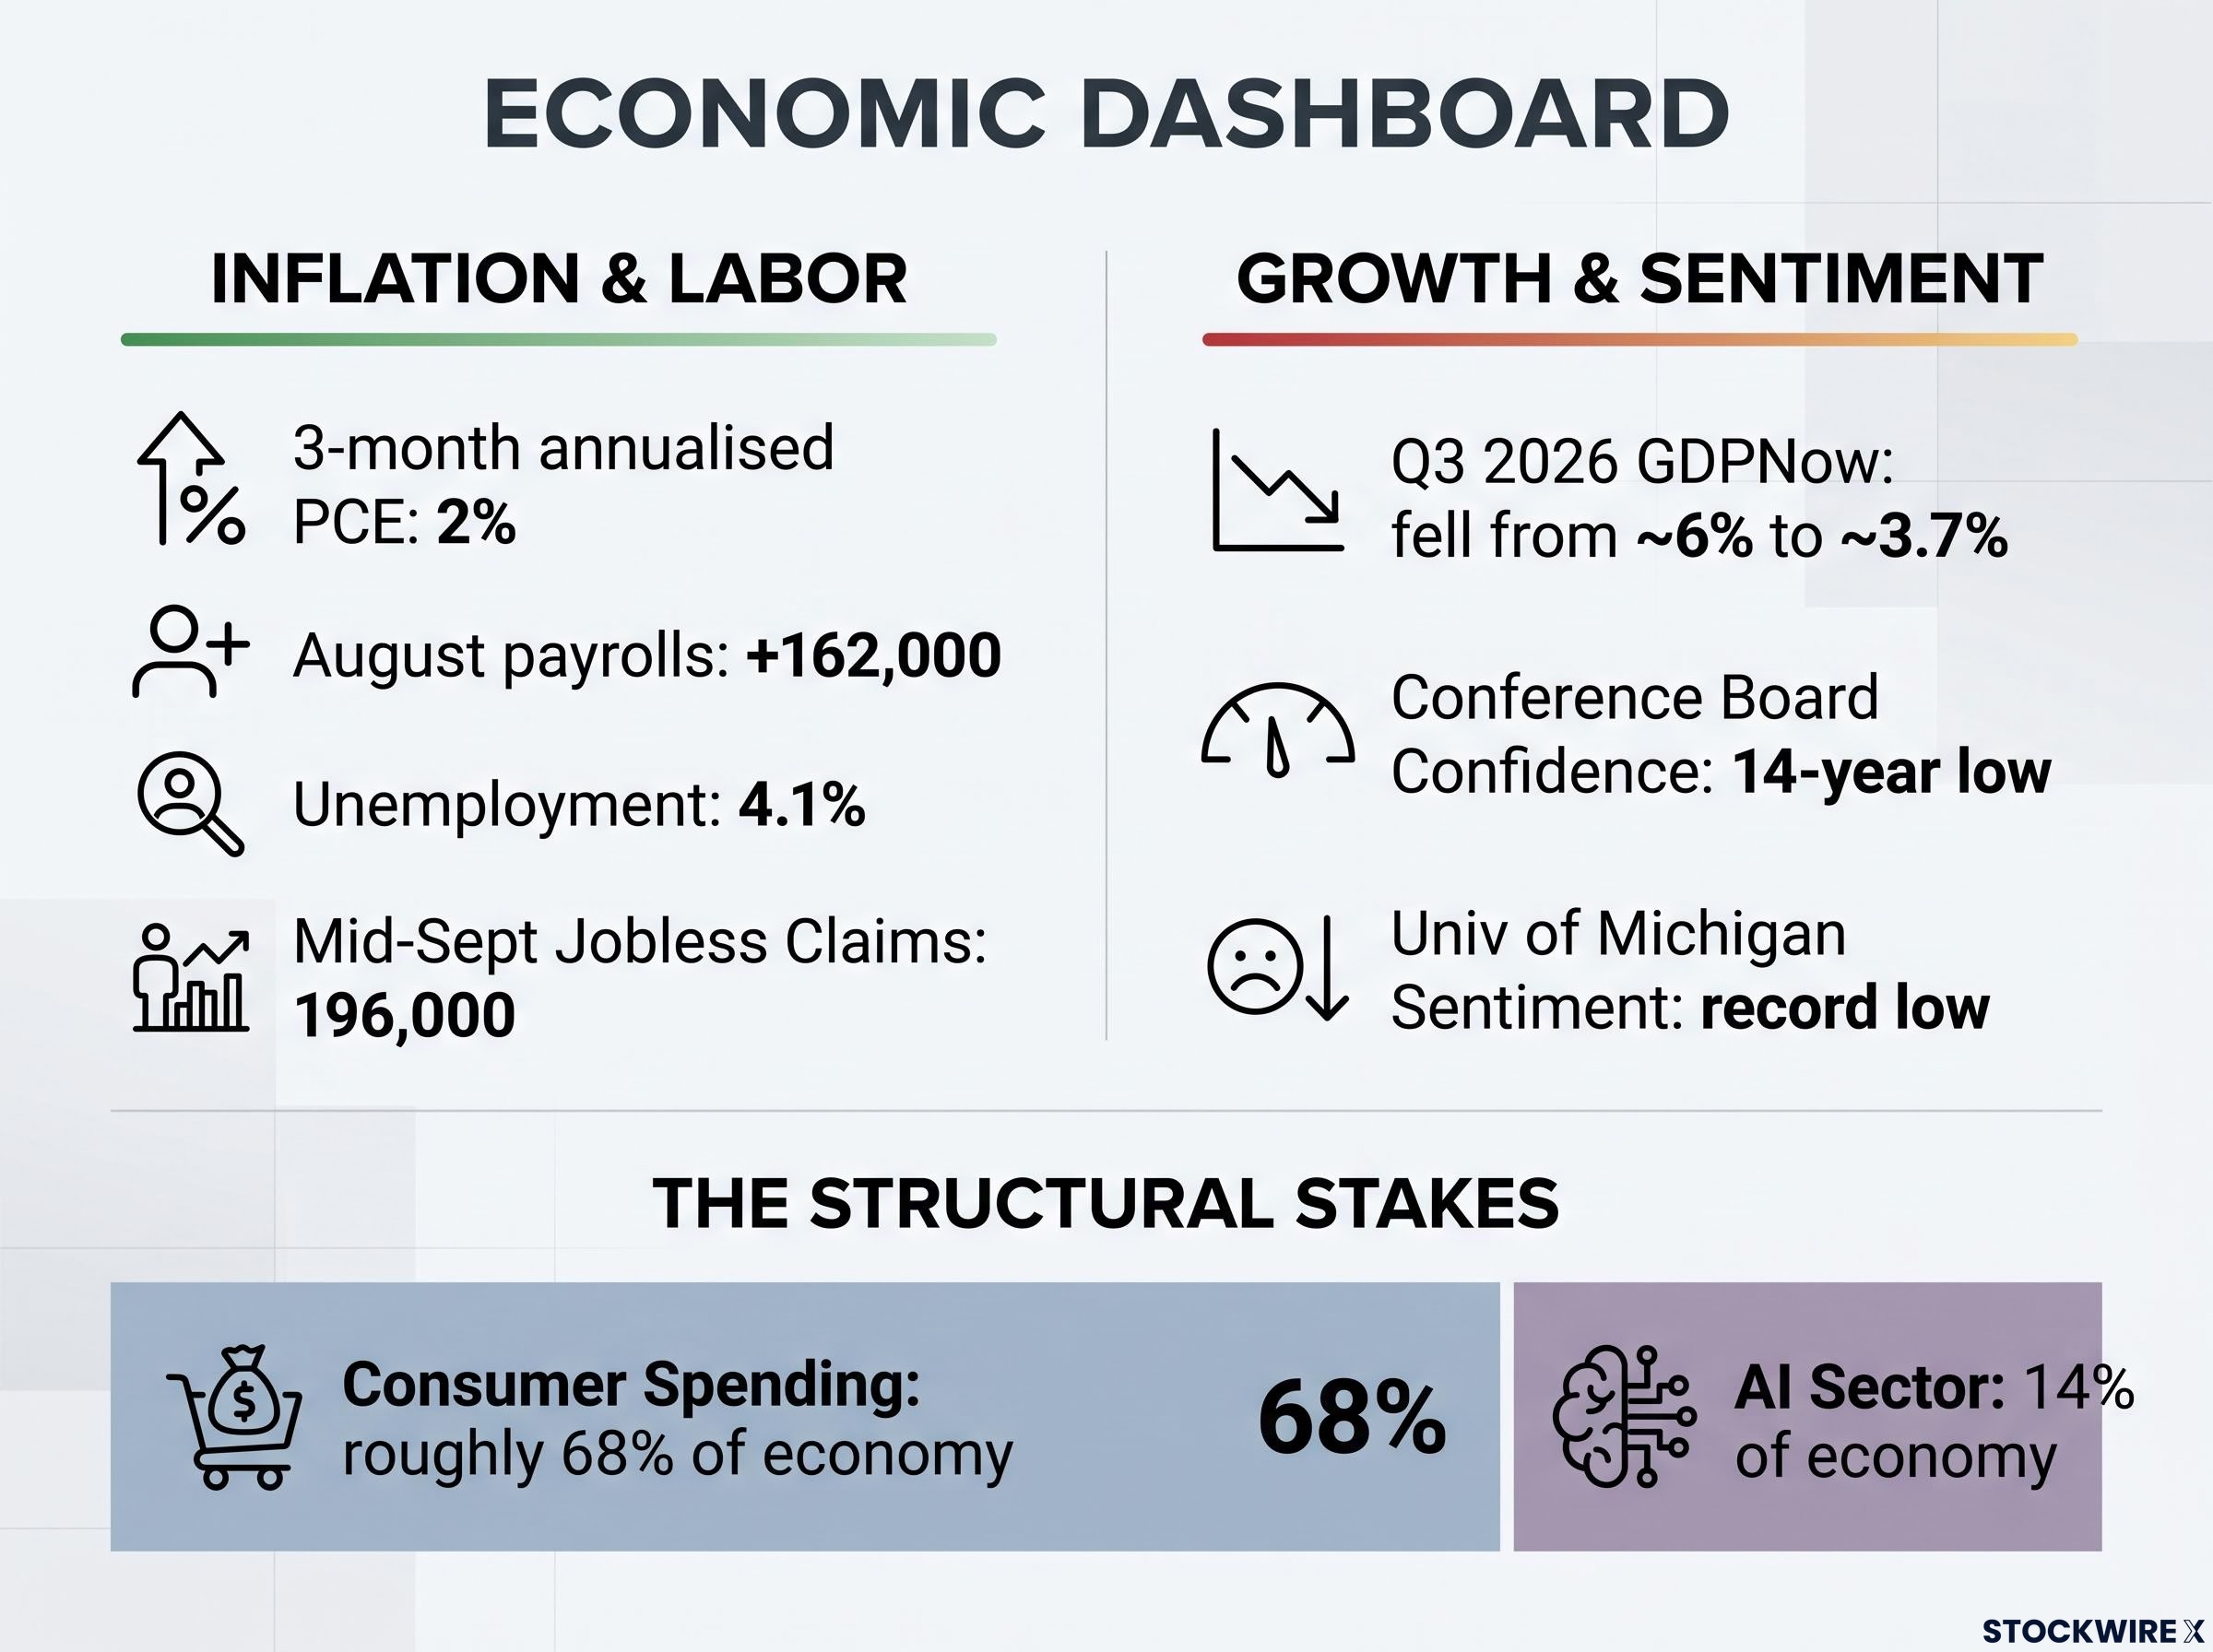
Start with the reassuring part. On inflation, the Fed appears to be winning: the 3-month annualised PCE rate has declined to the 2% objective, with the 6-month measure peaking in May and falling since June, according to the Tasty Live Macro Money commentary. On the surface, that is exactly what a successful tightening cycle looks like.
The labour market is holding, too, at least on the hard numbers. August nonfarm payrolls rose by 162,000 with unemployment steady at 4.1%, per US Labor Department data via Reuters. Initial jobless claims sat at 196,000 in mid-September, consistent with a workforce that still has jobs. The September payrolls consensus, however, has softened to between 84,000 and 90,000.
Now the uncomfortable part. The Atlanta Fed’s GDPNow tracker for Q3 2026 has been revised sharply lower, falling from around 6% toward roughly 3.7% over the forecasting window (an interim FRED reading showed 5.01% on 17 September). Growth is still positive, but the trajectory is pointing down fast.
The Atlanta Fed GDPNow tracker is a real-time running estimate built from official data releases rather than a structural model forecast, which means its sharp downward revision from roughly 6% toward 3.7% reflects actual incoming data rather than a change in modelling assumptions.
Consumer sentiment is where the real unease lives. The Conference Board Consumer Confidence index has hit a 14-year low, and the University of Michigan sentiment gauge is at a record low. Households feel worse than the payroll data suggests they should.
Consumer sentiment readings at record lows do not automatically translate into spending collapses; academic Granger-causality testing consistently shows that stock market movements lead sentiment surveys rather than the reverse, which complicates the direct causal story from a 14-year low in Conference Board confidence to an imminent GDP shock.
The structural stakes Consumer spending accounts for roughly 68% of the US economy. The AI sector, for all its headlines, is estimated at just 14%. If the consumer retrenches, there is no sector large enough to quietly offset it.
Analysts are sorting this conflicting data into three competing camps:
- The benign pivot. Inflation is beaten, growth is cooling to a sustainable pace, and the Fed is simply following through on its data-dependent promise.
- The policy mistake. The Fed has tightened into weakening demand and may have already overshot, with elevated real rates squeezing households just as confidence collapses.
- The risk-management pause. With leverage concentrated in housing, commercial real estate, and credit, the Fed holds to protect financial stability even if inflation is not perfectly tamed.
Here is why the distinction matters for your money. A central bank pausing because inflation is cured is a strongly bullish signal for risk assets. A central bank pausing because consumer demand is quietly collapsing demands a defensive posture instead. Same pause, opposite portfolio response.
Positioning your portfolio for a late-cycle plateau
The macro picture is genuinely uncertain, but the positioning question is not. It comes down to one discipline: refusing to confuse “peak rates” with “rapid cuts.”
On fixed income, the consensus among bond strategists leans toward gradually extending duration in high-quality government bonds and investment-grade credit, on the expectation that term yields stabilise or drift lower as growth slows. Duration here simply means sensitivity to interest-rate changes; longer-duration bonds gain more when rates fall and lose more when rates rise.
The danger is moving too early. An upside surprise in the October or December payrolls or inflation data could force futures to price hikes back in, triggering a sharp backup in yields and real losses for anyone already stretched into long-duration assets.
Bond market mispricing risk is not limited to the direction of the next hike; the front end of the curve carries hidden repricing exposure if the Fed delivers fewer moves than the futures strip implies, a scenario BNY strategists argued was already present in September when markets were pricing roughly 100 basis points of cumulative tightening.
The same trap sits under rate-sensitive equities. Housing-related names, utilities, and long-duration tech all benefit when the market is confident the peak is in. But those gains assume a quick easing cycle that may not arrive.
Weigh these caveats before repositioning aggressively:
- If the Fed hikes more than once more, or simply holds at restrictive levels for longer than priced, valuations built on fast cuts look too optimistic.
- If the pause reflects genuine demand weakness rather than healthy normalisation, cyclical and credit-sensitive equities face earnings downgrades even as rates stop rising.
- History warns against assuming a smooth landing. Equity drawdowns often arrived during the pause phase, as in mid-2006 and late-2018, once growth fears overtook inflation fears.
- The counter-example is the mid-1990s, when the Fed stopped hiking, held real rates moderately high, and inflation drifted down without a severe recession.
The read you should take is this. Positioning for peak rates is reasonable; positioning for rapid cuts is a bet, and if inflation proves sticky, it is a bet that exposes you to steep losses. Those are not the same trade, and the market has not yet decided which one is right.
Navigating the gap between peak rates and policy support
The core tension is simple to state and hard to resolve: the end of a tightening cycle does not guarantee a smooth landing. Peak rates and policy support are not the same thing, and history shows credit spreads and equities can weaken after the final hike as slower growth takes over the narrative.
Expect the fourth quarter of 2026 to stay volatile. Market pricing will likely swing between recession fear and soft-landing optimism as each data release lands, because the underlying question has not been answered.
The imminent September jobs report, due within roughly 24 hours of this commentary, is the tiebreaker. A firm print validates the October pause and the “one and done” plateau. A weak one reignites fears that the final hike could prove punishing. Either way, the prudent stance favours risk management over aggressive directional bets.
This article is for informational purposes only and should not be considered financial advice. Investors should conduct their own research and consult with financial professionals before making investment decisions. Past performance does not guarantee future results, and financial projections are subject to market conditions and various risk factors.