Your 60/40 portfolio has a problem, and it is not the equity side.
For decades, the deal was simple: when stocks fell, bonds rallied, and your bond allocation cushioned the blow. That relationship broke during the 2022-2023 rate shock, and the question of whether it has truly repaired itself remains open heading into a packed autumn calendar.
Here is the part most investors are missing. The VIX, Wall Street’s main fear gauge, closed at just 16.34 on 30 September 2026, sitting in the mid-teens. Downside insurance is unusually affordable right now, precisely when the calendar is stacking up binary risks: payrolls, bank earnings, a full tech reporting season, and US midterm elections.
That combination is rare. Cheap protection and rising event risk do not usually coincide.
This explainer walks you through why market protection looks mispriced right now, why your traditional safety nets may not catch you, and how to build specific, cost-controlled option structures that defend your portfolio without bleeding your cash month after month. By the time you finish, you will know how to evaluate your next defensive trade with precision rather than panic.
The mechanics behind unusually affordable downside protection
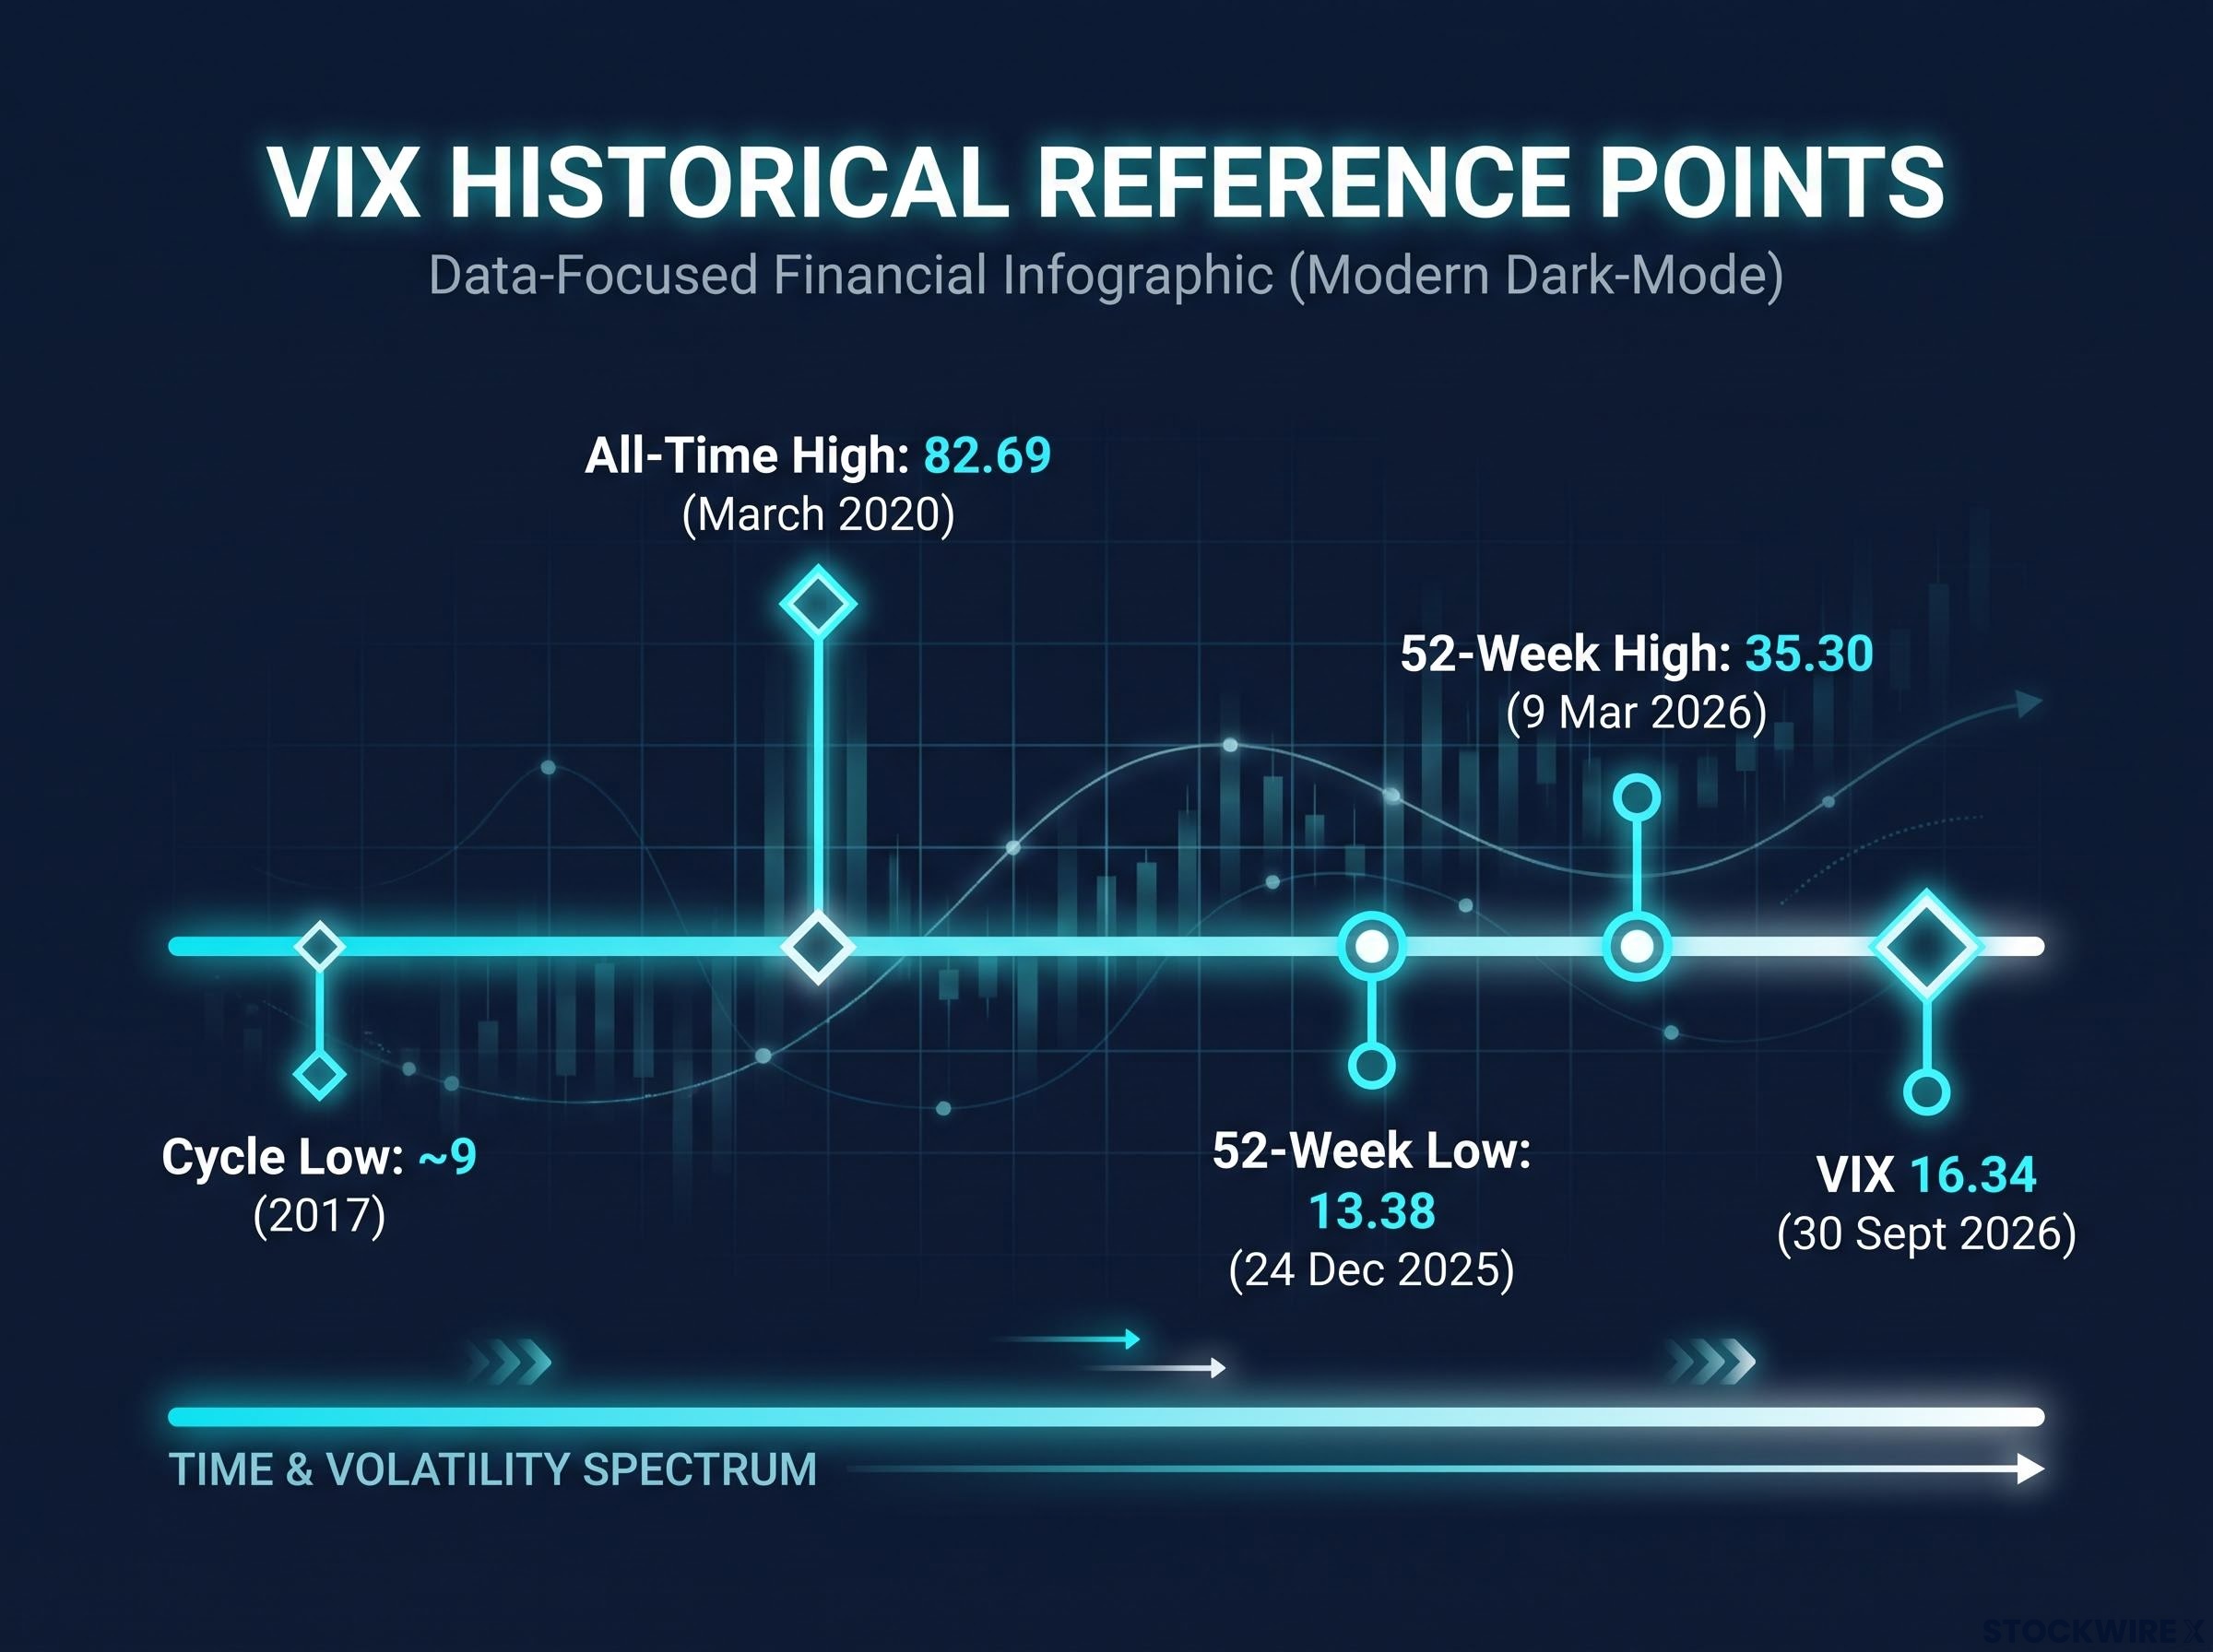
Start with the number on your screen. The VIX, which measures the market’s expectation of volatility over the next 30 days, closed at 16.34 on 30 September 2026, according to Cboe and Investing.com data.
To put that in context, the 52-week range runs from a low of 13.38 on 24 December 2025 to a high of 35.30 on 9 March 2026. The all-time record high sits at 82.69, set during the March 2020 crash.
So the VIX is subdued, but it is not scraping the floor. This is the important distinction: protection is affordable, not free, and it is well above the cycle low near 9 seen back in 2017.
Three structural forces are keeping volatility, and therefore the price of hedges, compressed.
- The explosion of zero-days-to-expiry (0DTE) options. These are contracts that expire the same day they are traded. Their surge means traders now hedge intraday around specific events rather than buying longer-dated insurance, which drains demand from the standard puts that set broader volatility pricing.
- Yield-enhancing overwriting programmes. Pension funds, insurers, and retail vehicles that systematically sell call options flood the market with volatility supply, which pushes implied volatility down.
- Behavioural complacency. Years of rapid recoveries after every shock have conditioned investors to expect rebounds, so fewer people are willing to pay for longer-dated protection that might expire worthless.
What this tells you is subtle but important. The subdued VIX means the broad market is pricing in stability, driven as much by these mechanics as by any genuine assessment of safety.
You should read this as a pricing window, not a guarantee. Options are cheap because of how the plumbing works right now, not because risk has disappeared. That gap is your tactical opportunity.
VIX futures contango, the persistent gap between the spot reading and forward contracts, is one of the structural mechanics that keeps headline volatility suppressed even when near-term event risk is building, because the curve’s upward slope signals the market is pricing a mean reversion it expects but has not yet seen.
Navigating the volatility supply glut
Dig into that second factor, because it is the one doing the most quiet work. When a pension fund sells covered calls against its equity holdings to generate income, it is effectively selling volatility into the market.
Do that at institutional scale, repeatedly, and you create a persistent glut of supply. More sellers than buyers means the price of volatility stays suppressed.
For you as a buyer, that is the gift. Equity derivatives strategists at Goldman Sachs have repeatedly flagged this overwriting dynamic as a structural source of cheap downside options, meaning the protection you want to buy is artificially discounted by someone else’s income strategy.
When big ASX news breaks, our subscribers know first
Why your traditional safety nets are failing
Now for the uncomfortable part. The reason this matters so much is that your usual fallback may not work.
The historical playbook says that when equities sell off, you rotate into government bonds and let them rally as rates fall. That logic depends entirely on stocks and bonds moving in opposite directions, and that relationship is no longer dependable.
During the 2022-2023 rate shock, stock-bond correlations turned positive. Economists at BlackRock and Vanguard have documented how equities and long-duration Treasuries fell together as inflation and rate expectations climbed.
The stock-bond correlation flipped positive during the 2022 inflation shock and has not reliably reverted: UBS research from June 2026 places the two-month rolling stock-bond correlation at -0.69, the most extreme negative reading since 1996, with core PCE still sitting above the threshold where bonds historically recover their cushioning function.
When inflation runs hot, bonds stop being a hedge and start being a second source of losses. Your equities reprice for higher discount rates at the exact moment your bonds lose value, and the diversification you counted on simply is not there.
There is a related trap in the “bad news is good news” dynamic, where weak economic data lifts equities because the market expects easier policy. That only holds when central banks have room to cut rates and inflation is contained.
When inflation is sticky or rates are already constrained, bad news becomes unambiguously bad. Weak data then signals real earnings stress with no offsetting rate relief, and that is exactly when cheap hedges suddenly pay off.
Watch for the early warning signs. The original market discussion behind this analysis flagged rising options volume in XLU, the utilities sector ETF, as a signal that defensive positioning is quietly building beneath the surface before it shows up in broad index put demand.
What this means for you is direct. You can no longer assume your bond allocation will automatically catch you during an equity drawdown. If you want reliable downside protection, you increasingly have to manufacture it yourself using derivatives.
Assembling cost-effective hedges with put butterflies
Here is where theory becomes a trade you can actually size. The obvious move, buying an outright put option, has a well-known flaw: it bleeds premium every day through time decay.
A single out-of-the-money put on the Nasdaq ETF (QQQ), set roughly 1% below the current price, might cost around $0.20. That sounds cheap, but hold a stack of them through a flat market and the daily decay quietly erodes your capital.
A put butterfly spread is designed to solve exactly that problem. You buy one put at a higher strike, sell two puts at a middle strike, and buy one put at a lower strike, all expiring on the same date.
The two options you sell in the middle fund most of the cost of the two you buy on the outside. That is what makes the structure so cost-efficient compared with an outright put.
Butterfly spread mechanics vary meaningfully depending on whether you structure the trade as a call butterfly, a put butterfly, or a paired combination covering both a selloff and a recovery scenario, and the choice between these configurations changes both the cost profile and the range of market outcomes where the trade pays.
Consider a concrete example from the source discussion: a 100-point wide SPX put butterfly with strikes at 7,300 / 7,400 / 7,500, expiring at the end of October. The full structure costs roughly $600 in premium, with a maximum payout of $10,000 if the index lands right on the body strike at expiry.
| Strategy | Upfront cost | Maximum payout | Payoff window |
|---|---|---|---|
| Outright put (QQQ 1% OTM) | ~$0.20 per contract | Large, uncapped to the downside | Wide: pays on any sizeable fall |
| Put butterfly (SPX 7300/7400/7500) | ~$600 per structure | $10,000 at the body strike | Narrow: pays near the middle strike only |
The catch is precision. A butterfly only delivers its full payout if the index finishes near that body strike, so a large move in either direction leaves you with limited protection.
In practice, partial profit of roughly $2,000 to $3,000 is considered achievable if the index simply passes through the butterfly range during expiry week. That is still a strong return on $600 of risk, but it demands a genuine view on where the market will land.
What this forces on you is discipline. A butterfly trades broad, catch-all protection for strict cost control, so your portfolio does not bleed premium in flat markets, but you have to be right about the destination, not just the direction.
The no-cost carry strategy
There is a more advanced version worth understanding. The idea is to buy two put butterfly spreads and sell one, structuring the trade so the premium from the one you sell covers the combined cost of the two you keep.
Done cleanly, that gives you a hedge with zero net premium outlay, protection you are effectively carrying for free.
The execution risk, however, is real. These trades are highly sensitive to strike selection, position sizing, slippage, and bid-ask spreads, and market makers tend to widen their quotes around exactly the events you are hedging. The no-cost carry works on paper far more easily than it fills in a live, fast-moving market.
Mapping your defences against upcoming binary events
This is where it gets urgent. Short-dated structures like these are built for scheduled catalysts, and the autumn calendar is dense with them.
Short-dated options, those with one to five days until expiry, fit these moments far better than structural, long-dated hedges. You deploy them around a specific event, let them resolve, and avoid paying weeks of time decay for protection you only need on a single day.
Here is the near-term calendar these structures are designed to navigate.
- Non-farm payrolls. According to options market pricing at the time of the source discussion, the payrolls release carried the largest implied event volatility of any scheduled data release that week. A weak print could trigger the “bad news is good news” reaction, or the opposite if inflation fears dominate.
- Earnings season. Bank earnings were expected to begin around 13 October, with the broader reporting season, including the heavyweight tech names, kicking off around 16 October. For the AI and tech complex, this is the next genuine catalyst.
- US midterm elections. Scheduled for approximately 3 November, the midterms are a major binary volatility event. One pattern discussed involves a market pullback into the vote followed by a possible recovery afterward.
For investors wanting to understand the historical return data behind the election catalyst, our full explainer on midterm election market patterns covers the S&P 500’s post-election track record since 1950, sector-level dispersion driven by divided government, and why macro conditions in 2026 complicate the historical pattern.
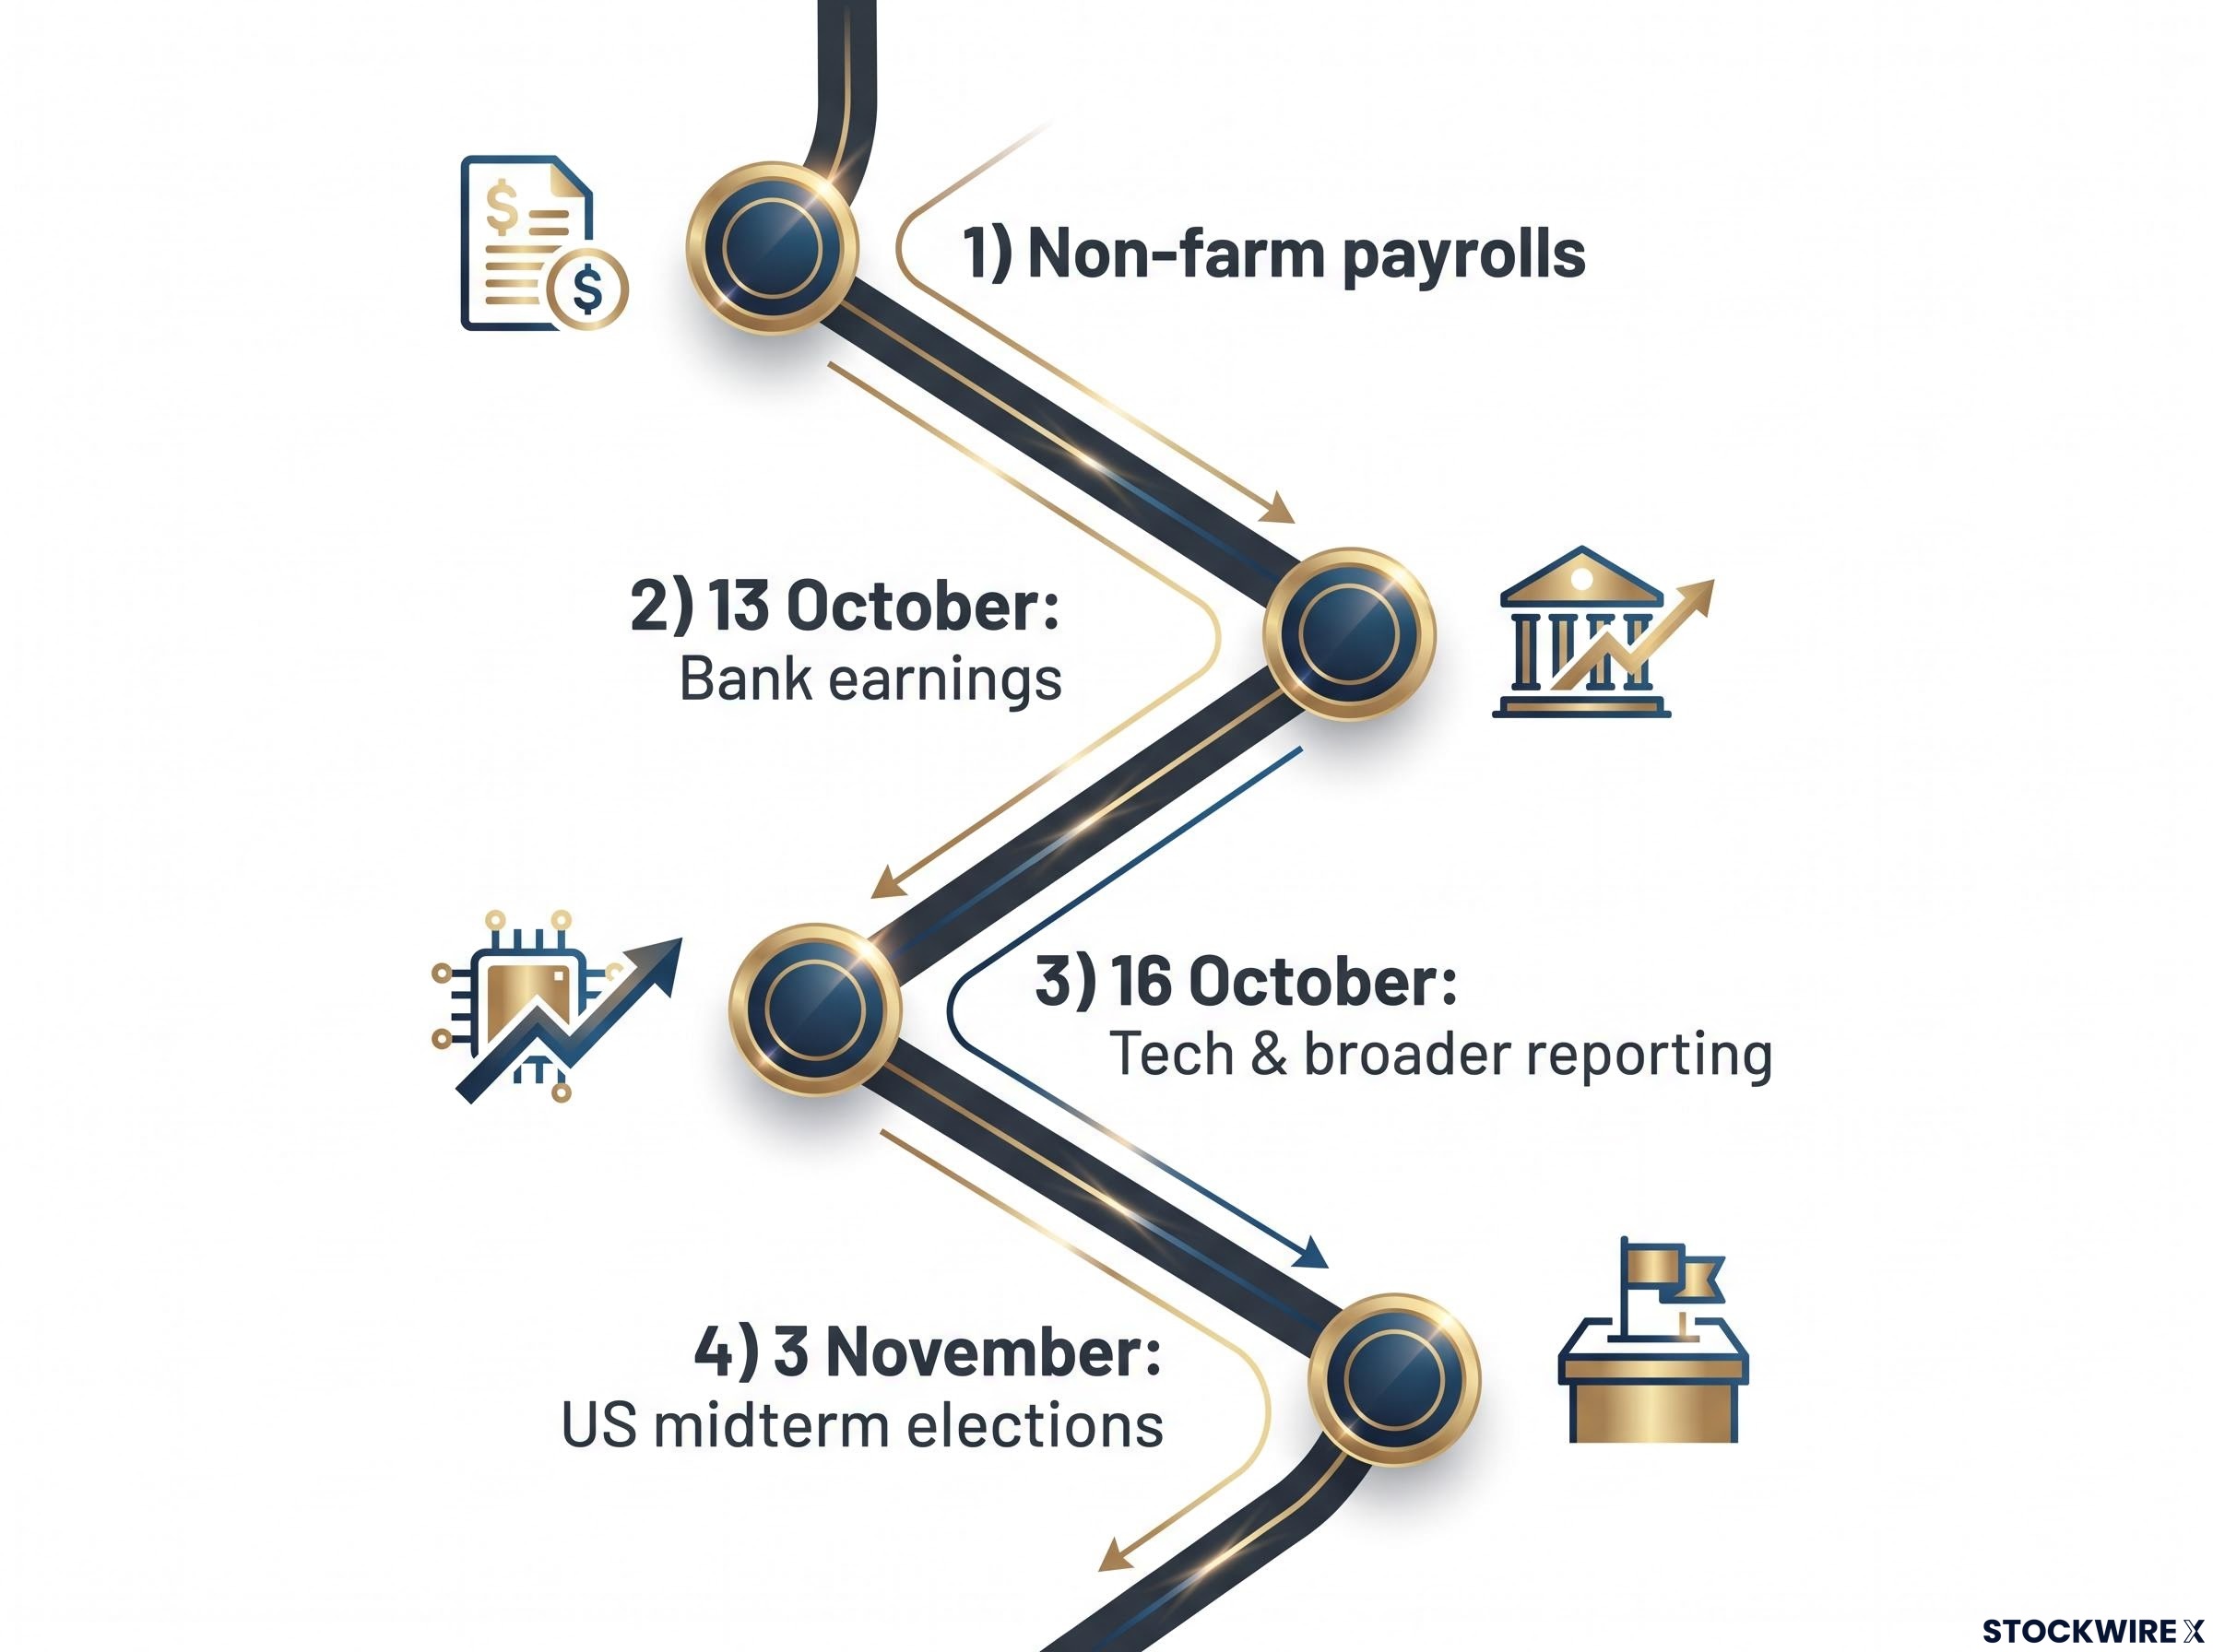
What these dates give you is a deployment schedule. They tell you precisely when to put short-dated hedges on, rather than holding protection perpetually and bleeding capital between events.
There is a behavioural warning attached. Holding hedges through long quiet stretches wears investors down, and many abandon their protection right before it finally pays off. The discipline is not just in buying the hedge; it is in timing it to the catalyst and resisting the urge to quit early.
Sustaining protection without draining your portfolio
Pull the threads together and the setup is clear. Low implied volatility sitting alongside a crowded calendar of binary risks creates a genuinely rare window for efficient hedging, where you can buy meaningful protection without the usual drag on your cash.
The edge here is not panic. It is discipline and precise execution: picking the right structure, sizing it sensibly, and timing it to a specific catalyst rather than holding it indefinitely.
Before earnings season begins, evaluate your next defensive trade against three questions. Where do you actually think the index lands? Which specific date are you hedging? And can you accept the narrow payoff window a butterfly demands in exchange for its low cost?
This article is for informational purposes only and should not be considered financial advice. Investors should conduct their own research and consult with financial professionals before making investment decisions.
Past performance does not guarantee future results, and the trade structures described are speculative and subject to change based on market developments and conditions.