The Federal Reserve raised interest rates in September 2026 for the first time in over three years. For many investors, that single move felt like it settled the question. It did not.
What September delivered was the start of a debate, not the end of one. October 2026 brings a dense cluster of US and Australian data releases, two central bank decisions, and a market that cannot agree on what comes next.
This is why the October 2026 economic outlook matters more than a typical month. Inflation prints and jobs figures across both countries will arrive in rapid succession, and each one carries the power to swing bond yields, repricing equities within minutes of release.
Here is the framework for reading those signals correctly. This covers how to interpret the upcoming jobs and inflation data before the Fed’s 28 October decision and the Reserve Bank of Australia’s Melbourne Cup Day meeting, so you can judge the probabilities rather than chase the headlines.
A divided market ahead of the Federal Reserve decision
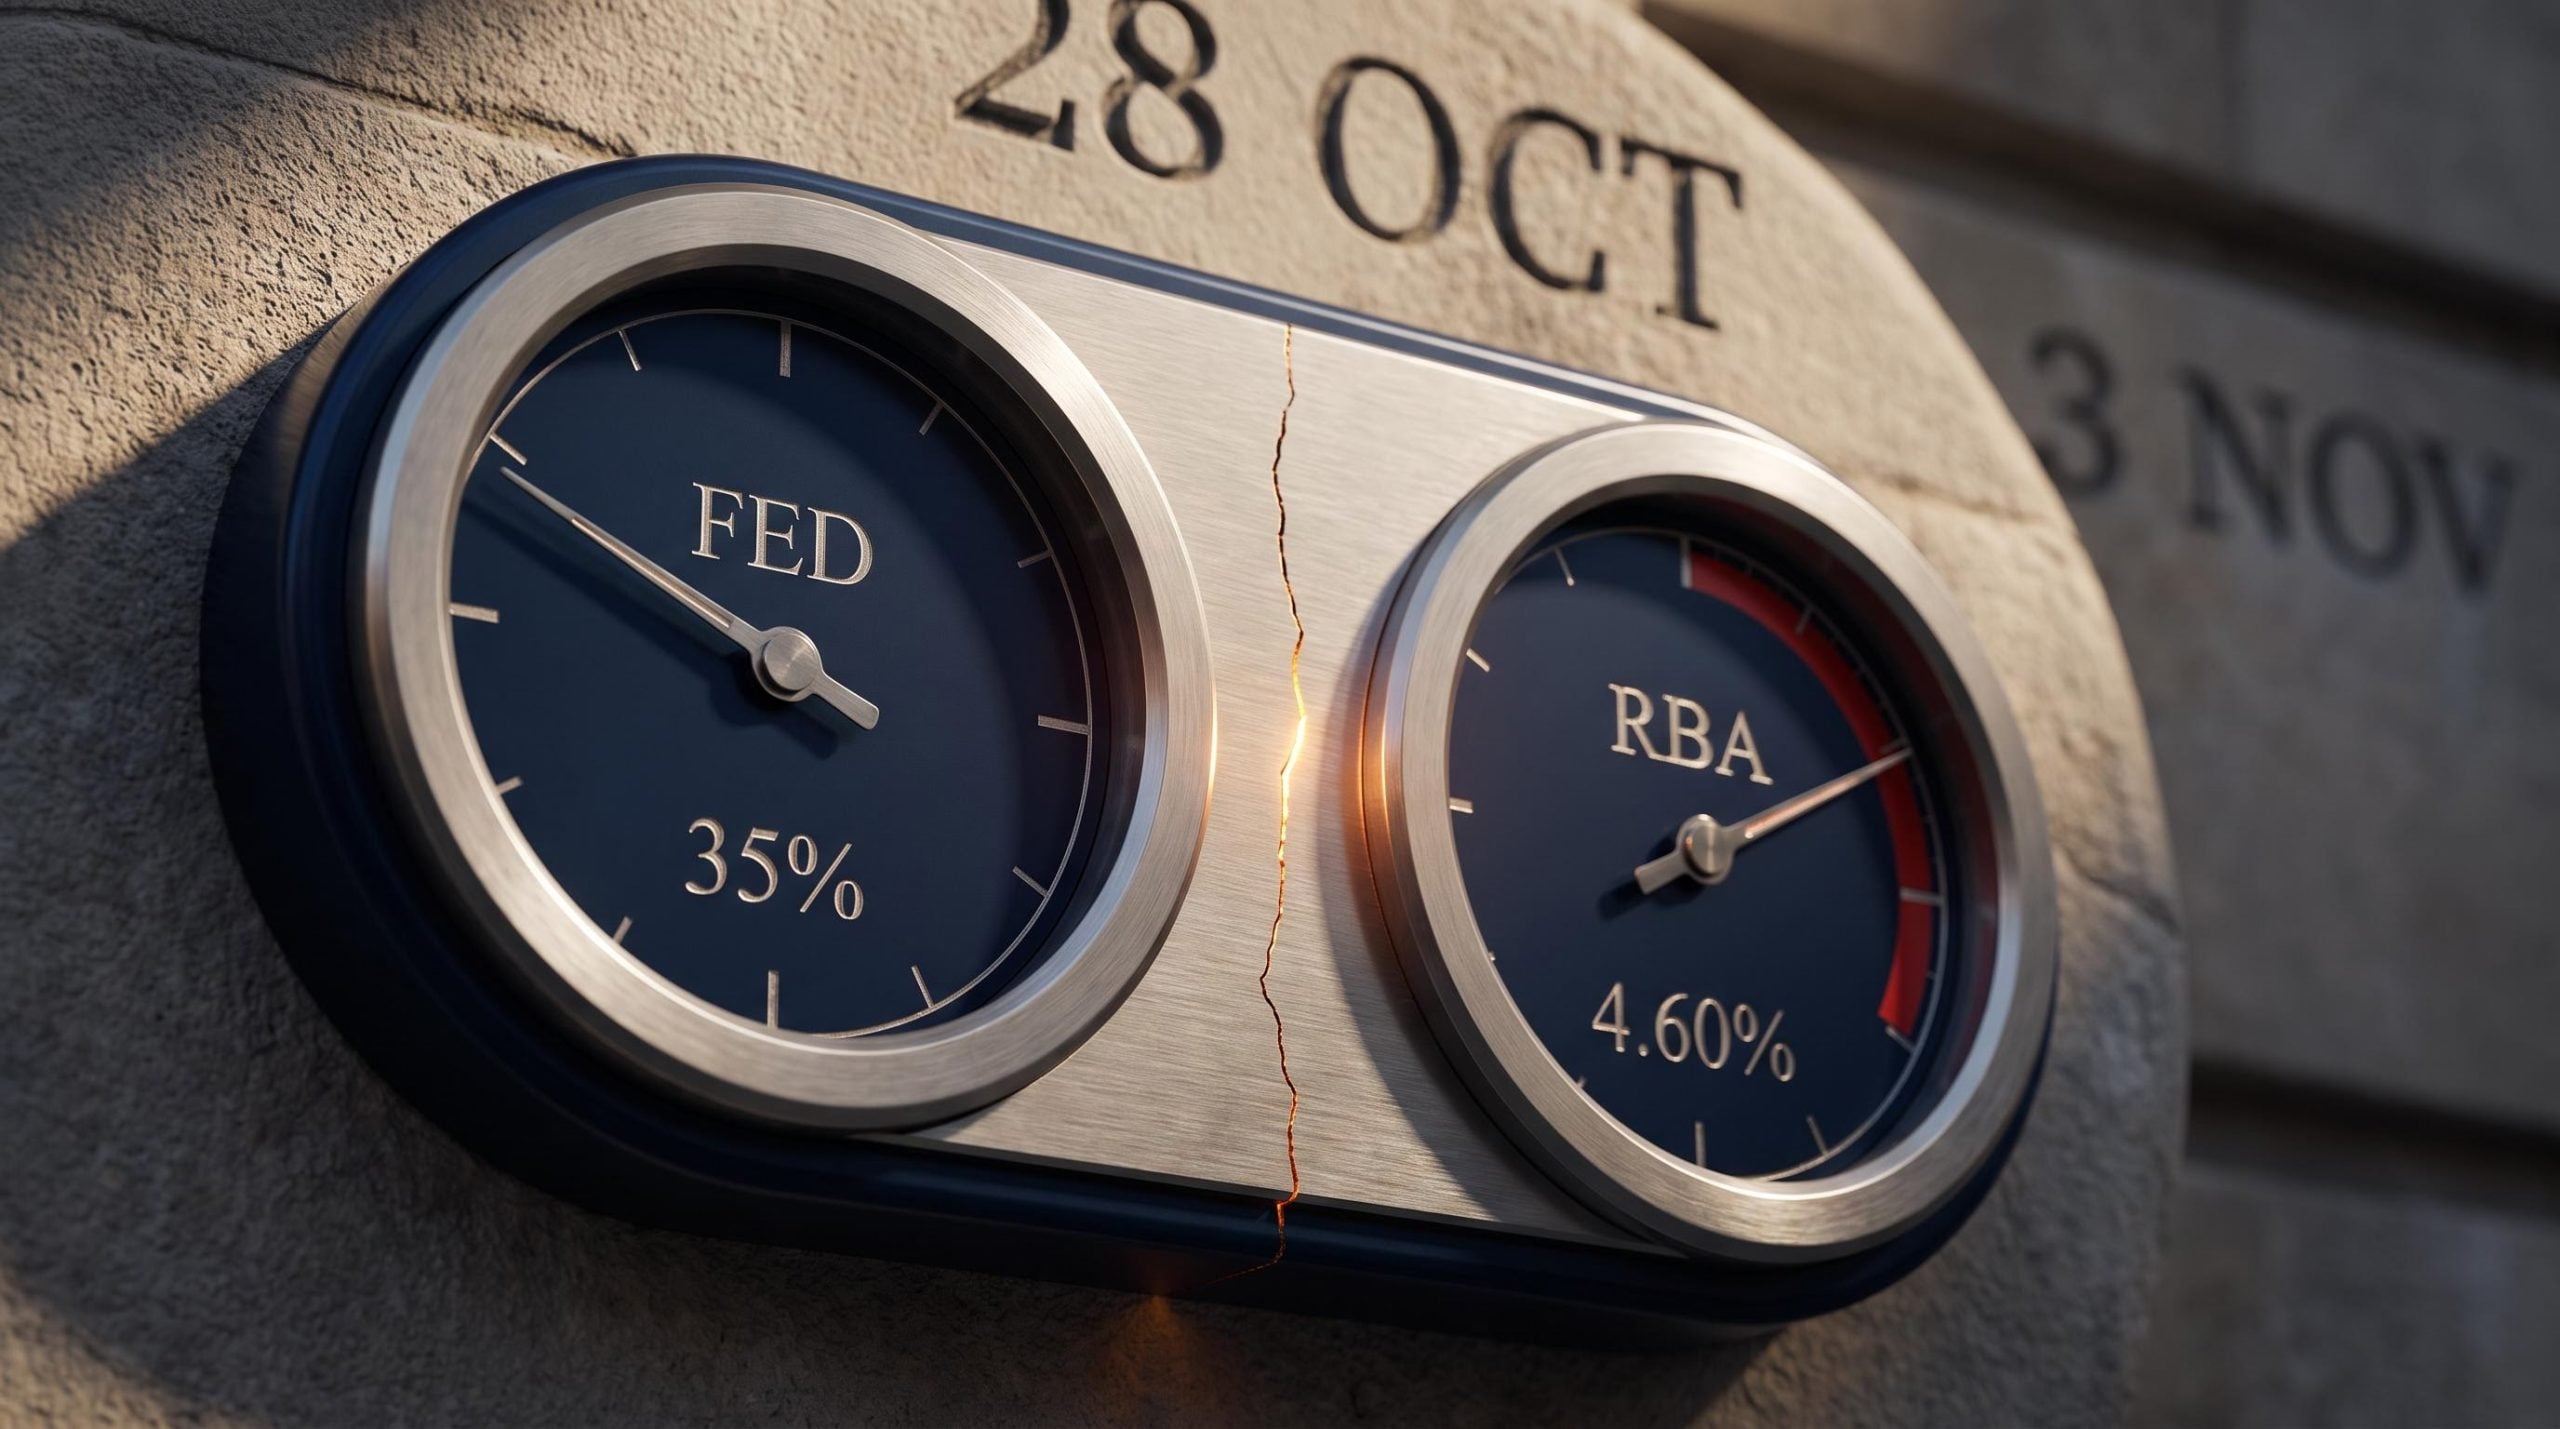
The Federal Open Market Committee (FOMC) meets on 27-28 October 2026, with the rate decision landing at 2:00 pm ET on the 28th. It arrives at an awkward moment.
The September increase lifted the Fed’s target range to 3.75-4.00 percent, the central bank’s first hike in over three years. Rather than drawing a line under the tightening cycle, that move reopened a question markets thought was closed: how many more hikes are coming, and how soon.
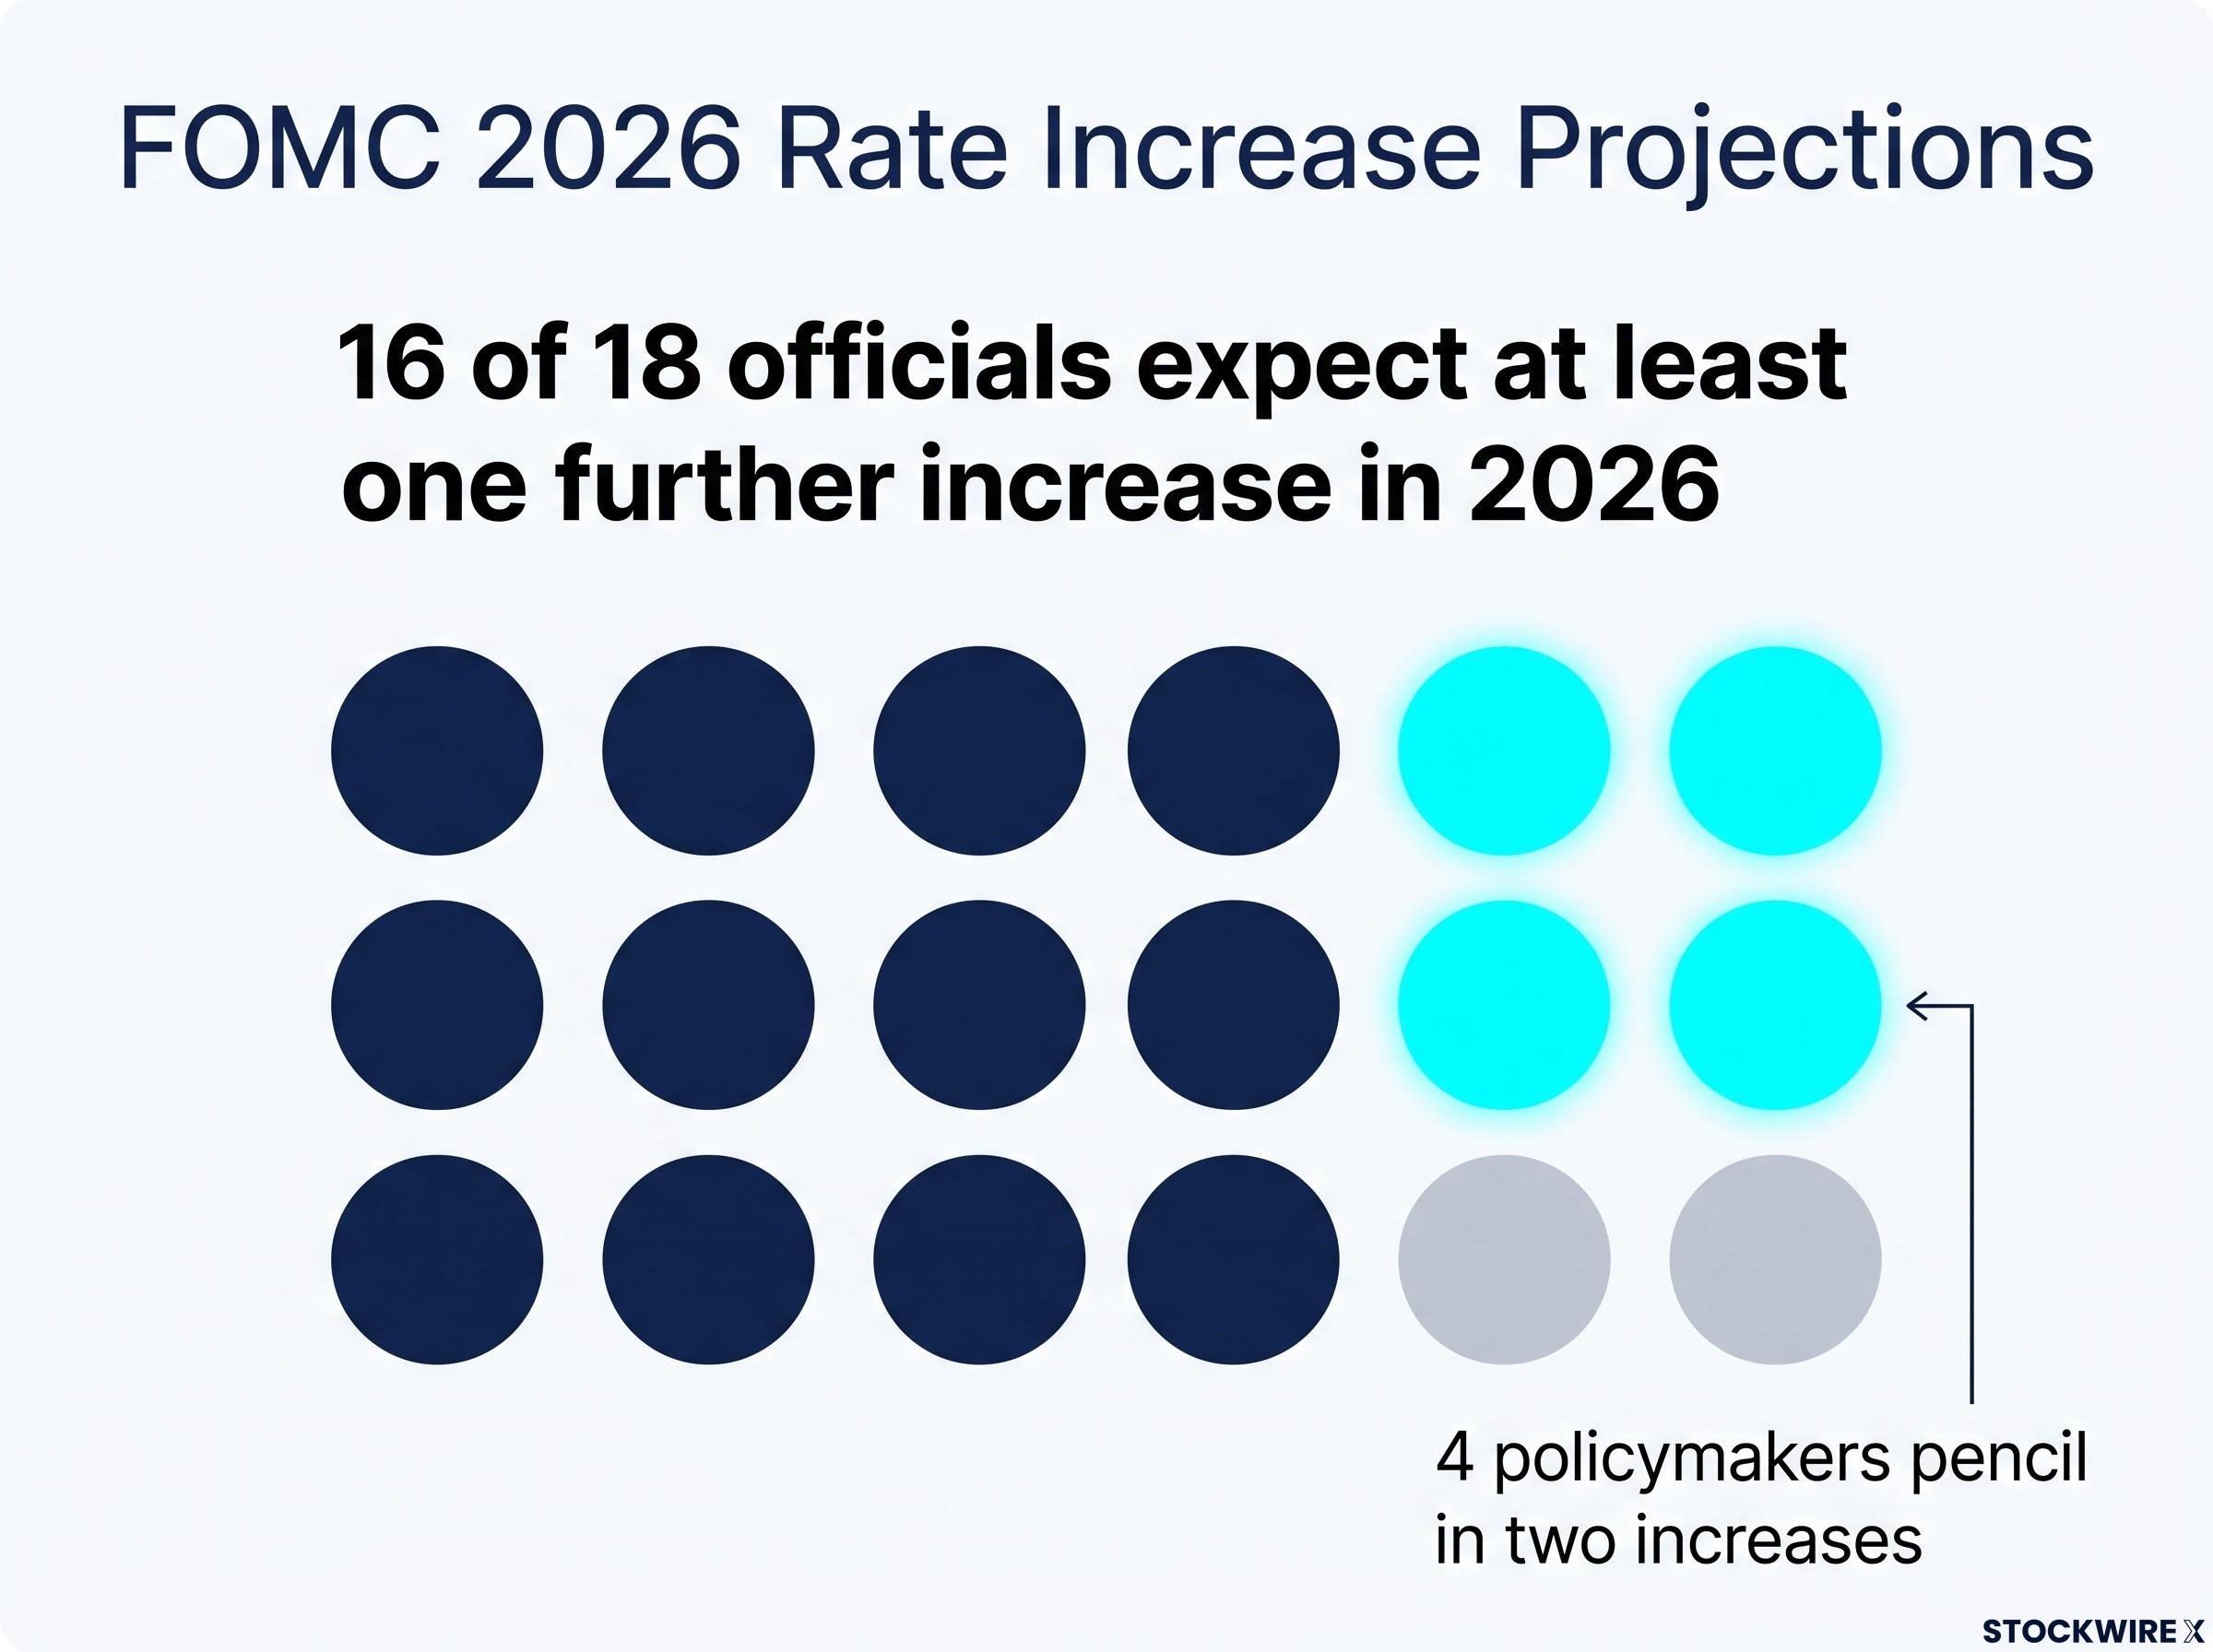
The committee’s own projections point firmly toward more. FOMC forecasts released alongside the September decision showed 16 of 18 officials expecting at least one further increase in 2026, with four policymakers pencilling in two.
The FOMC September 2026 statement confirmed the target range increase to 3.75-4.00 percent and provided the committee’s rationale, with the accompanying Summary of Economic Projections showing 16 of 18 officials expecting at least one further hike before year-end.
Yet the market is not convinced October is the moment. As of 1 October 2026, pricing implied roughly a 35 percent probability of a 25-basis-point hike on 28 October, meaning a hold remained the majority view.
The institutional split is just as sharp:
- Goldman Sachs (reported by Reuters on 17 September 2026) expects an October hike, arguing that with inflation above target and the Fed’s own projections flagging more tightening, failing to deliver could damage the central bank’s credibility.
- UBS strategist Simon Penn expects the Fed to pause in October and move in December instead, even after FedWatch odds briefly spiked above 70 percent.
- Goldman Sachs Asset Management favours skipping October with a December hike as its base case, citing cumulative tightening already in the system and lingering data uncertainty.
Adding to the tension is a data gap. No fresh US inflation reading was confirmed in the immediate run-up to the meeting, which leaves market pricing resting on sentiment and older figures rather than a clean, recent print.
Here is what that 35 percent tells you. A minority probability is not zero risk. If you position a portfolio for a guaranteed October pause and the data forces the Fed’s hand, you are exposed to exactly the move you assumed away.
When big ASX news breaks, our subscribers know first
Why rate probabilities are volatile trading signals
Those percentage odds quoted in financial media feel precise. They are not forecasts, and treating them as such is one of the easiest ways to get whipsawed this month.
The numbers come from two main places. Fed funds futures, which are contracts whose prices move with traders’ collective bets on where the cash rate will sit, are converted into implied probabilities through tools like the CME FedWatch. Prediction markets such as Polymarket and Kalshi do something similar, letting participants buy and sell contracts that pay out based on whether a hike happens.
Both produce a single headline percentage. But that figure is a live measure of what traders are willing to bet right now, shifting with every speech, data point, and rumour. It is market anxiety expressed as a number, not an official economic projection.
For context on how the December debate was shaping up, prediction markets in mid-September priced the odds of a December hike at roughly 70 percent on Polymarket and 72 percent on Kalshi, well above the contested October figure.
The September volatility lesson
The clearest proof that these odds are mood rings, not crystal balls, came in September 2026. October hike probabilities swung from around 17.7 percent in late August to above 72.5 percent by 29 September, before collapsing back to the mid-30s by 1 October.
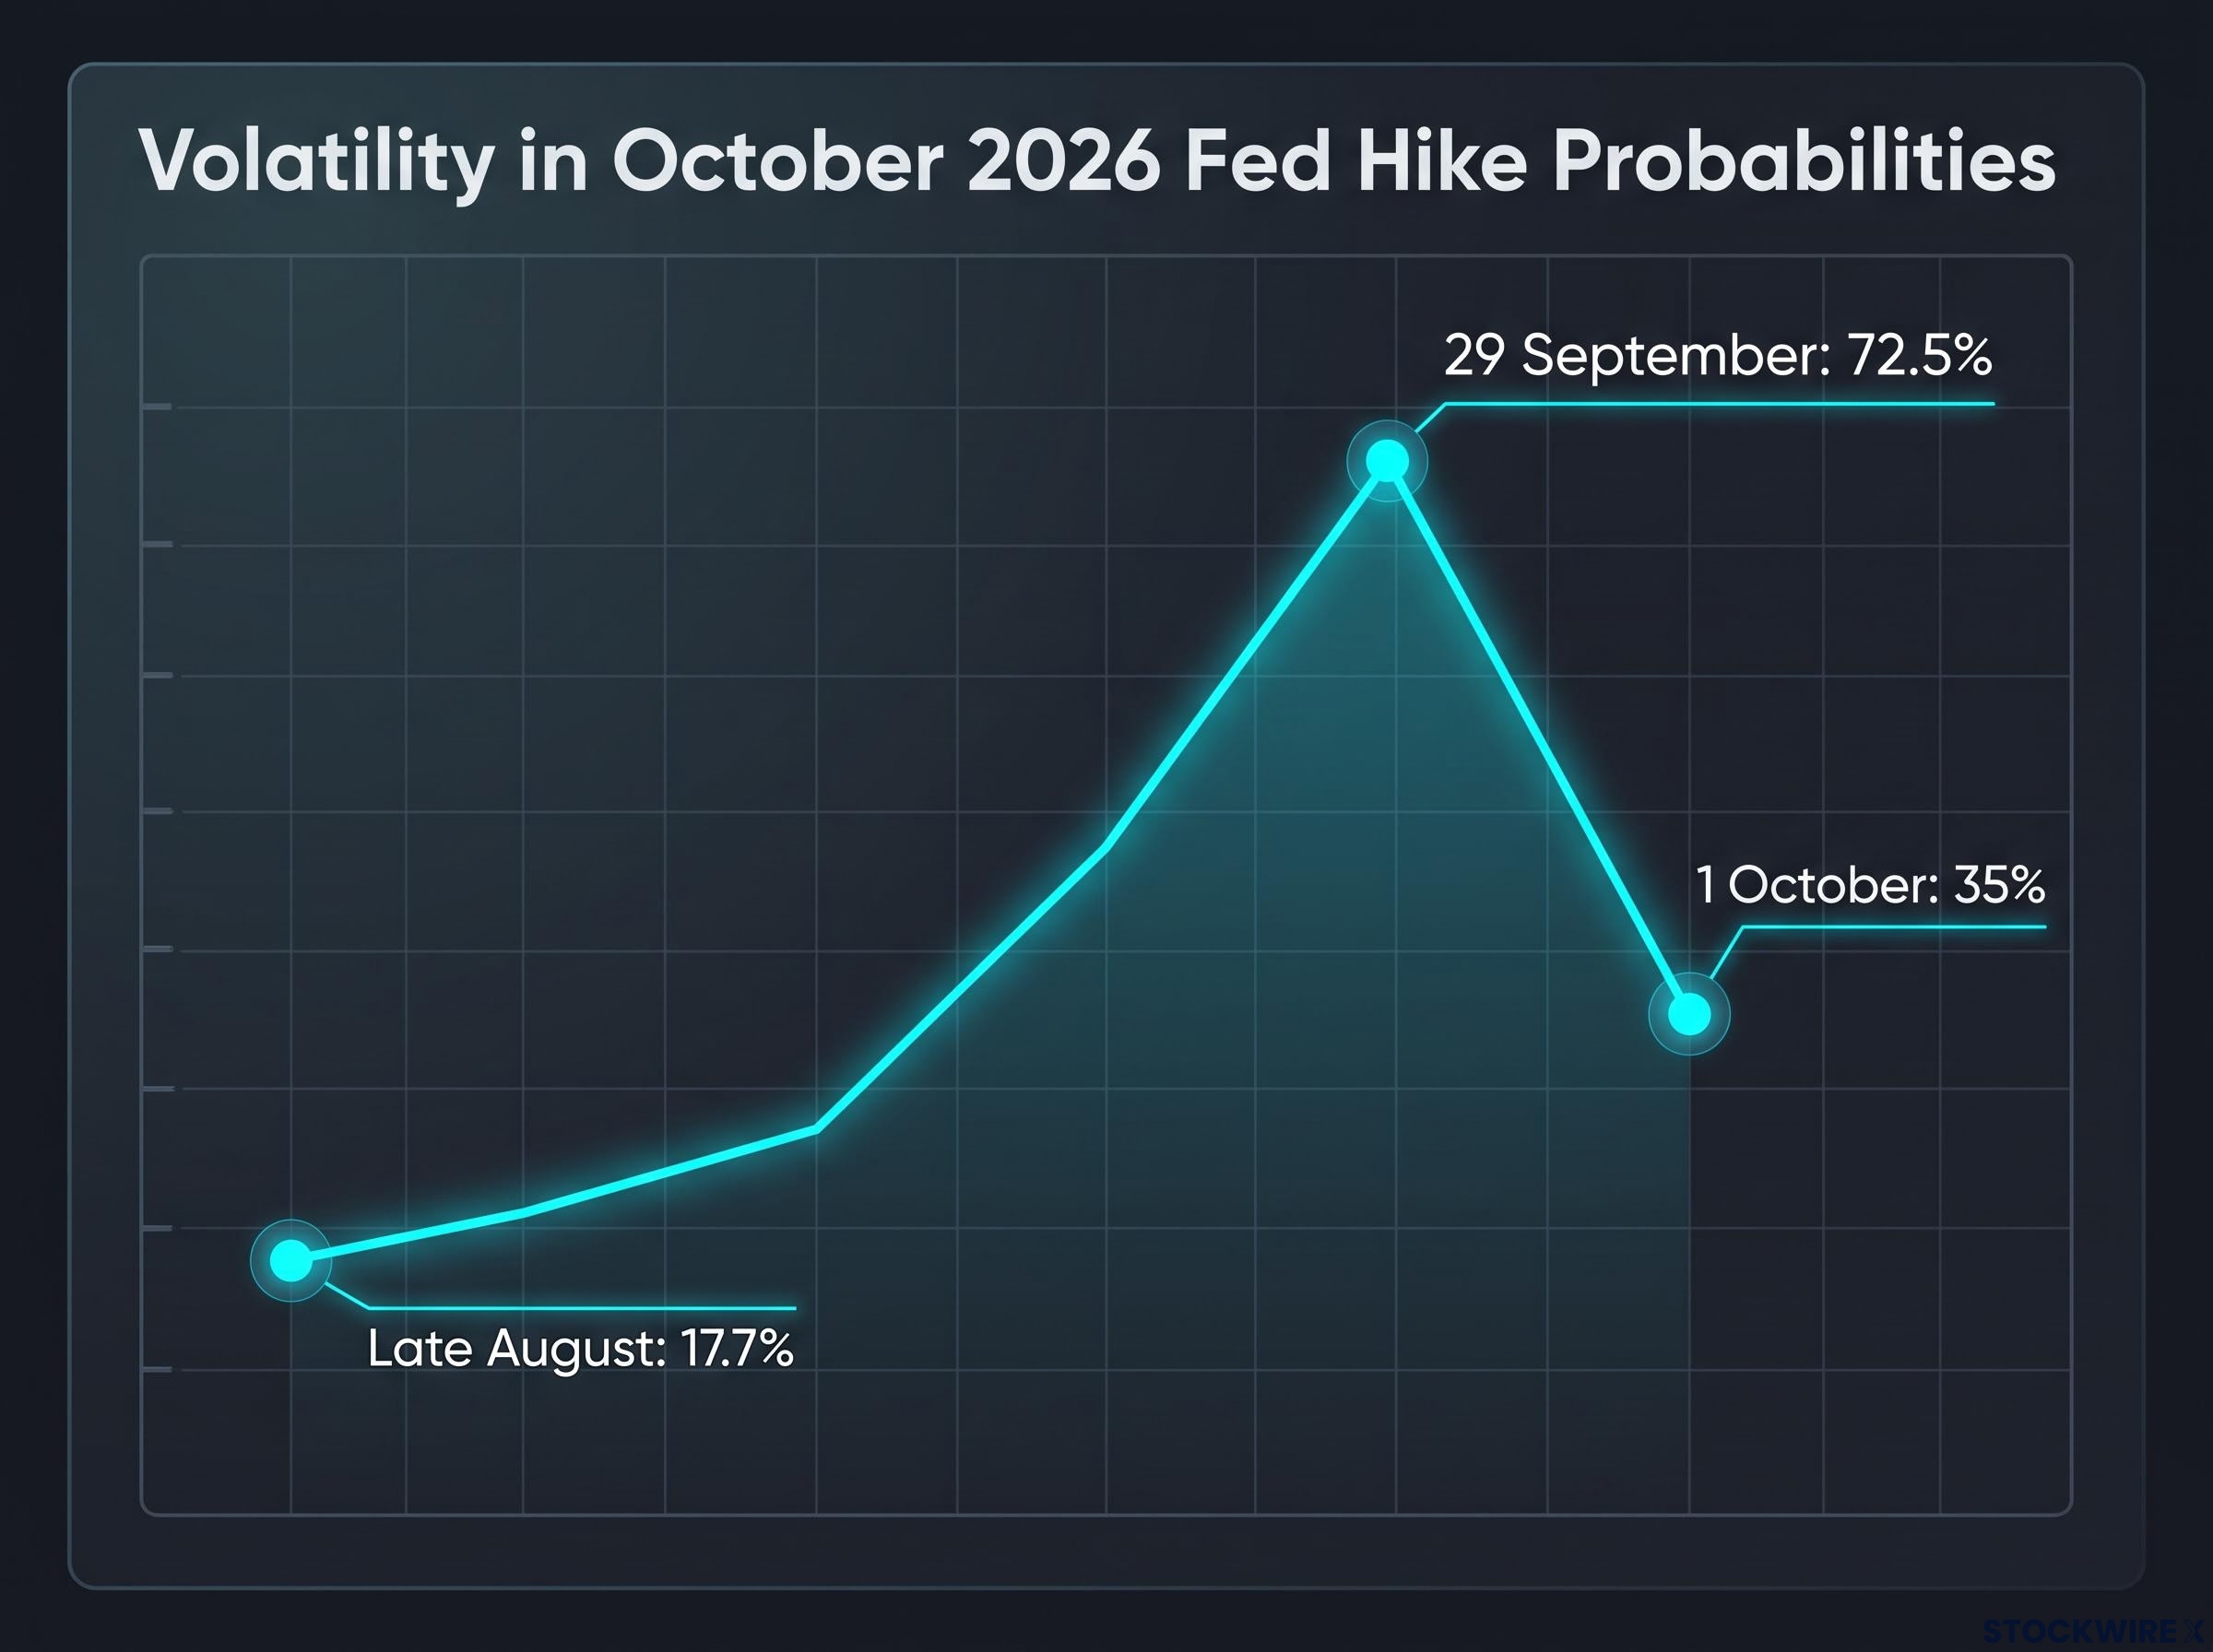
That is a swing of more than 50 percentage points in roughly a month, on the same underlying meeting.
The mechanism behind these lurches is speed. A single data surprise or a hawkish line from a Fed official triggers immediate algorithmic repricing, and futures markets reset within minutes. The 29 September spike, for instance, followed commentary from New York Fed President John Williams.
Fed hike probability signals turned sharply in late September when New York Fed President John Williams moved futures pricing by roughly 20 percentage points with a single speech, illustrating precisely why a single headline odds figure captures market anxiety rather than a durable policy forecast.
What this means for you is simple. When a headline screams that hike odds have jumped, read it as a measure of how nervous the market has become, not as a reliable prediction of the outcome. The investors who overreact to each daily swing are the ones who get caught selling the dip and buying the spike.
The data thresholds driving the Australian outlook
The same data-dependence defines the Australian picture, and this month the thresholds are unusually precise. Two releases will shape the Reserve Bank of Australia’s next move.
Australian jobs data is scheduled for 15 October 2026, followed by the pivotal third-quarter inflation figures in late October, just days before the RBA decides on 3 November.
The number that matters most is trimmed-mean inflation. This measure strips out the largest price moves in either direction each quarter to reveal the underlying trend, and because the RBA targets medium-term inflation within a 2-3 percent band, it is the Bank’s primary read on whether policy is working.
Trimmed-mean inflation targeting sits at the centre of RBA policy because the measure removes volatile items like fuel and government-administered price changes each quarter, leaving a cleaner signal of whether structural price pressures are easing or entrenching across the domestic economy.
Here lies the roadblock. The RBA’s August Statement on Monetary Policy forecast Q3 trimmed-mean inflation at 0.83 percent quarter-on-quarter. National Australia Bank, after seeing strong and broad-based price pressure in the July data, now expects closer to 1.0 percent.
That gap between the Bank’s own forecast and the analyst view is the whole story. It frames a clear scorecard for when the number drops.
| Date | Event | Geography | Key implication |
|---|---|---|---|
| 15 October 2026 | Labour force statistics | Australia | Early read on labour market tightness feeding RBA thinking |
| Late October 2026 | Q3 CPI (trimmed mean) | Australia | Above 0.83% raises November hike odds sharply |
| 28 October 2026 | FOMC rate decision | United States | ~35% hike priced; hold is majority view |
| 3 November 2026 | RBA decision and SoMP | Australia | Melbourne Cup Day; cumulative data verdict |
Here is how to use that scorecard. A late-October print approaching 1.0 percent tells you the RBA’s current settings are failing to cool core inflation, which makes a November hike highly likely and warrants reviewing your defensive positioning before the decision, not after it.
Melbourne Cup Day and the risk of overtightening
Every thread from October converges on one date. The RBA Monetary Policy Board meets on 2-3 November, with its decision and Statement on Monetary Policy released at 2:30 pm AEDT on 3 November 2026, Melbourne Cup Day.
By then, the pressure has already accumulated. The cash rate sits at 4.60 percent, its highest level in 15 years, after the September move marked the fourth increase of 2026. Each hike adds to the squeeze on households carrying mortgages and businesses servicing debt.
The precedent is fresh. In 2025, sticky core inflation blocked the rate cuts markets had expected, described at the time as a major roadblock to easing, even as other parts of the economy slowed. A strong Q3 print could recreate exactly that dynamic, where inflation data override growth concerns and keep policy restrictive.
Historical rate hike equity returns across 14 prior tightening cycles show the S&P 500 averaging roughly 9 percent in the 12 months after the first hike, with the early valuation-repricing dip typically smaller than the recovery that follows, a pattern that complicates the instinct to de-risk aggressively ahead of any single meeting decision.
NAB has been direct about the risk.
“There is risk of a follow-up rate hike in November,” National Australia Bank stated in its September 2026 Forward View, after flagging that Q3 trimmed-mean inflation could land near 1.0 percent against the RBA’s 0.83 percent forecast.
Here is what a Cup Day hike would mean for you. A fifth increase in a single year signals a genuinely restrictive environment, one that flows directly into higher borrowing costs, steeper mortgage rates, and pressure on equity valuations through the end of 2026.
Navigating portfolio risk through a dense data window
The common thread across both countries is data-dependence. Neither the Fed nor the RBA has committed to its next move, which means the figures arriving this month will do the deciding, and markets will reprice fast in response.
That creates a trap worth avoiding. The daily swings in futures and prediction-market odds are noise dressed up as signal. The September lesson, odds lurching from 17.7 percent to above 72.5 percent and back, shows how little those headline percentages should anchor a decision.
The more reliable guide is the underlying trend. Watch trimmed-mean inflation against the 0.83 percent threshold, watch the US jobs and inflation prints, and let those readings, not the hourly repricing, inform your view.
For investors holding cross-border exposure, one practical consideration stands out: stress-test positions against a scenario where both central banks hike, since the market is currently not fully pricing that outcome in either country.
Beta-weighted position sizing converts each holding into market-risk equivalent dollars, a practical tool for investors who want to stress-test cross-border exposure against a simultaneous Fed and RBA hike scenario rather than relying on dollar-allocation figures that can mask concentrated directional risk.
The month ahead is dense, but it is readable. Knowing the thresholds in advance turns a wall of headlines into a scorecard you can actually use.
This article is for informational purposes only and should not be considered financial advice. Investors should conduct their own research and consult with financial professionals before making investment decisions.
Past performance does not guarantee future results. Financial projections are subject to market conditions and various risk factors, and these forward-looking statements are speculative and subject to change based on market developments.