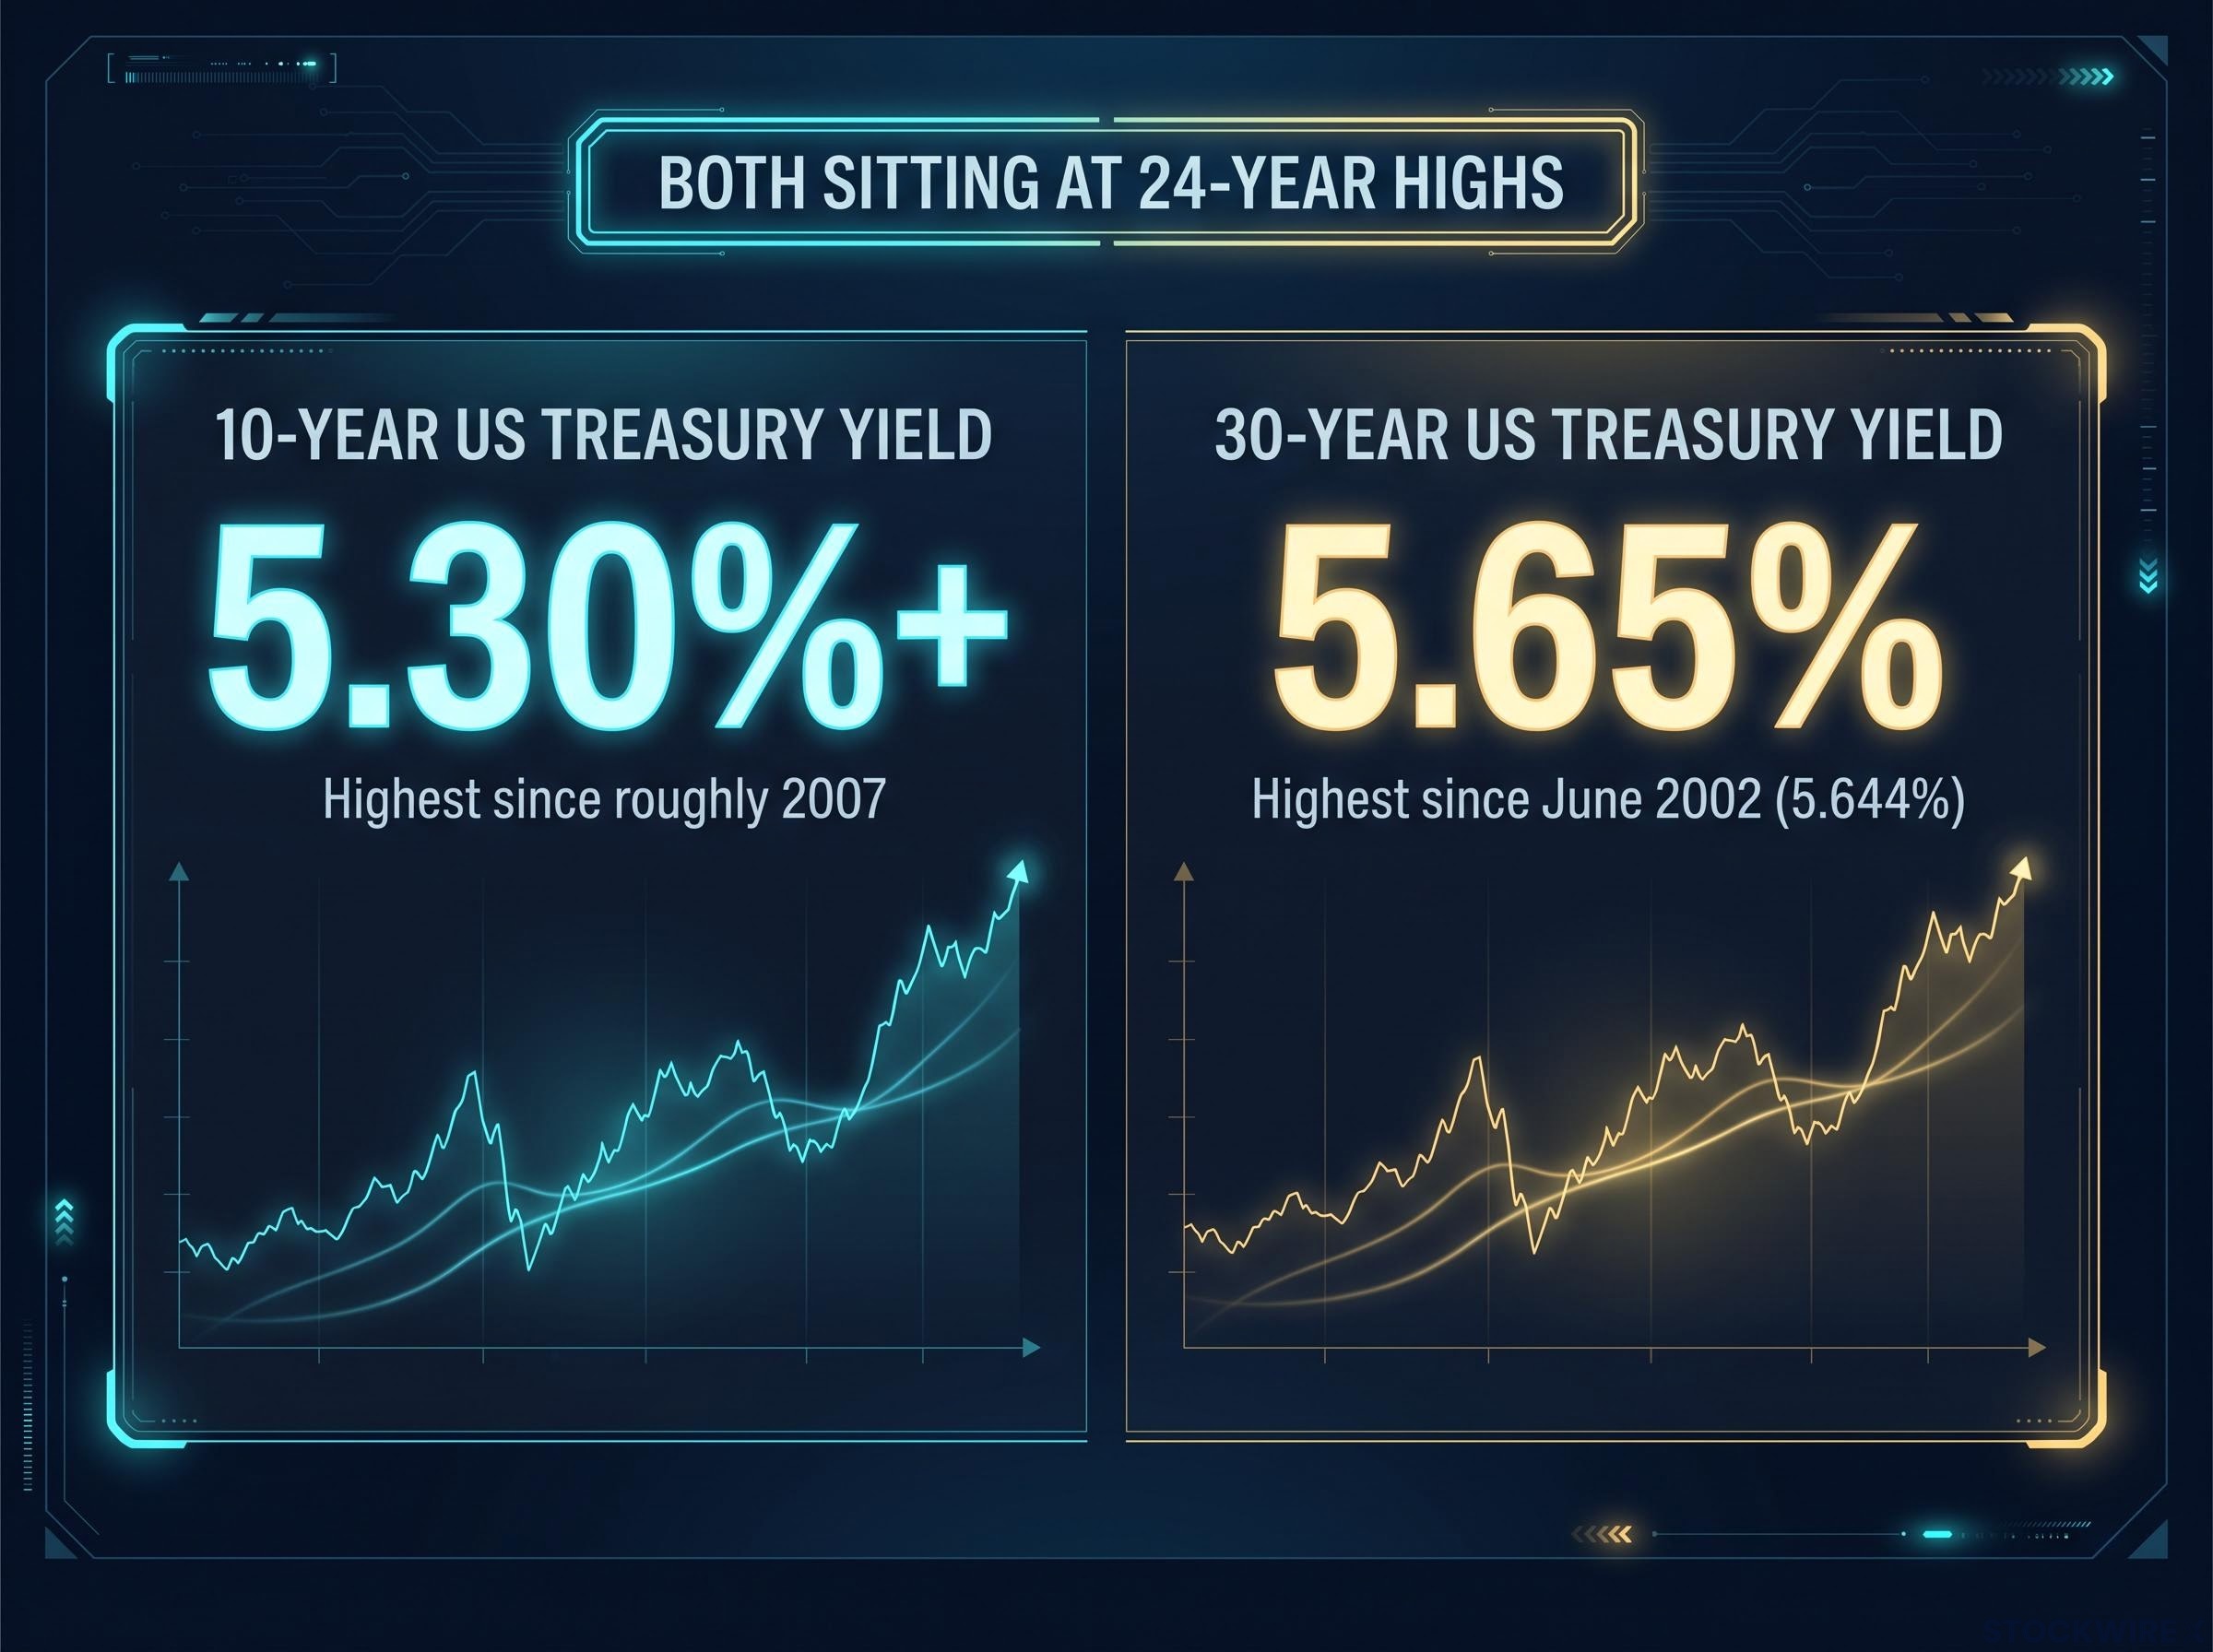
The 10-year US Treasury yield pushed above 5.30% on Wednesday, and the 30-year bond reached 5.65%, both now sitting at 24-year highs. The last time long-term borrowing costs lived at these levels, it was roughly 2002.
That alone would be a story. What makes it a puzzle is the timing. On 30 September 2026, the Bureau of Economic Analysis released an August inflation report that came in softer than forecast, nudging the disinflation narrative along just as the bond market was screaming the opposite.
So the signals are not aligned. Yields are pricing persistent tightening; the latest inflation print cooled a touch. For anyone trying to read where US Treasury yields, inflation, and the Fed go from here, these two data points arriving together create tension, not clarity. Here is how to read the two signals together, what the Fed is actually watching, and what matters most before the October policy decision.
Why 10-year and 30-year Treasury yields are at their highest in a generation
The move did not come from one place. It accumulated.
Across the final days of September 2026, the 10-year yield traded in a 5.23-5.253% range before its cycle peak above 5.30% on Wednesday, its highest since roughly 2007. The 30-year hovered at 5.60-5.62% and peaked at 5.65%, which CNBC noted was the highest since June 2002, when the long bond previously touched 5.644%.
What drove it is better understood as three forces pulling in the same direction rather than a single catalyst. TradingEconomics attributes the climb to a specific combination:
- Persistent energy-driven inflation keeping headline price pressure elevated
- A resilient US economy that has refused to slow on cue
- Hawkish guidance from named Federal Reserve officials
That last point is the clearest. Fed Governor Michael Barr said additional rate increases will likely be necessary to bring inflation to target. New York Fed President John Williams went further on timing.
Term premium normalisation is one of the structural forces the bear case relies on, distinct from cyclical inflation expectations: as the Fed’s share of outstanding Treasury debt shrank from roughly 26% in 2021 to approximately 14% by late 2026, the market-clearing price for duration has shifted upward independent of where the policy rate sits.
“Another rate hike late this year could be appropriate.” John Williams, President, Federal Reserve Bank of New York
TradingEconomics also noted markets were pricing in close to one percentage point of Fed rate increases over the next 12 months, a figure that should be treated as indicative rather than confirmed. Even allowing for that caveat, the direction is unmistakable: the market expects policy to stay tight.
Here is why the distinction matters for you. When three independent pressures converge, the yield move is structurally durable, not a spike that reverses once one headline fades. That tells you elevated long rates are closer to a new baseline than a temporary overshoot.
The geopolitical overlay: energy prices and the Middle East factor
Sitting underneath all of this is energy. Middle East instability, now in its seventh month, keeps upward pressure on energy prices, which feeds directly into headline inflation expectations. Those expectations, in turn, feed into how the bond market prices future Fed action. It is not a one-off news event; it is a sustained input that keeps the inflation question open and the tightening bias alive.
When big ASX news breaks, our subscribers know first
What the August PCE data actually tells you, and what it does not
On the surface, the August report looked like good news. Both headline and core Personal Consumption Expenditures (PCE), the Fed’s preferred inflation gauge, came in below what economists expected.
Here are the numbers before any interpretation.
| Indicator | August 2026 Actual | Consensus Forecast | July 2026 (Revised) |
|---|---|---|---|
| Headline PCE YoY | 3.4% | – | 3.4% (from 3.7%) |
| Core PCE YoY | 3.0% | – | 3.0% (from 3.3%) |
| Headline PCE MoM | 0.3% | 0.4% | 0.1% |
| Core PCE MoM | 0.2% | 0.3% | 0.1% |
A below-consensus print on both measures. Case closed on inflation? Not quite.
Start with the month-on-month figures. August’s 0.3% headline and 0.2% core readings are an acceleration from July’s revised 0.1% on both. In other words, prices rose faster in August than in July once you strip out the year-over-year framing. That cuts against any clean reading of the report as a disinflationary turning point.
Then there is the measurement question, which is where this gets uncomfortable. According to TechTimes, part of the improvement in year-over-year PCE owes to the BEA rewriting how it measures prices, not purely to prices cooling. Some of the apparent progress is statistical rather than economic.
The BEA’s Personal Income and Outlays report for August 2026 is the primary source for the PCE figures in the table above, and it includes the agency’s own documentation of the methodological revisions that shifted July’s headline reading from 3.7% to 3.4% and core from 3.3% to 3.0%.
“Modestly favorable.” Jan Groen, Societe Generale, on the recent inflation revisions, noting underlying inflation remained too elevated to reassure the Fed
The takeaway for you is specific. A softer print that partly reflects a methodology change is a weaker disinflationary signal than the headline suggests. PCE has run above the Fed’s 2% target continuously since 2021, and at 3.0-3.4% it still sits well above it. Treat this report as incremental, not confirmation of victory.
Why the BEA methodology change complicates the inflation signal
The BEA periodically revises how it estimates the prices consumers actually pay, and the July revision was large enough to shift the year-over-year readings materially: headline fell from 3.7% to 3.4%, core from 3.3% to 3.0%. That is a meaningful change driven partly by method, not just market prices.
If you want to triangulate rather than lean on a single measure, cross-check PCE against the Consumer Price Index (CPI) and core CPI, the Dallas Fed’s trimmed-mean or median PCE, which strip out extreme price moves, and services inflation excluding housing, which tends to be stickier and more relevant to policy. These help you judge whether the cooling is real.
The trimmed-mean and median PCE gauges produced by the Dallas Fed and Cleveland Fed strip out extreme price moves and have historically tracked the underlying inflation trend more reliably than the headline series, making them the cross-checks the Fed weighs most heavily when a single monthly print sends a mixed signal.
How bonds, the economy, and a century of price history explain what “above 5%” actually does
Step back from the day-to-day prints, because the more important lesson here outlasts this cycle.
When long-term bond yields sit above 5%, financial conditions are already tightening, independent of what the Fed does at any single meeting. The risk-free rate is the foundation everything else is priced against. Push it up, and the cost of mortgages, corporate borrowing, and government financing rises directly, no central bank action required.
The equity channel works through valuation. Higher risk-free rates raise the discount rate investors apply to future earnings, which mechanically lowers the present value of those earnings today. Longer-duration growth stocks, whose value sits far in the future, feel this most. Financial Express put the stakes plainly.
“The road ahead for risk assets could get more volatile than markets currently expect.” Financial Express, on 10- and 30-year yields holding above 5%
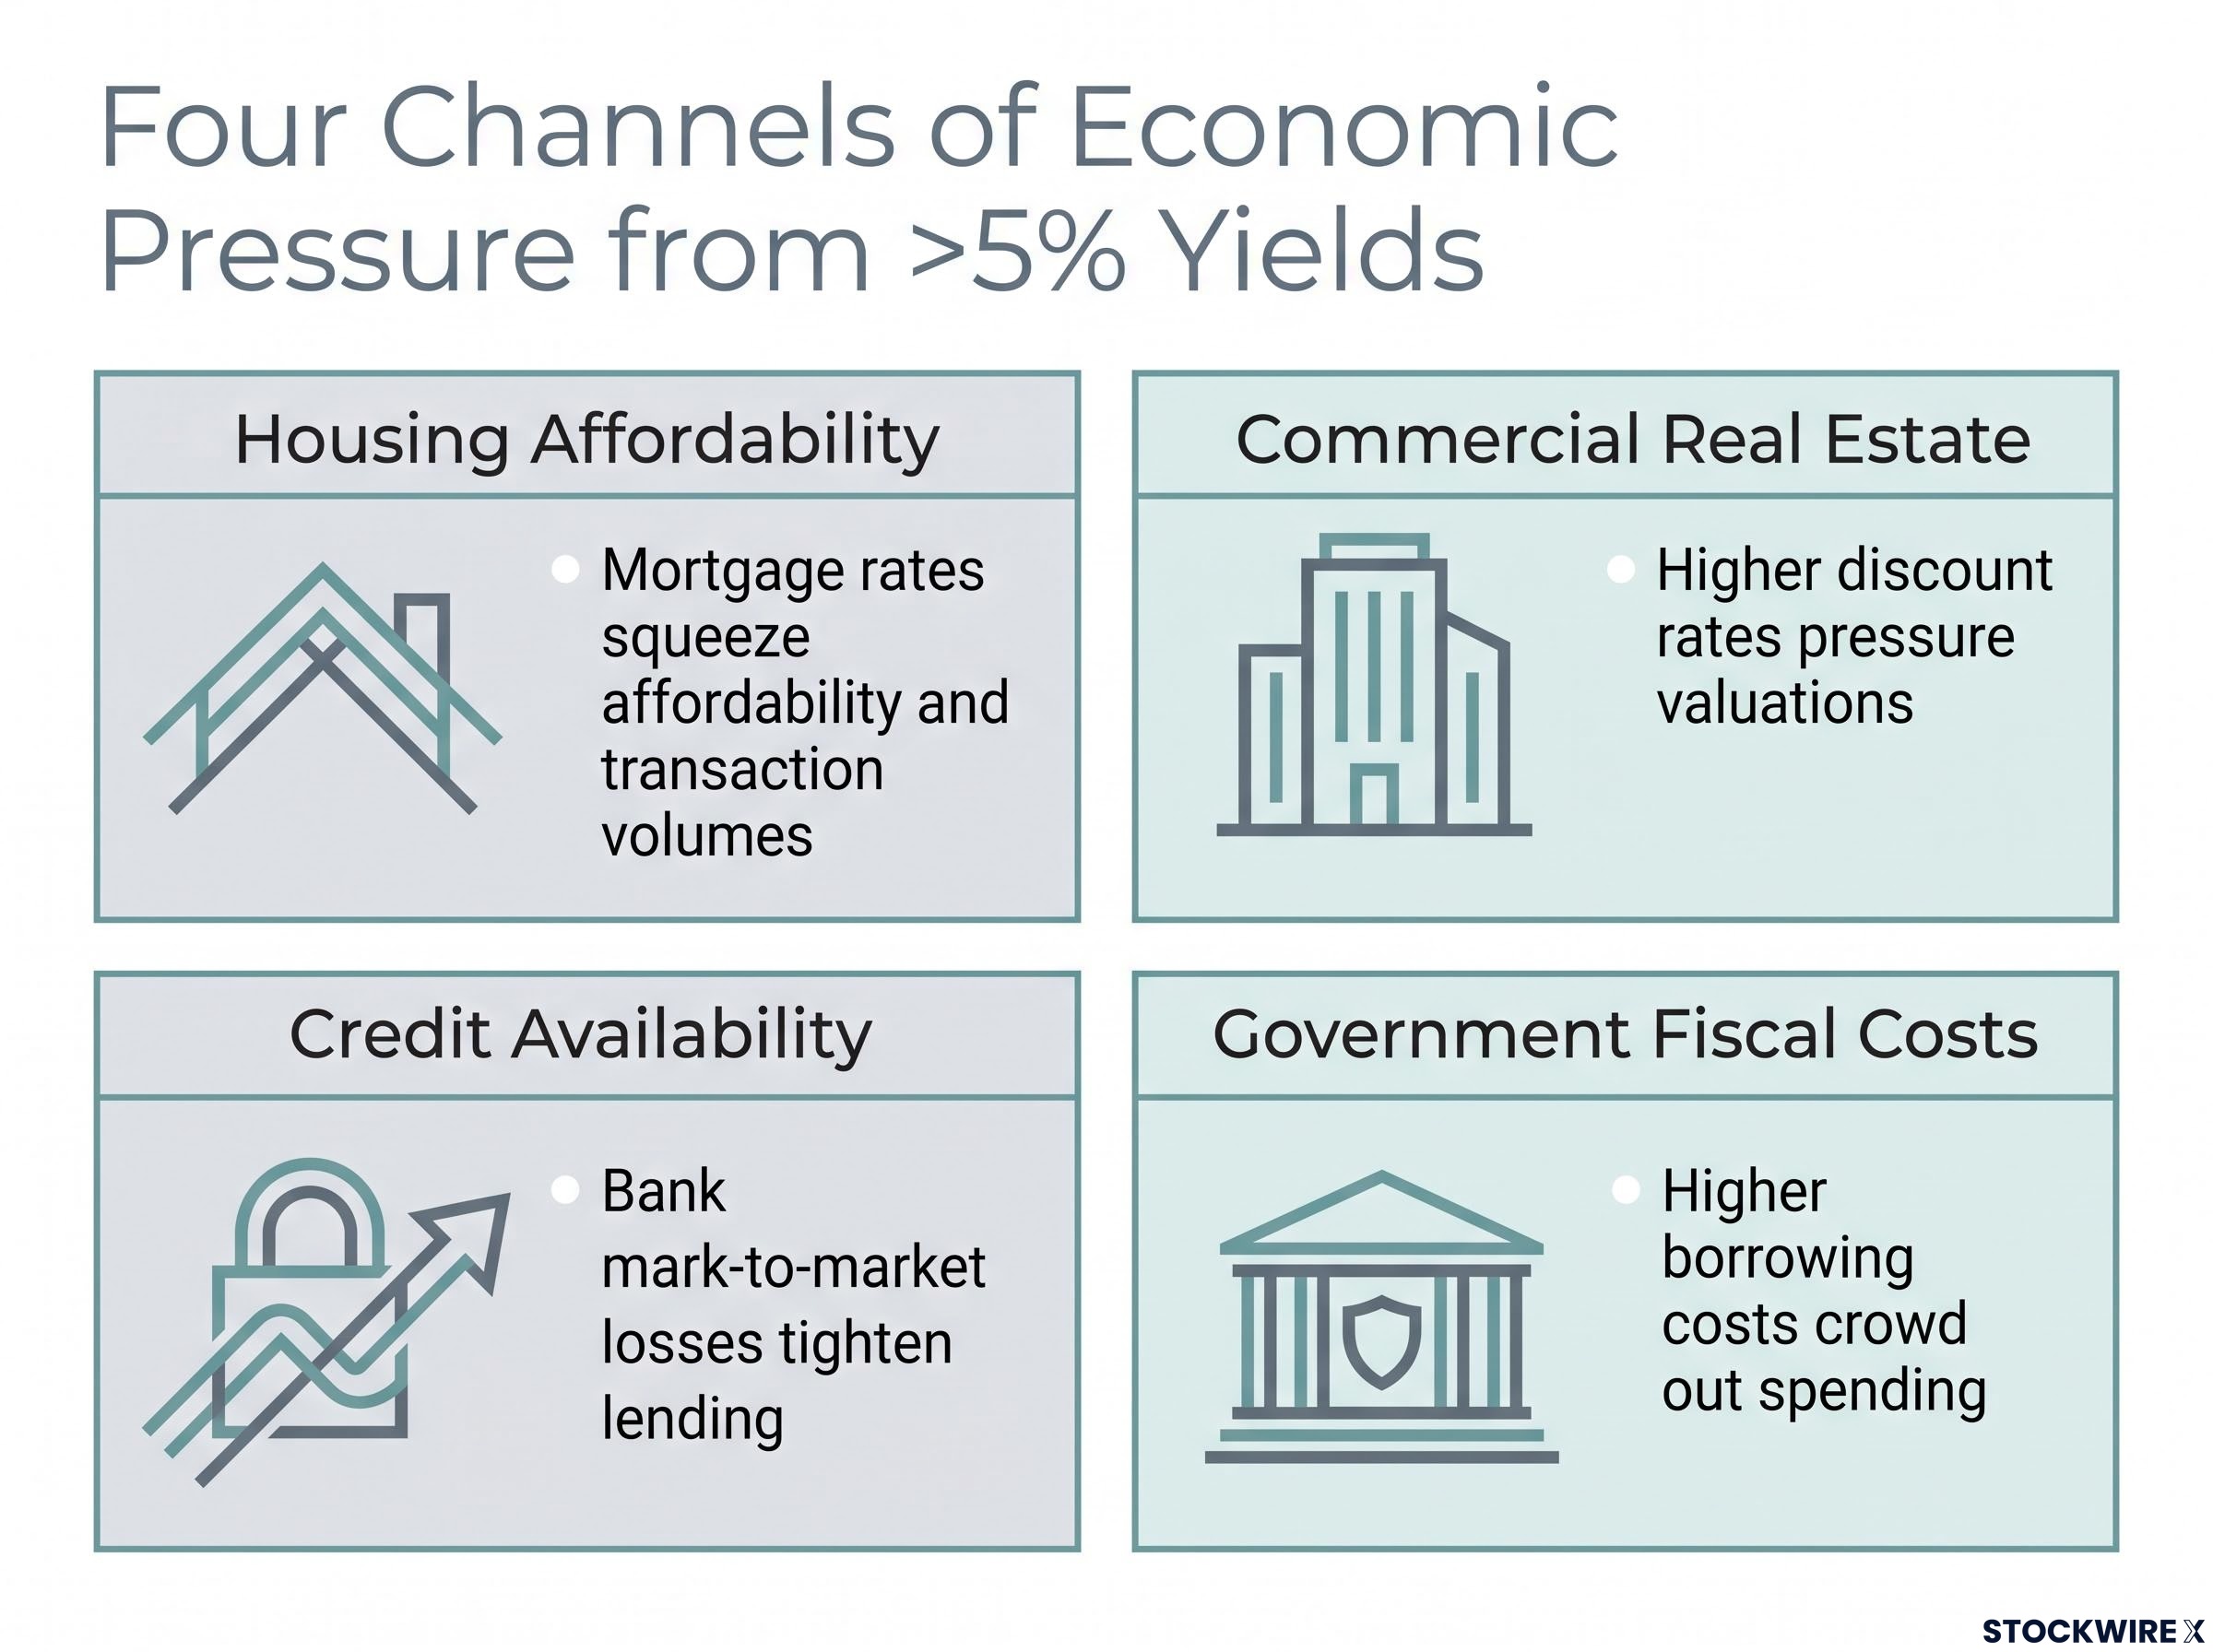
Beyond equities, four second-order channels carry the pressure into the real economy:
- Housing affordability: long yields flow directly into mortgage rates, squeezing affordability and transaction volumes
- Commercial real estate: higher discount rates pressure valuations in a sector already navigating structural strain
- Credit availability: banks holding fixed-rate assets face mark-to-market losses, which can tighten lending
- Government fiscal costs: higher long-term borrowing costs crowd out other spending and raise sustainability concerns
 are more directly linked than policy meeting outcomes: when the written policy statement signals hawkishness but press conference tone turns non-committal, the long end of the curve absorbs the contradiction as a risk premium, a dynamic that was already visible in the bear steepening that followed the July 2026 FOMC meeting.
| Pause camp | Keep-hiking camp | |
|---|---|---|
| Key argument | Inflation cooling; 5%+ yields already tightening | Core PCE still 100bps above target since 2021 |
| Key evidence | Below-consensus PCE; July revised lower | Barr and Williams favour more hikes; Groen sees only modest improvement |
| Key risk if wrong | Lets 3-4% inflation become entrenched | Tightening into fragile credit and housing accelerates deterioration |
Neither side has enough evidence to settle the argument, which is the point. The real decision variables are not yet public. As of 1 October 2026, September CPI and PPI had not been released, and they are what the October meeting will actually turn on.
For position-sensitive readers, three things decide the near term:
- September CPI, the primary cross-check on whether disinflation is real
- September PPI, which feeds into producer-side price pressure and forward PCE
- Any additional Fed official statements before the pre-meeting blackout period
The market has priced October as a likely pause, but that pricing is explicitly conditional on soft September data. Treat the current base case as tentative, not settled.
What the yield and inflation signals together tell you about the months ahead
Put the two signals side by side and they do not resolve into a clean hike-or-pause story. They resolve into something you can actually act on: higher for longer.
Whether the Fed moves in October or December, the combination of 5%+ long yields and core PCE at 3.0% points to a monetary environment that stays restrictive well into 2027 on any plausible inflation path. The 10-year’s behaviour, holding in the 5.23-5.30% range through late September, is the market’s live verdict on exactly that narrative.
Both camps acknowledge the risks are asymmetric. Over-tighten into fragile credit and housing markets, and you risk accelerating a downturn. Ease too early, and you risk letting 3-4% inflation settle in as the new normal. Neither error is cheap, which is why the Fed is moving carefully.
Notably for the pivot watchers, US Dollar strength held even after the softer PCE print, a sign markets are pricing persistent tightening rather than a turn.
Cross-asset yield sensitivity played out in real time on 19 August 2026, when a single Treasury buyback announcement pulled longer-dated yields lower and sent spot gold up 4% and Bitcoin up 6% in the same session, illustrating how directly the 10-year now functions as the master variable across non-yielding and speculative assets.
Here is the reframe. If you are fixated on whether October is a hike or a pause, you are asking the wrong question. The one that matters for your positioning is how long rates stay above 5%, and the inflation trajectory over the coming months will answer it. Three things are worth watching:
- The September CPI and PPI outcome, which will confirm or complicate the October pause consensus
- The 10-year yield’s behaviour around those releases, the bond market’s real-time read
- Any shift in Fed official rhetoric before the blackout period
This article is for informational purposes only and should not be considered financial advice. Investors should conduct their own research and consult with financial professionals before making investment decisions. Past performance does not guarantee future results. Financial projections are subject to market conditions and various risk factors. These statements are speculative and subject to change based on market developments.