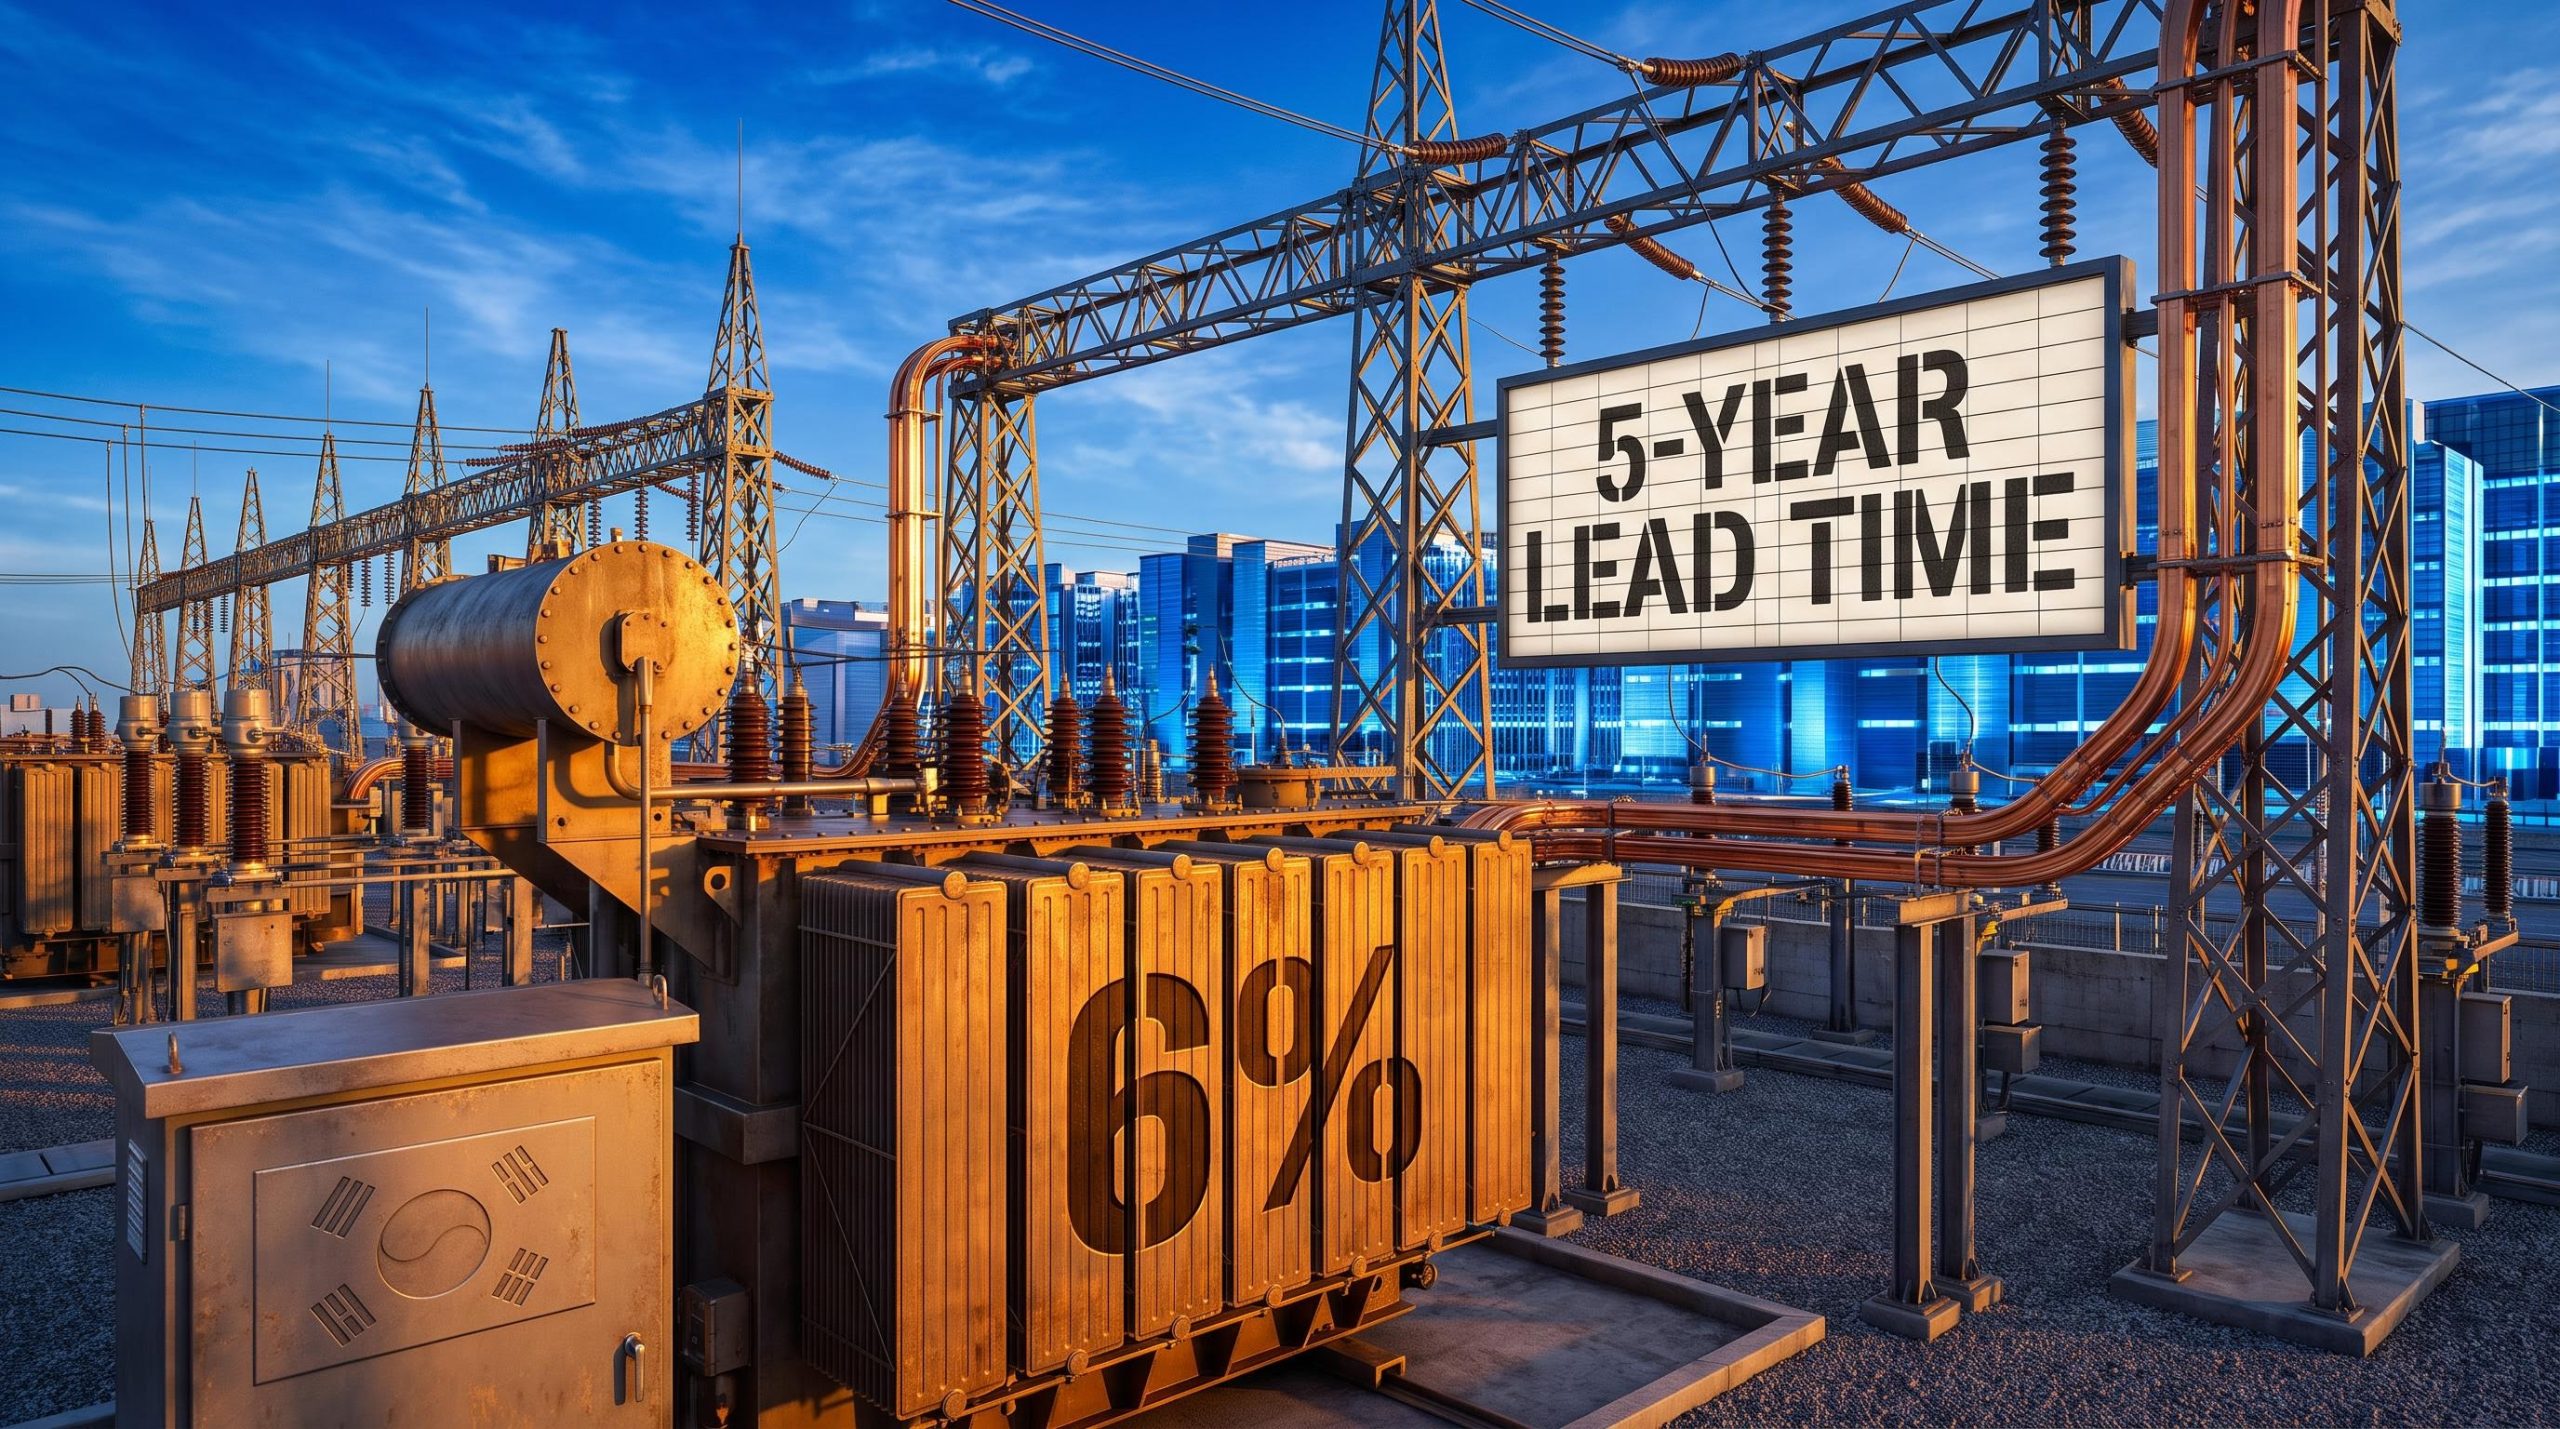
Seoul’s data centre vacancy slipped below 6% in 2024, and in the same window the city’s hyperscale operators were committing to AI-ready racks that demand 70 kW of cooling and triple-feed power resiliency. One number describes a market with almost no room left. The other describes what tenants now need from every square metre of it.
That gap, between what South Korea’s data centre market is being asked to deliver and what its grid can currently supply, is where the real investment story sits.
It is also where capital has started to move in an unexpected direction. Demand has structurally outrun supply, and the overflow is not just lifting data centre operators; it is pulling money toward the electrical, cabling and power-distribution layer sitting beneath them. At Data Centre World Asia 2026 in Singapore (29-30 September 2026), that shift became visible in the specialist infrastructure cohort, with both LS Cable and System and HARTING on the floor.
This analysis maps the practical terrain for investors. It covers which segments of the build-out are generating the most durable capital flows, which structural constraints could compress returns, and where the supply chain opportunity sits relative to the operators themselves.
A market forecast so wide it is itself an investment signal
Start with the headline numbers, because they do not agree, and the disagreement is the point.
According to ResearchAndMarkets and Arizton (January 2026), the South Korea data centre market was worth USD 5.04 billion in 2025 and is projected to reach USD 16.23 billion by 2031, a 21.5% CAGR. Mordor Intelligence scopes the same market at USD 1.65 billion in 2025, growing at a 20.38% CAGR across 2026-2031. The base values differ by more than three times, but that is a function of what each analysis counts and how it segments the market, not one source being wrong.
What matters more is how the growth rates have moved over time. An earlier ResearchAndMarkets release from April 2025 put the market at USD 5.0 billion in 2024, reaching only USD 9.90 billion by 2030 at a 12.06% CAGR. Next Move Strategy Consulting landed in a similar zone with a 17.1% CAGR. The 2026-dated analyses nearly doubled the pace.
That acceleration is the signal. It tells you AI and hyperscale investment arrived faster than analysts expected, and that the forecast spread, from roughly 12% to 21.5%, is not noise to average away. The upside scenario assumes grid expansion and permitting go to plan. The base case already prices in a very fast build-out. Execution risk, not demand uncertainty, is the variable separating the two outcomes.
For infrastructure investors, the physical capacity figures are more useful than the revenue forecasts, because megawatt additions drive procurement directly.
Mordor Intelligence projects IT load capacity to rise from 1.96 thousand MW in 2025 to 6.32 thousand MW by 2030, a 26.29% CAGR. The hyperscale segment alone is forecast to grow at 29.10% CAGR through 2031.
| Source | Base Year Value | Forecast Year | Forecast Value | CAGR |
|---|---|---|---|---|
| ResearchAndMarkets/Arizton (Jan 2026) | USD 5.04B (2025) | 2031 | USD 16.23B | 21.5% |
| Mordor Intelligence | USD 1.65B (2025) | 2031 | USD 5.02B | 20.38% |
| ResearchAndMarkets (Apr 2025) | USD 5.0B (2024) | 2030 | USD 9.90B | 12.06% |
| Next Move Strategy Consulting | USD 1.41B (2023) | 2030 | USD 4.27B | 17.1% |
The takeaway is simple: do not treat any single figure as authoritative. The convergence around rapid growth and the divergence around pace tells you exactly where to concentrate due diligence.
The acceleration visible in South Korea’s revised projections mirrors a broader pattern in global data centre forecasts: Citi more than tripled its 2031 IT load projection to 370 GW in September 2026, citing agentic AI workloads that consume 20-30 times more compute per user than traditional generative AI as the structural force behind the upgrade.
When big ASX news breaks, our subscribers know first
Why South Korea and why now: the structural forces behind the numbers
This is not a standard emerging-market infrastructure story. Three forces are converging, and the build-out has already passed the point where any single setback could reverse it.
The heaviest is AI workload intensity. Mordor Intelligence describes gigawatt-scale commitments from SK Telecom, Amazon Web Services and Digital Realty, all aimed at purpose-built AI campuses able to cool 70 kW racks with triple-feed power resiliency. These are not commercial real estate plays. Hyperscalers and telecom operators are treating capacity as national infrastructure.
The second force is government capital, which functions as a demand backstop rather than just an enabler (covered in detail below). The third is geography: advanced telecom networks, foreign direct investment from global cloud providers, and policy support combine to make South Korea a preferred Northeast Asia hub over regional alternatives, and that preference is now visible in the pipeline.
Look inside the market and you see a structural handover underway. Colocation held 78.94% of revenue in 2025, providing the stable base, while hyperscale grows at 29.10% CAGR. These two are not competing. Colocation operators absorb hyperscaler demand as it scales, with the colocation market itself forecast to expand from USD 1.95 billion in 2025 to roughly USD 4.24 billion by 2030, according to GlobeNewswire (April 2026).
New capital is arriving to meet that demand. Recent entrants include:
The gigawatt-scale commitments from SK Telecom, AWS and Digital Realty in South Korea sit within a far larger global envelope: hyperscaler capital expenditure from Amazon, Microsoft, Alphabet and Meta alone reached $130 billion in Q1 2026, with full-year 2026 combined guidance approaching $725 billion, a spending trajectory that makes South Korea’s capacity pipeline credible even at the upper end of the CAGR range.
- Empyrion Digital
- DCI Data Centers
- OneAsia Network
- ST Telemedia Global Data Centres
- STACK Infrastructure
What this tells you is that demand here is insulated from single-operator or single-sector risk. The spread of entrants and the colocation-to-hyperscale handover mean no one tenant or segment carries the market. But the policy component introduces a distinct regulatory sensitivity that purely commercial markets do not have, which is worth understanding before you weight these infrastructure plays.
Government policy as demand backstop, not just enabler
The Ministry of Science and ICT (MSIT) has reportedly allocated over KRW 58.2 trillion in digital infrastructure investment through 2025, according to Persistence Market Research. This figure is not independently verified in the current source set, so treat it as directional rather than precise.
The analytical point holds regardless of the exact number. Government commitment reduces demand-side uncertainty for infrastructure investors, giving the sector a floor that pure-commercial markets lack. What it does not do is eliminate supply-side execution risk, which is where the real bottleneck lives.
Where the supply chain opportunity actually sits: cable, busduct and power distribution
Here the analytical lens shifts one layer down, away from operators and developers, toward the specialist manufacturers who supply them. The appeal of this layer is structural: it compounds with every megawatt added, regardless of which operator wins the site.
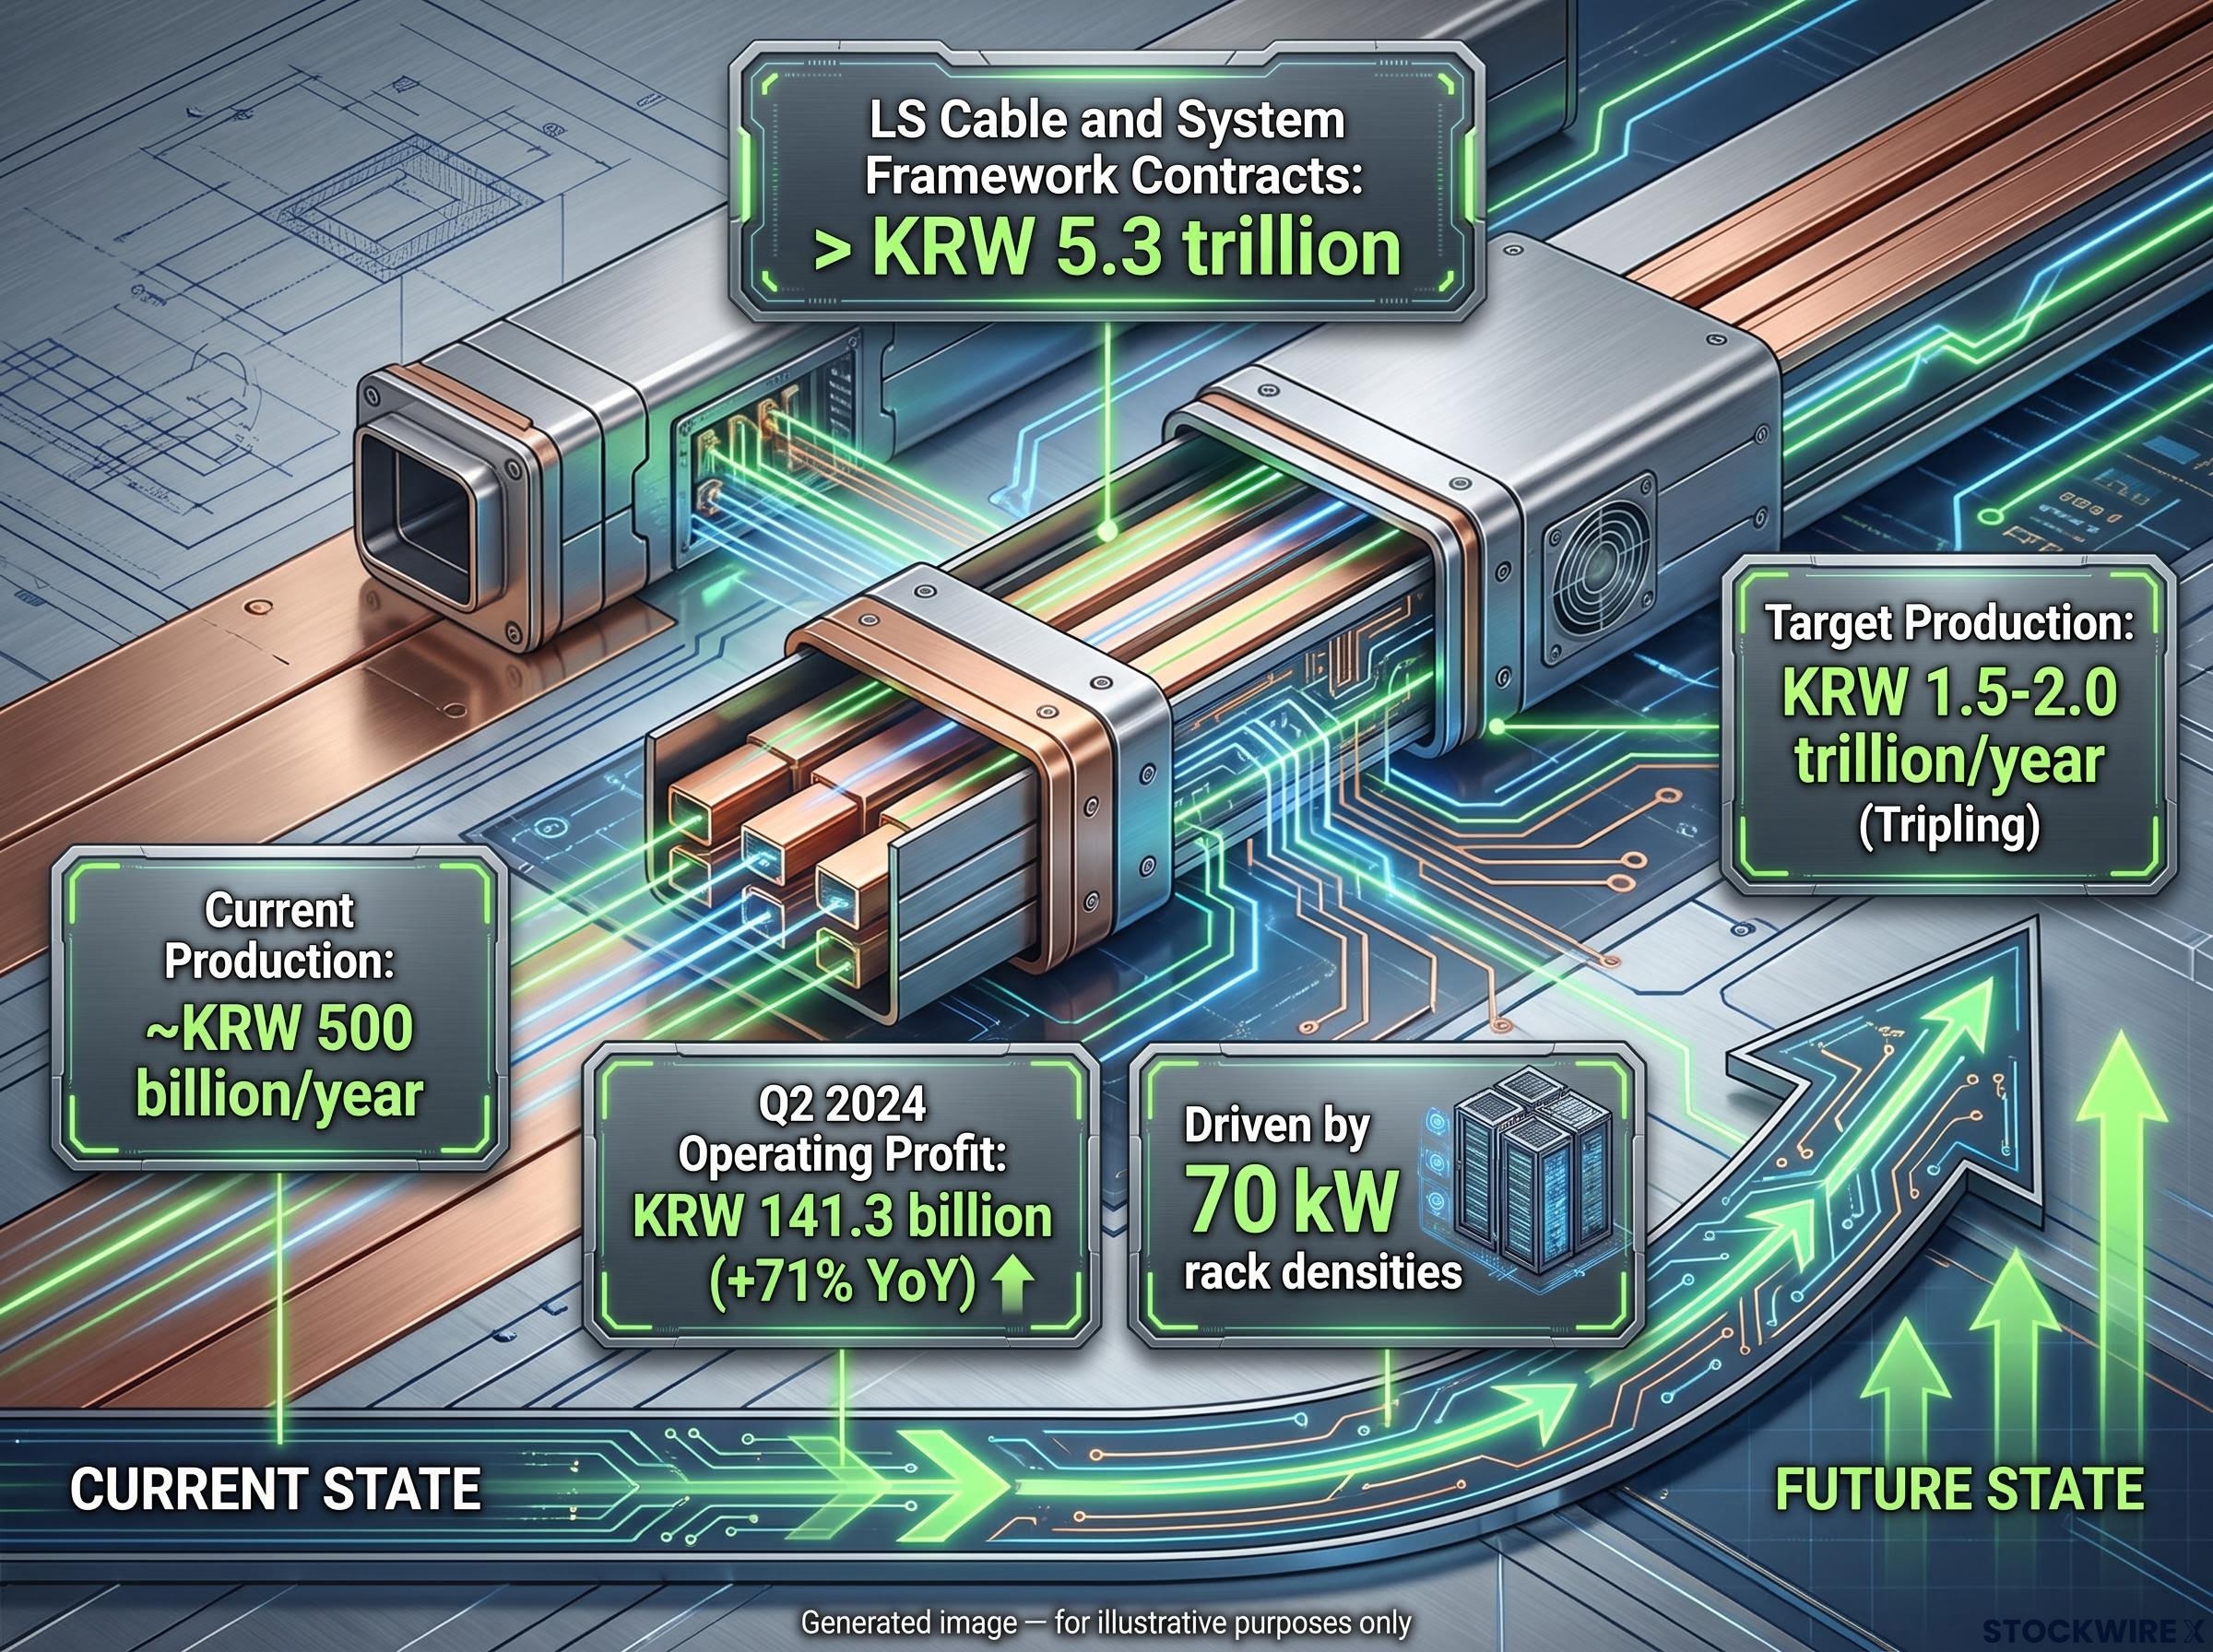
LS Cable and System is the clearest case study. The company has signed long-term framework contracts worth more than KRW 5.3 trillion for busduct supply to US big tech data centres, and plans to expand busduct production from roughly KRW 500 billion in annual output to KRW 1.5-2.0 trillion, effectively tripling capacity.
LS Cable and System’s aggregate busduct framework contracts exceed KRW 5.3 trillion, according to LS Corporation’s Q2 2026 summary.
Busduct is worth understanding before the investment case lands. A busduct, or busway, is a prefabricated metal enclosure housing conductors that distribute electrical power through a building. In a data centre, it carries large volumes of power from the main supply to the server racks more efficiently and flexibly than traditional cabling. As rack densities climb toward the 70 kW levels Mordor cites, the power distribution hardware inside each facility becomes more sophisticated and higher in value per megawatt installed.
That is the compounding mechanism. More capacity means more busway, and denser racks mean more valuable busway per unit of capacity. Revenue scales twice over.
HARTING sits alongside LS Cable in this cohort, supplying electrical and electronic connectivity rather than power distribution, a complementary position. Both companies attended Data Centre World Asia 2026 at Marina Bay Sands in Singapore on 29-30 September 2026, which signals how the specialist infrastructure layer is positioning for Asia-Pacific growth, though no joint agreement emerged from the event.
| Metric | Current Figure | Target/Change |
|---|---|---|
| Aggregate busduct framework contracts | More than KRW 5.3 trillion | Multi-year |
| Annual busduct production (current) | ~KRW 500 billion/year | Baseline |
| Annual busduct production (target) | KRW 1.5-2.0 trillion/year | Tripling |
| Q2 2024 operating profit | KRW 141.3 billion | +71% YoY |
The capacity tripling plan, read alongside the framework structure, tells you something specific. Specialist busduct suppliers have moved from transactional vendors to embedded long-term partners, and production scale is now the binding constraint on how much of the AI build-out they can capture. If you focus only on operators and colocation developers, you are overlooking the layer where capital intensity per megawatt and multi-year contracts create more predictable revenue than site-level development.
Seoul’s grid ceiling and the regional reallocation of capital
The constraint that could compress all of these returns is physical, and it is concentrated in Seoul.
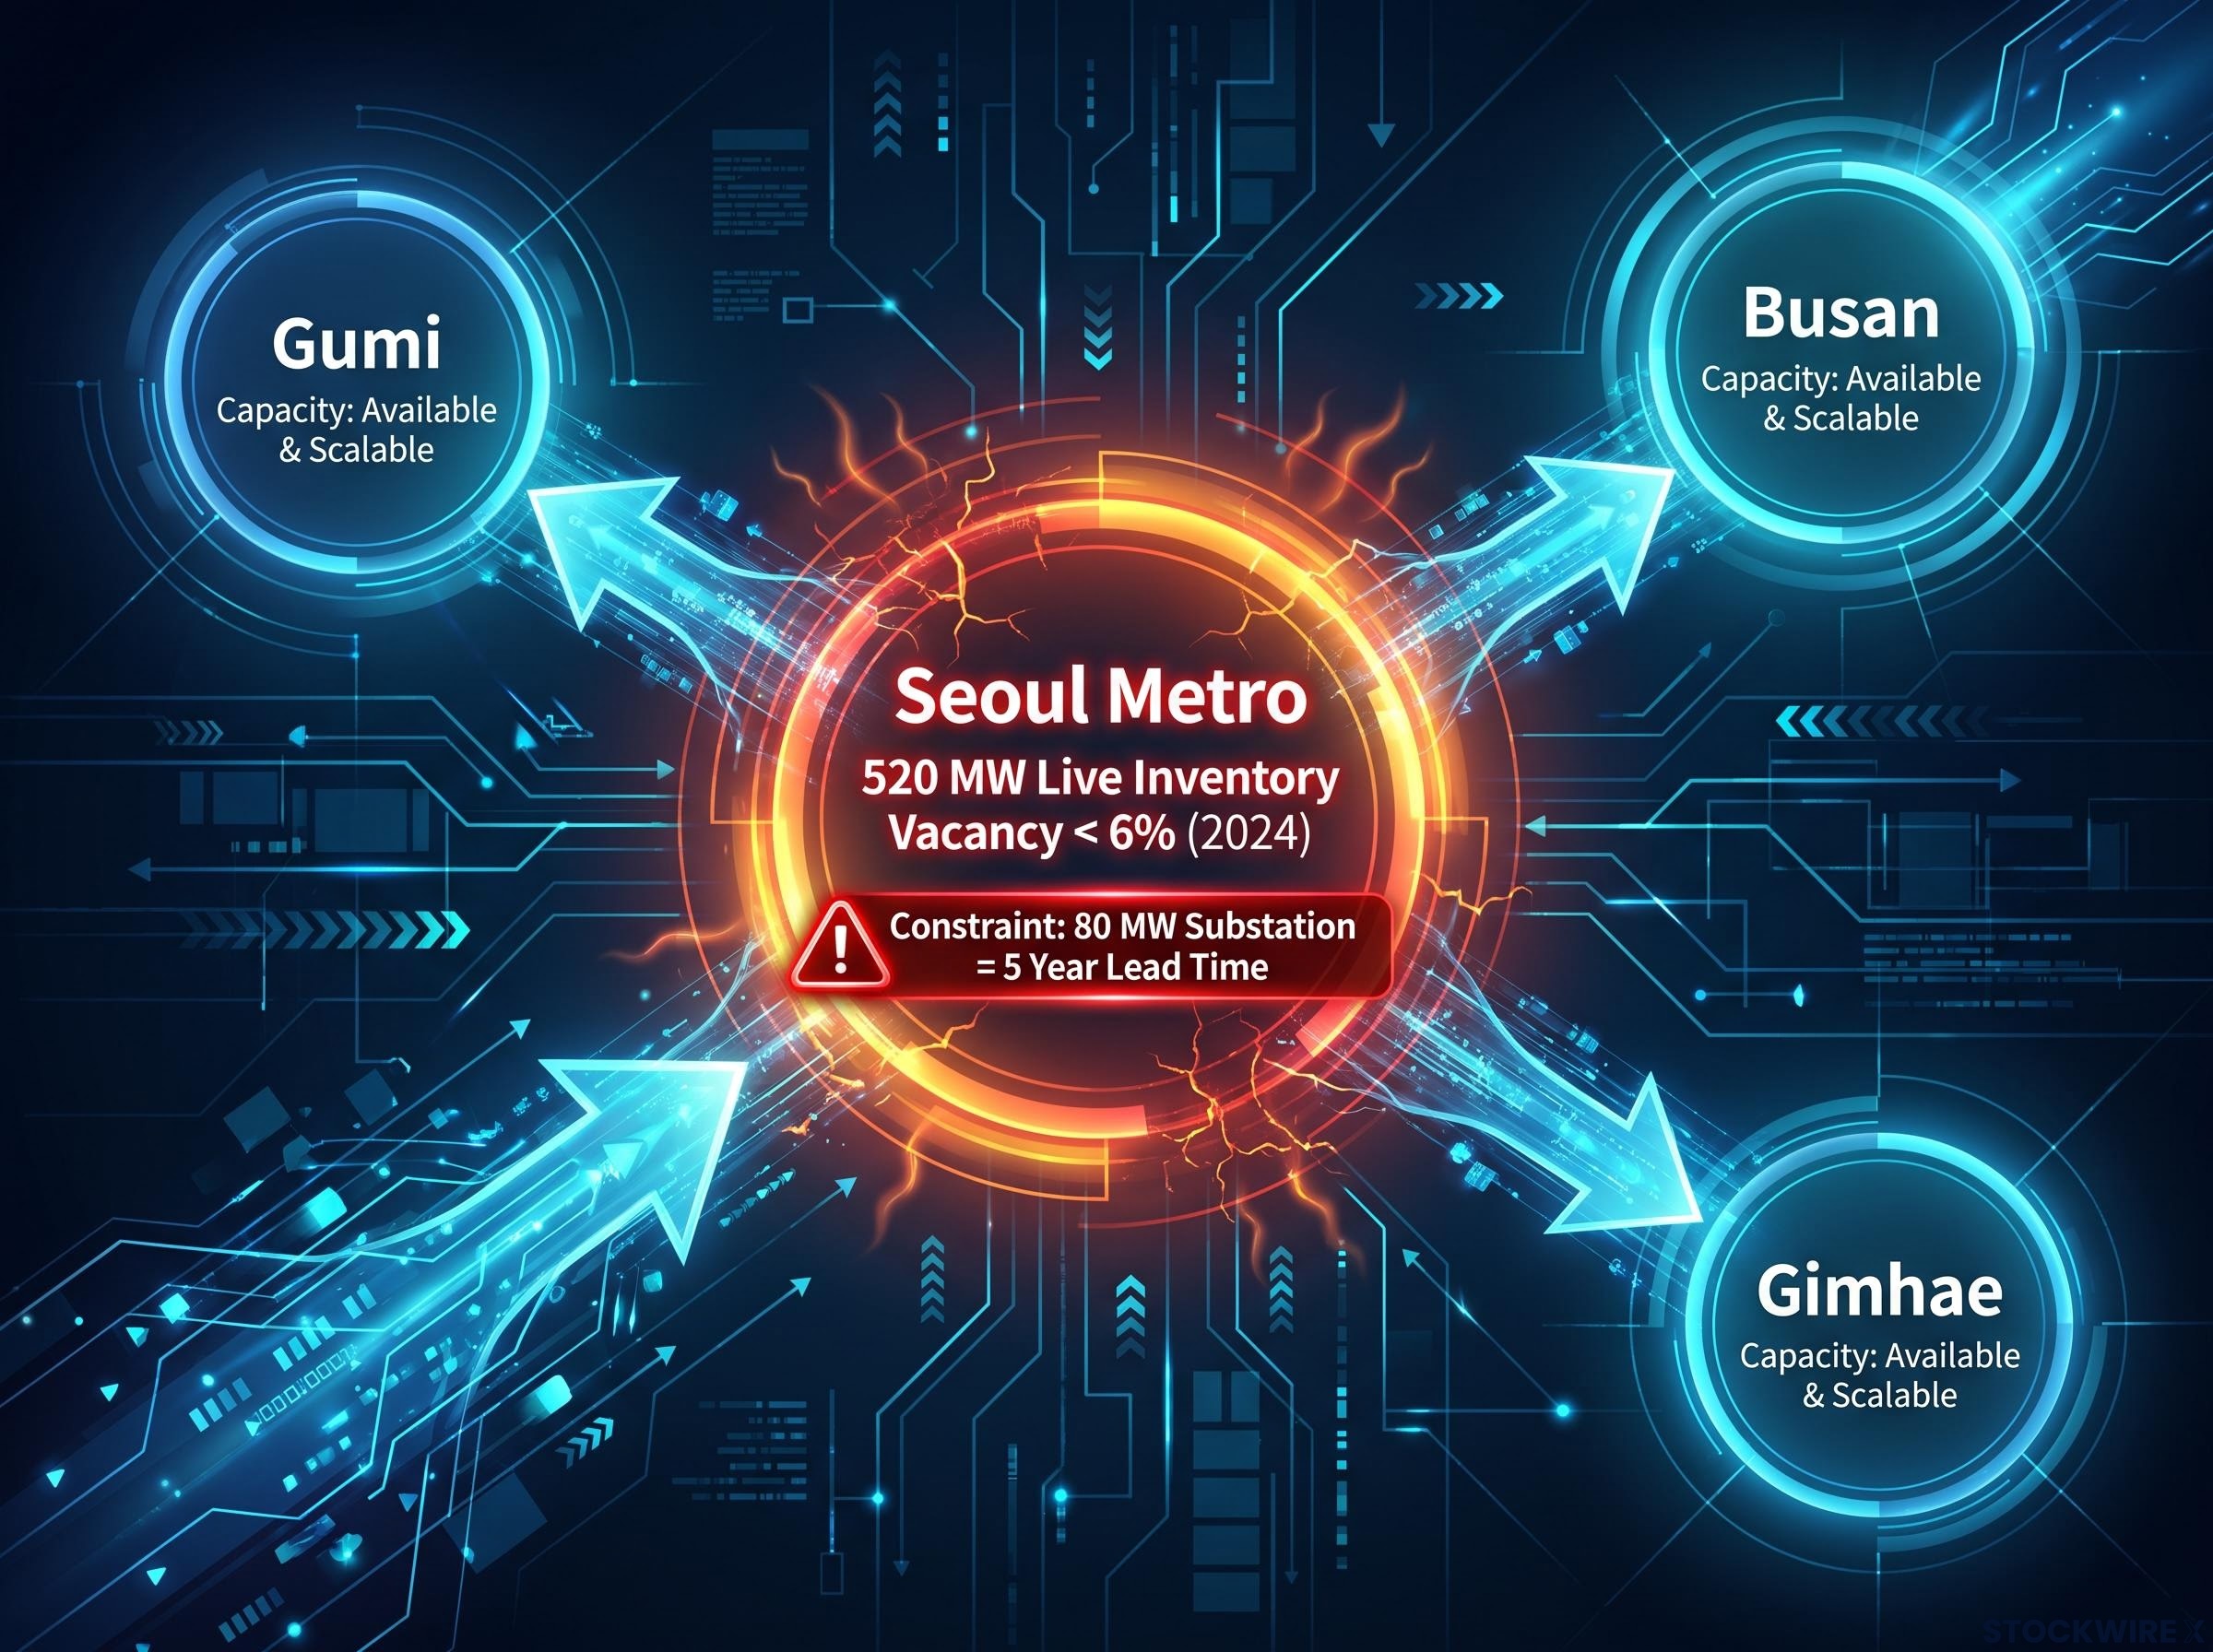
The metro area holds roughly 520 MW of live inventory, with vacancy below 6% in 2024 and record land prices in Digital Media City, according to Mordor Intelligence. The binding bottleneck is power: a new 80 MW substation takes approximately five years to complete. That single timeline is the most acute obstacle to hyperscale delivery in the metro, because it governs how quickly committed capital becomes operational capacity.
A peer-reviewed KEPCO grid expansion analysis published in January 2026 found that transmission and substation projects in the Seoul Metropolitan Area have been chronically delayed by an average of 3.5 years due to NIMBY opposition, a finding that gives the five-year substation lead time cited by Mordor Intelligence an independently verified structural basis rather than a planning estimate.
For investors, that five-year lead time is not background detail about Korean grid planning. It is a direct limit on the conversion of hyperscaler commitments into live megawatts, and it argues for a longer investment horizon than the headline CAGR figures suggest.
Goldman Sachs independently identifies power availability as the primary constraint across all major data centre markets, projecting worldwide data centre power consumption to be 170% higher in 2030 than in 2025, a figure that contextualises why Seoul’s five-year substation lead time is not an isolated local problem but a local expression of a global supply-side bottleneck.
The response is a structural shift, not a stopgap. Development is moving to secondary cities where land is cheaper and permitting simpler:
- Busan: industrial estate capacity and lower land costs, offset by greater distance from metro-latency workloads.
- Gimhae: simpler permitting and available land, with connectivity trade-offs for latency-sensitive services.
- Gumi: cheaper industrial sites, balanced against the latency and connectivity constraints of a non-metro location.
What the regional pipeline means for infrastructure procurement
Each secondary-city project needs power it cannot simply plug into. That means substation construction, transmission upgrades and grid reinforcement, which are themselves procurement opportunities for electrical infrastructure specialists.
This is where the constraint flips into a signal. LS Cable’s Q2 2024 operating profit of KRW 141.3 billion, up 71% year-on-year, was attributed in part to power-grid reinforcement work. Grid reinforcement benefits cable and busduct suppliers through a demand channel that runs parallel to, and partly independent of, data centre site development itself.
So the grid ceiling cuts both ways. It is a risk to project timelines and a revenue signal for power-grid infrastructure suppliers at the same time. Mapping where that reinforcement concentrates over the next three to five years tells you where procurement activity will cluster.
What the data tells you before committing to South Korea’s infrastructure story
This is a decision framework, not a verdict. Three variables have to be held in mind at once before the headline CAGR can be treated as a return proxy.
The first is grid-connection timing. The five-year substation lead time is the binding constraint, and it determines how fast committed capital turns into operating capacity. The second is policy dependency: MSIT funding acts as a demand backstop, but it also introduces regulatory sensitivity that commercial-only markets avoid. The third is forecast variance.
The 12.06% to 21.5% CAGR spread does not encode demand uncertainty. It encodes execution risk, the question of whether grid and permitting constraints can be cleared fast enough.
Different positions in the market stack carry different risks. Hyperscaler operators and colocation developers sit with site-level development and grid-connection exposure. Specialist manufacturers like LS Cable carry production-scaling risk instead, but benefit from multi-year framework agreements that deliver revenue visibility across multiple operator clients simultaneously. The structural composition, colocation at 78.94% of revenue with hyperscale growing at 29.10% CAGR, confirms a stable base under a fast-growing top layer.
The decision-relevant insight is not which forecast to believe. It is which constraint resolves first. If grid expansion proceeds on schedule, the higher CAGR scenario becomes credible and supply chain revenue timelines hold. If it slips, the lower projections prove accurate and those timelines extend.
Here is the watch-list that will show you which way it is going over the next 12-24 months:
- Grid expansion progress in Seoul and the secondary cities of Busan, Gimhae and Gumi.
- Hyperscaler commissioning pace against stated capacity timelines.
- MSIT policy continuity, including any revision to the digital infrastructure mandate.
Investors who treat grid expansion as a leading indicator, rather than waiting for forecast providers to revise their numbers, are better positioned to time exposure to both operators and supply chain companies. LS Cable’s decision to triple production is, in effect, that bet already being placed.
For investors wanting to act on the infrastructure thesis through listed equities, our dedicated guide to investing in South Korean stocks covers KRX access mechanics, currency risk from KRW exposure, and the chaebol governance structures that affect how operators and suppliers like LS Cable are priced relative to global peers.
This article is for informational purposes only and should not be considered financial advice. Investors should conduct their own research and consult with financial professionals before making investment decisions.
Past performance does not guarantee future results. Financial projections are subject to market conditions and various risk factors, and forward-looking statements are speculative and subject to change based on market developments.