On Wednesday, the ASX 200 gained 0.9%. By Thursday, it had lost 1.73%. In two consecutive sessions, the market celebrated the end of the rate-hiking cycle and then erased every point of that celebration.
The reversal did not come from nowhere. By 25 September 2026, the index had already shed more than 4% for the month, caught in what the Australian Financial Review called an inflation panic. Wednesday’s bounce, driven by a softer-than-expected inflation reading and a dovish turn from the Reserve Bank, looked like the moment the pressure finally lifted.
Then Thursday arrived. The index fell back to its lowest level since 10 June 2026 and into negative territory for the calendar year.
The deeper story here is why Wednesday’s optimism was structurally fragile from the start. The bond market was sending one signal while the equity market briefly priced another, and the gap between them is where the whole reversal lived. What follows unpacks that gap: the 48-hour sequence, the mechanism connecting yields to share prices, what the inflation data genuinely settled, and what the real debate among Australia’s major bank economists means for how you position from here.
Two sessions, one brutal lesson from the bond market
The sequence that played out across 30 September and 1 October reads almost like a logic problem that solves itself in reverse.
It started at 11:30 am AEST on 30 September, when the Australian Bureau of Statistics released August inflation data that came in marginally softer than forecast. The ASX 200, already up around 0.2% heading into the print, climbed toward 1% by midday. Governor Michele Bullock’s post-meeting commentary, read by traders as a signal that the September hike could be the last, reinforced the mood. The index closed up roughly 0.9% at 8,789.3.
The rally wore its logic on its sleeve. The sectors that led were exactly the ones that move first on any dovish signal: the rate-sensitive, long-duration names.
But look at what the bond market did while equities celebrated. The Australian 3-year yield dipped as much as 7 basis points intraday to 4.87%, then closed higher at 4.95%. In the US, the policy-sensitive 2-year Treasury yield dipped to 4.82% and finished at 4.87%. US 10-year and 30-year yields pushed to fresh multi-decade highs across both sessions.
That is the analytical core of this story. Short-term yields in both countries ended Wednesday higher than where they started, even as equities rallied on a dovish read. The professional bond market, in other words, did not buy the story the equity market was pricing. When the bond market refuses to validate a dovish rally, that rally is borrowed time.
Thursday collected on the debt. The ASX 200 fell 152 points, or 1.73%, its steepest single-session drop since March 2026, erasing Wednesday’s gain entirely.
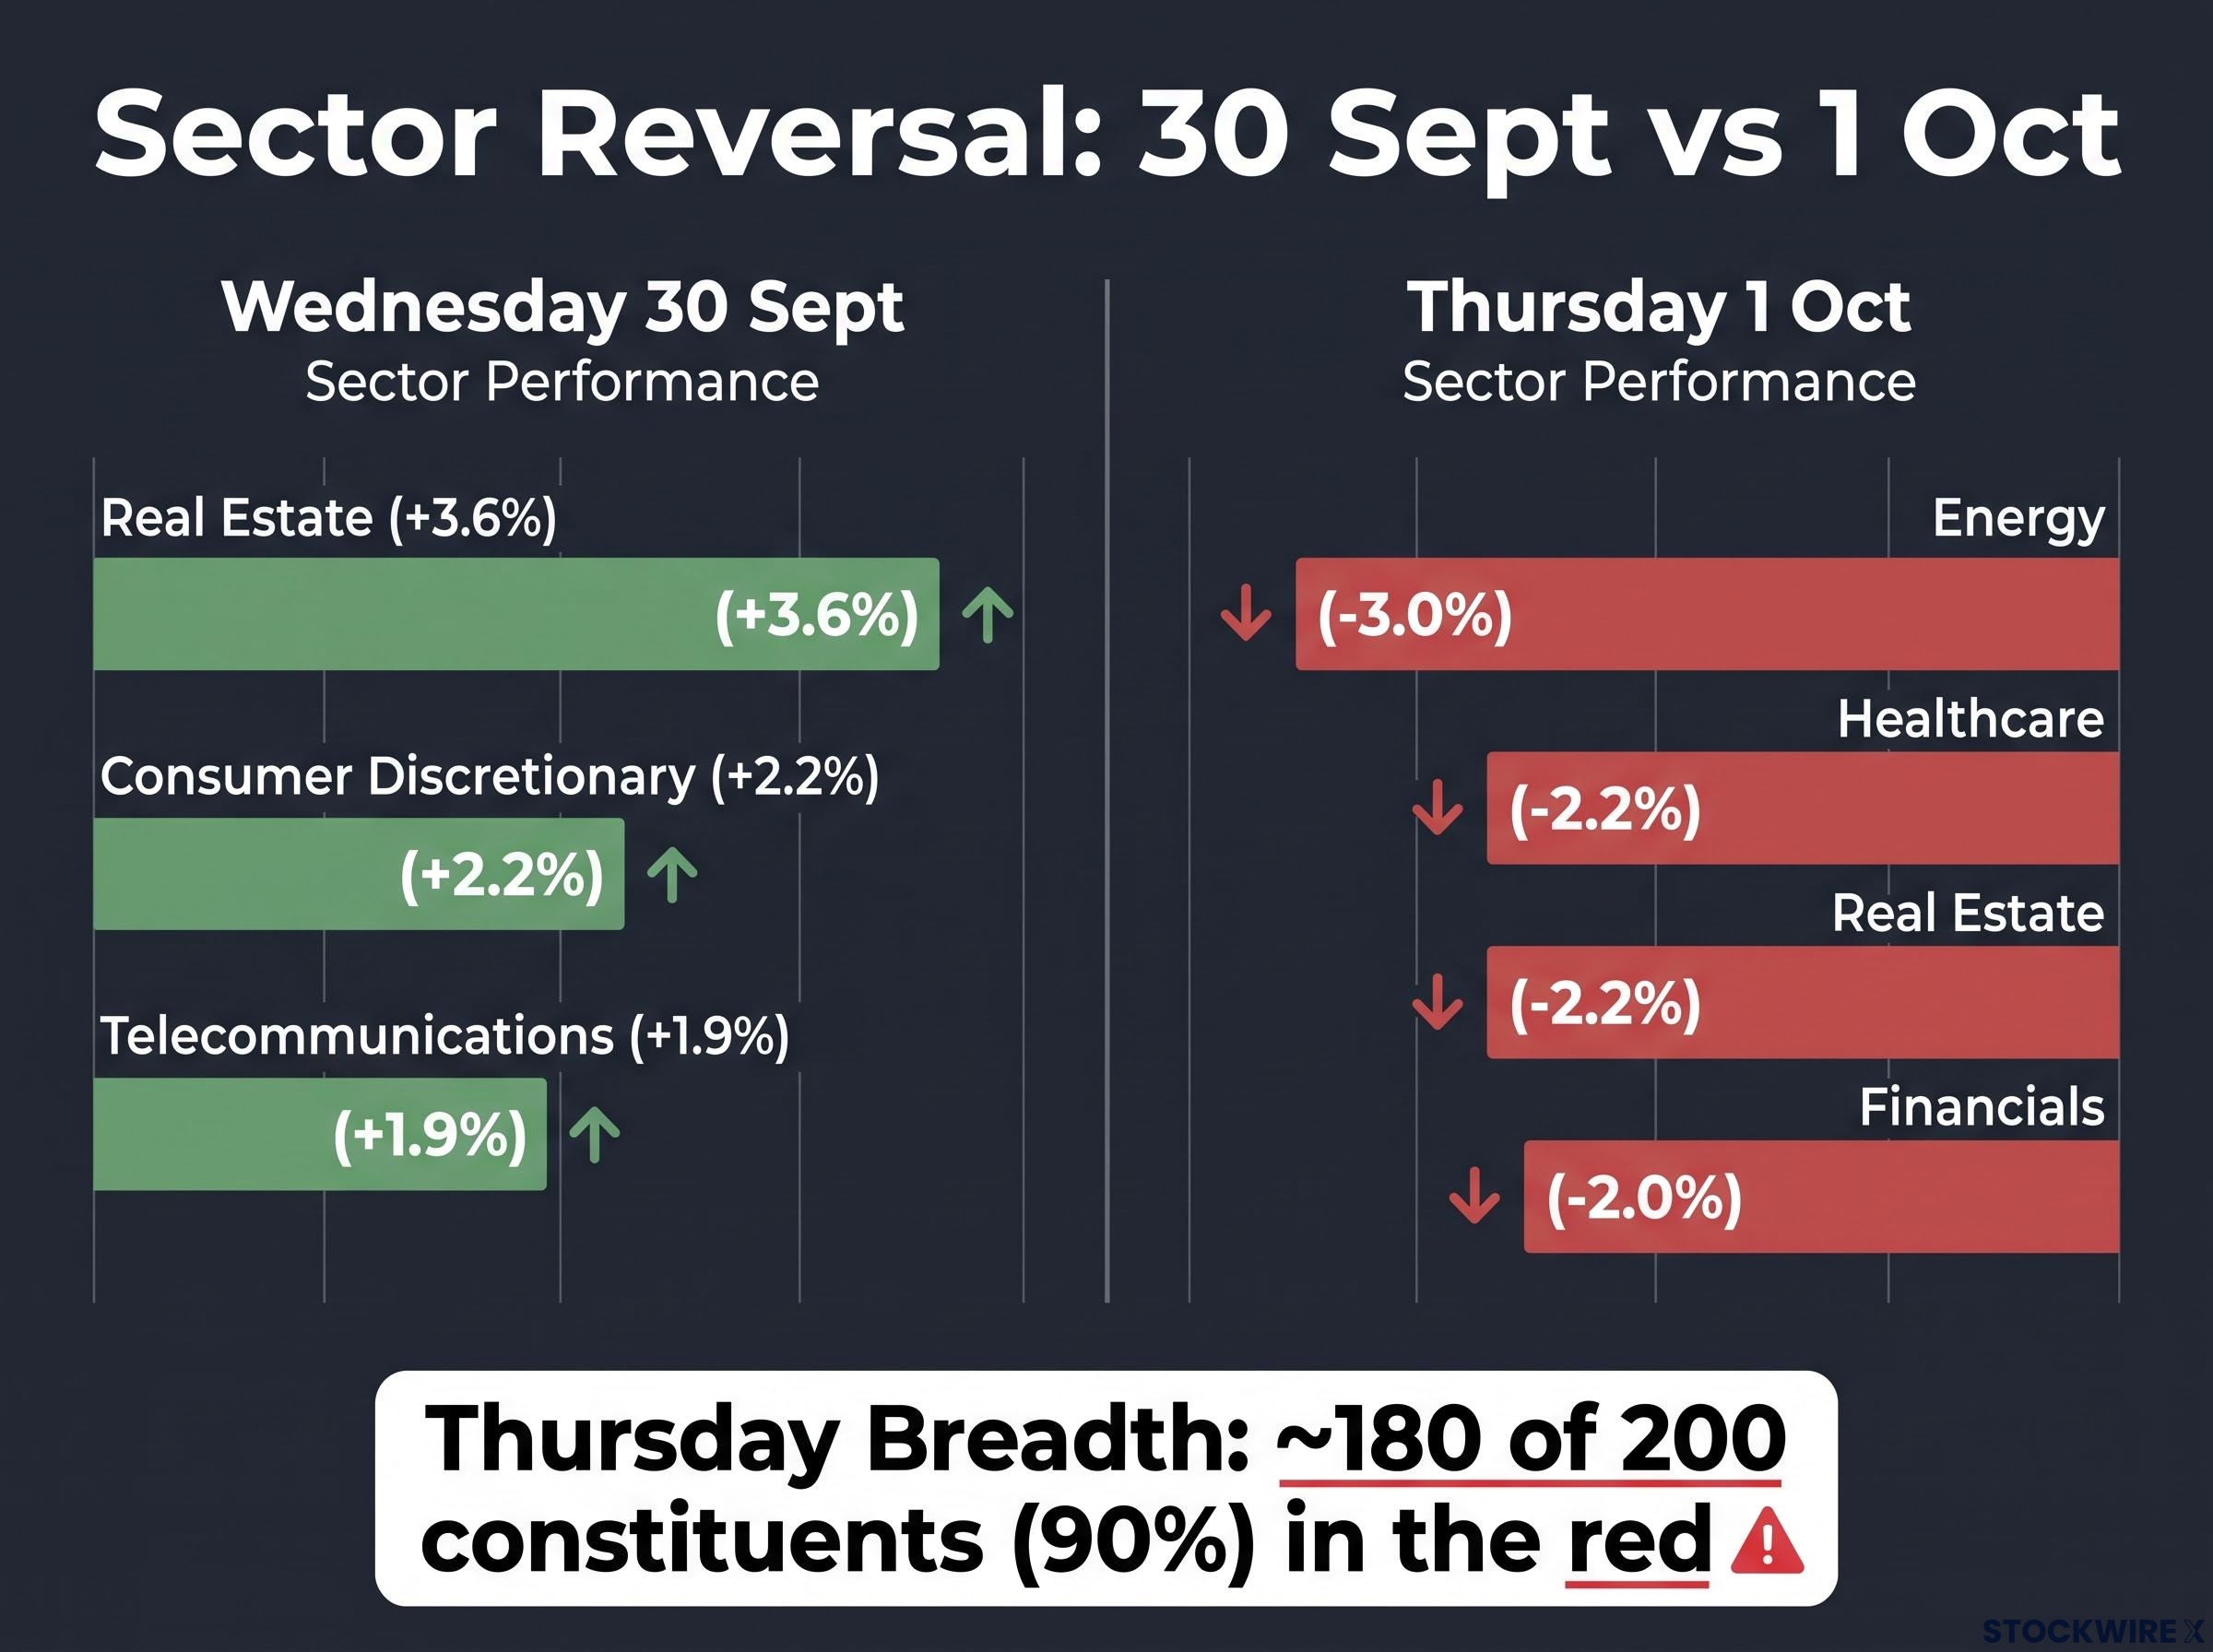
Market breadth was brutal: roughly 180 of the 200 constituents, around 90% of the index, finished in the red, with losses across every single sector.
| Sector | Wednesday 30 Sept | Thursday 1 Oct |
|---|---|---|
| Real Estate | +3.6% | -2.2% |
| Consumer Discretionary | +2.2% | Lower |
| Telecommunications | +1.9% | Lower |
| Energy | Mixed | -3.0% |
| Healthcare | Mixed | -2.2% |
| Financials | Mixed | -2.0% |
For anyone trading on RBA tone alone, the lesson is uncomfortable but clear. If the bond market does not confirm the dovish read, rate-sensitive rallies are a trap, not a trend.
The sector table from 30 September and 1 October mirrors a pattern visible across the 2022 cycle: ASX sector performance in rising-rate environments has consistently separated materials and energy from real estate and technology, with the spread between those groupings exceeding 50 percentage points over FY25-26.
When big ASX news breaks, our subscribers know first
How rising bond yields drain value from Australian equities
So why does a yield ticking higher on a screen in New York translate into a lower share price in Sydney? The connection runs through two channels, and understanding both is what separates reacting to a sell-off from reading it.
- The discount rate channel. When bond yields rise, the present value of a company’s future earnings falls mechanically. Investors value a stock partly by estimating its future cash flows and discounting them back to today using prevailing interest rates. Higher rates mean a bigger discount, and the effect is harshest for companies whose profits sit furthest in the future.
- The funding cost channel. Elevated yields raise the actual cost of borrowing for companies. That compresses margins and dampens growth expectations, a real-economy drag that sits on top of the valuation maths.
The Australian 10-year government bond yield sat at approximately 5.35% at the end of September, among the highest in the developed world. The cash rate stood at 4.60%, second-highest among developed economies.
The 10-year yield near 5.35% reads as alarming against the post-GFC era, but ASX bond yields history stretching back to 1990 shows the 5% level was present in 27.1% of all weekly observations, making it the most frequently occurring yield environment on record rather than a genuine outlier.
Here is what that 5.35% figure actually means for your holdings. Every valuation model for growth and income assets in Australia is now being recalculated with a meaningfully higher discount rate than investors applied as recently as 2023, and that recalibration is not finished. The AFR’s early-September reporting made the mechanism visible, linking US equity weakness directly to higher oil and bond yields, with ASX banks and health stocks leading declines.
Why REITs and healthcare stocks feel the pain first
Real estate and healthcare are the clearest Australian illustrations of long-duration, rate-sensitive sectors, and the Wednesday-to-Thursday swing in property proved it in real time: up 3.6%, then down 2.2%.
Real estate investment trusts (REITs) carry a double exposure. Their valuations depend on cash flows stretching far into the future, which get hit hardest by rising discount rates, and they face direct debt refinancing and servicing costs, particularly those reliant on wholesale funding markets. When yields spike, both pressures land at once.
The Wednesday-to-Thursday swing in property confirmed in real time what the rate transmission channels for REITs make structurally predictable: rising yields compress valuations through the discount rate effect and simultaneously raise refinancing costs, with both pressures landing on the same balance sheet at the same moment.
Healthcare firms face a different squeeze. Many operate with regulated or government-funded revenue streams that cannot be repriced quickly, so when financing costs climb, margins compress with little room to pass the cost through. On Thursday, healthcare fell 2.2%, the empirical confirmation of exactly this sensitivity.
If you hold REITs, healthcare names, or any long-duration equity, the bond yield level is not background noise. It is the primary variable deciding whether today’s prices are fair or still expensive in a world where 5%-plus risk-free rates persist.
What Australia’s inflation data actually settled and what it left open
You might have arrived thinking the CPI print was the hinge of this whole story. It partly was. But the data was soft enough to celebrate and not soft enough to resolve anything.
The August figures, released 30 September 2026, told a mixed tale. Headline CPI rose 0.4% month-on-month, below the 0.5% estimate, landing at 4.0% year-on-year, just under the 4.1% forecast. The trimmed mean, the RBA’s preferred core measure that strips out volatile items, rose 0.2% on the month and held at 3.6% year-on-year.
The ABS August 2026 CPI release confirmed headline inflation at 4.0% year-on-year and a trimmed mean of 3.6%, both readings that sit materially above the RBA’s 2-3% target band and give the central bank documented grounds to consider further tightening.
Both sit well above the RBA’s 2-3% target band. And the critical detail is buried in that trimmed mean figure.
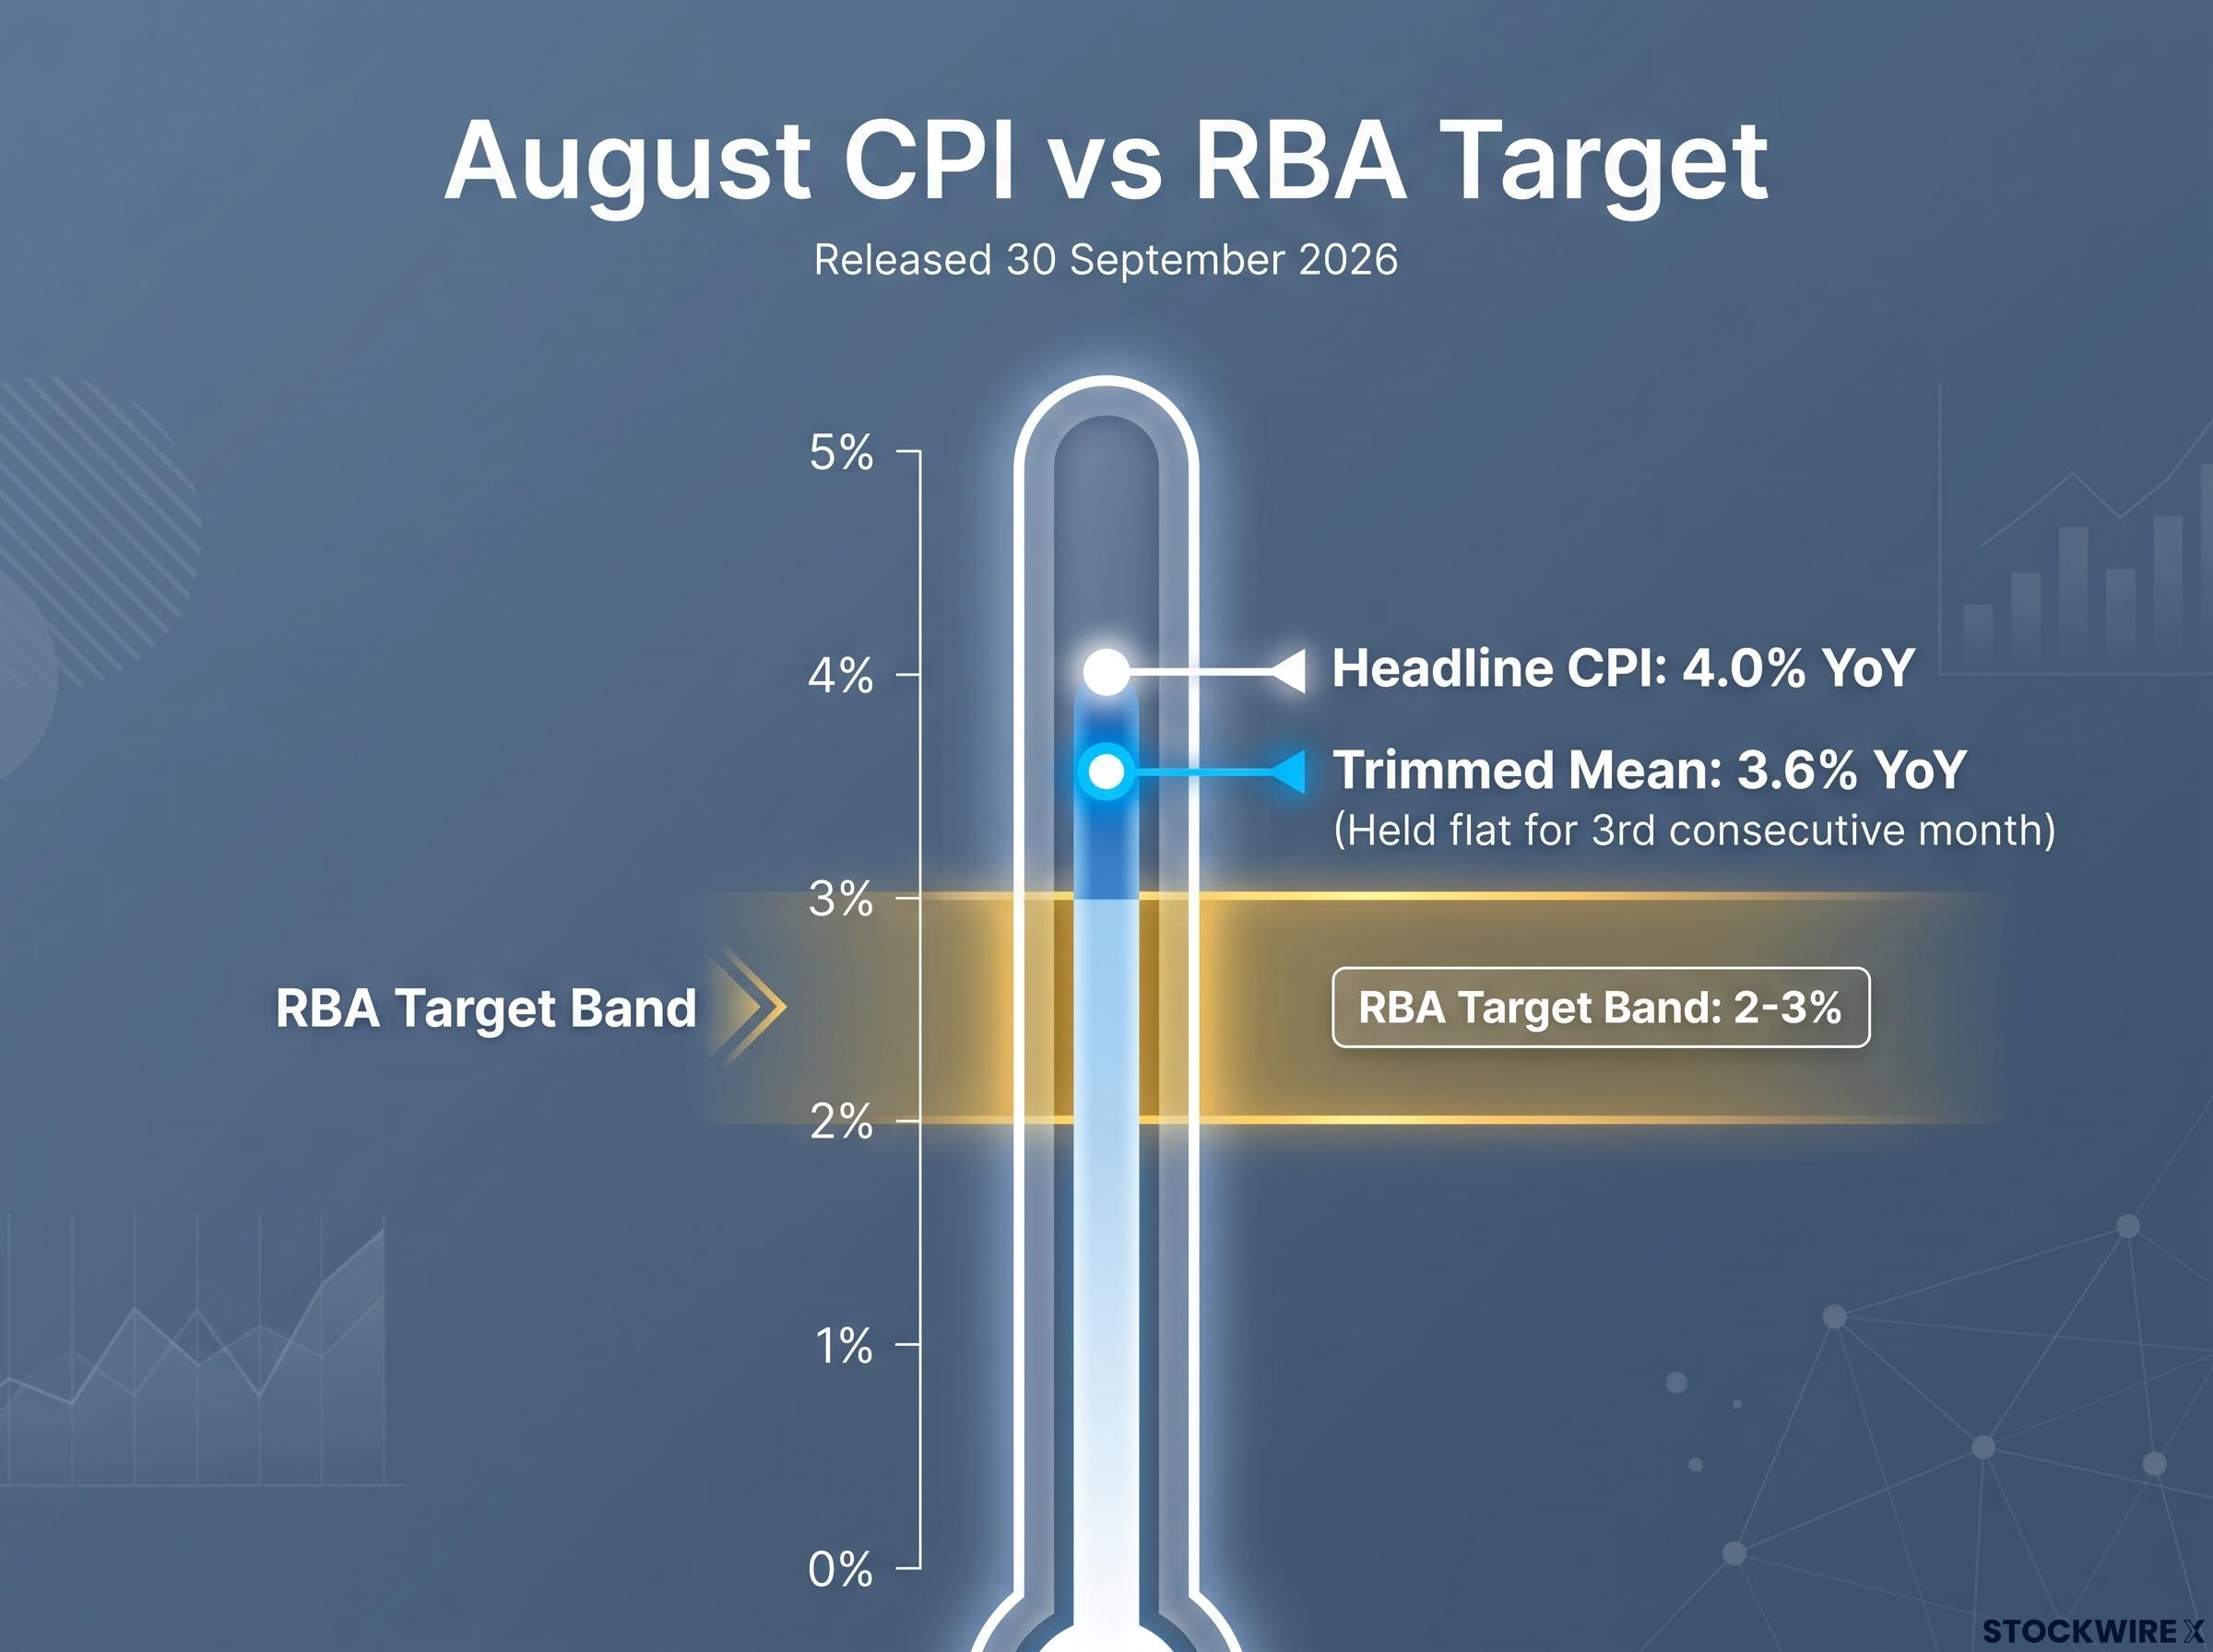
The trimmed mean has now held flat at 3.6% for a third consecutive month. That is not disinflation proceeding. It is disinflation pausing, 60 basis points above the top of the target band.
That stall is precisely why Australia’s major bank economists refused to declare the cycle over, even as the Governor hinted at a pause. The debate among them is genuine.
| Institution | November hike view | Terminal rate | Rationale |
|---|---|---|---|
| Westpac | Base case | Above 4.60% | Low bar for follow-up if energy costs persist |
| ANZ | Expected | 4.85% | September not viewed as terminal |
| CBA | Risk flagged | Near peak | “Door open to further increases” |
| NAB | Cautious | 4.60% post-September | No November hike projected, cautious tone |
Against the bank desks sits Governor Bullock’s “could be the last” signal, the most senior official statement on the rate path. The RBA’s cash rate stood at 4.60% after the September hike, effective 30 September 2026.
This debate is not academic for your portfolio. Whether the RBA moves again in November directly determines the pressure on household balance sheets, the cost of corporate debt, and whether the market’s current “near the peak” pricing is correct or premature.
Dual risks for investors: further tightening versus an overshoot sell-off
The honest reading of this environment is that the risks run in both directions, and holding that complexity matters more than forcing a verdict.
The bear case is straightforward. If energy prices and geopolitical pressures do not ease, Westpac’s November hike base case and ANZ’s 4.85% terminal rate are live possibilities. With headline inflation at 4.0% and the trimmed mean stalled, the RBA has clear grounds to act again.
The counter-case deserves equal weight.
- Bear case: November hike as Westpac’s base case; ANZ’s 4.85% terminal forecast; inflation above target across both measures; housing and fuel costs still elevated.
- Counter-case: A second consecutive quarterly gain of +0.12% despite a monthly decline of 3.2-3.9%; softer-than-forecast August CPI; Bullock’s “could be the last” signal as the most senior official statement on the cycle.
The ASX 200 fell roughly 6.5% from its 6 August record high to late September and sat at approximately -1.4% year-to-date through 30 September, its lowest since 10 June. Yet underneath the monthly and yearly losses, that quarterly gain held.
Governor Bullock signalled the September hike “could be the last,” the senior official counterpoint to the bank economists’ conditional hawkishness.
That quiet quarterly gain is the structural point you should not dismiss. It suggests the market absorbed a significant rate shock and still delivered a positive three-month return, which matters for how aggressively defensive positioning makes sense at these levels.
Two variables will decide which scenario unfolds: the subsequent monthly CPI prints, particularly whether the trimmed mean finally breaks below 3.6%, and the trajectory of global bond yields, especially US long-dated rates. Treating this as purely bearish or purely a buying opportunity both rely on an incomplete picture.
What the correction changes, and what it does not
Strip away the two-day drama and the September-October volatility resolves into something coherent. This was not irrational noise. It was a market correctly processing the realisation that rates will stay higher for longer than August optimism had priced, and that recalibration carries real valuation consequences.
What has durably changed is the yield environment itself. A 10-year yield near 5.35% and a cash rate of 4.60%, second-highest in the developed world, mean discount rates for Australian equities are structurally above the 2020-2022 era. That calls for a reset in expected returns, not a wait for rates to snap back quickly.
What has not changed is the long-term earnings trajectory of genuinely quality businesses, nor the RBA’s eventual endpoint once inflation gives it permission to reverse course.
The practical value here is distinguishing structural change from cyclical noise. That distinction tells you where duration risk warrants active management and where short-term volatility simply rewards patience. Here is the watch list that will settle it:
Investors wanting to map these dynamics onto a concrete portfolio framework will find our full explainer on ASX sector positioning for 2026, which identifies which sectors carry structural support and which face persistent headwinds as the market demands hard evidence over hopeful rate-cut narratives.
- The November RBA meeting, the next scheduled policy decision point.
- The subsequent monthly CPI prints, especially whether the trimmed mean breaks below 3.6%.
- The trajectory of global bond yields, particularly US long-dated rates.
This article is for informational purposes only and should not be considered financial advice. Investors should conduct their own research and consult with financial professionals before making investment decisions.
Past performance does not guarantee future results. Financial projections referenced here are the views of the cited institutions and are subject to market conditions and various risk factors.