


Artificial intelligence has owned the headlines for three years. The mega-cap tech trade, the data centre boom, the race to build ever-larger models: this is the story most investors still think they need to track. It is not the only one that matters anymore.
Beneath the noise, a quieter reshuffling of global capital is already well underway, and it has nothing to do with the next chip launch. Money is flowing into the parts of the market investors learned to ignore: banks, miners, energy producers, international shares, and government bonds.
The catalyst is simple. In mid-September 2026, the U.S. 10-year Treasury yield pushed above 5% for the first time since 2007, and that single number has rewritten the math of investing. When safe government debt pays 5%, highly concentrated portfolios built around long-dated tech promises face real pressure, and sectors left for dead suddenly look alive.
What follows here is a practical framework for understanding how rate-driven asset pricing actually works. You will learn to spot the new winners and losers in a sustained high-yield world, and how to position your own portfolio for it.
How 5 percent yields rewire asset valuation
The number 5% carries a psychological weight that 4% never did. When the 10-year Treasury yield climbed above it in September 2026, hitting its highest level since 2007, markets did not just register a data point. They registered a regime change.
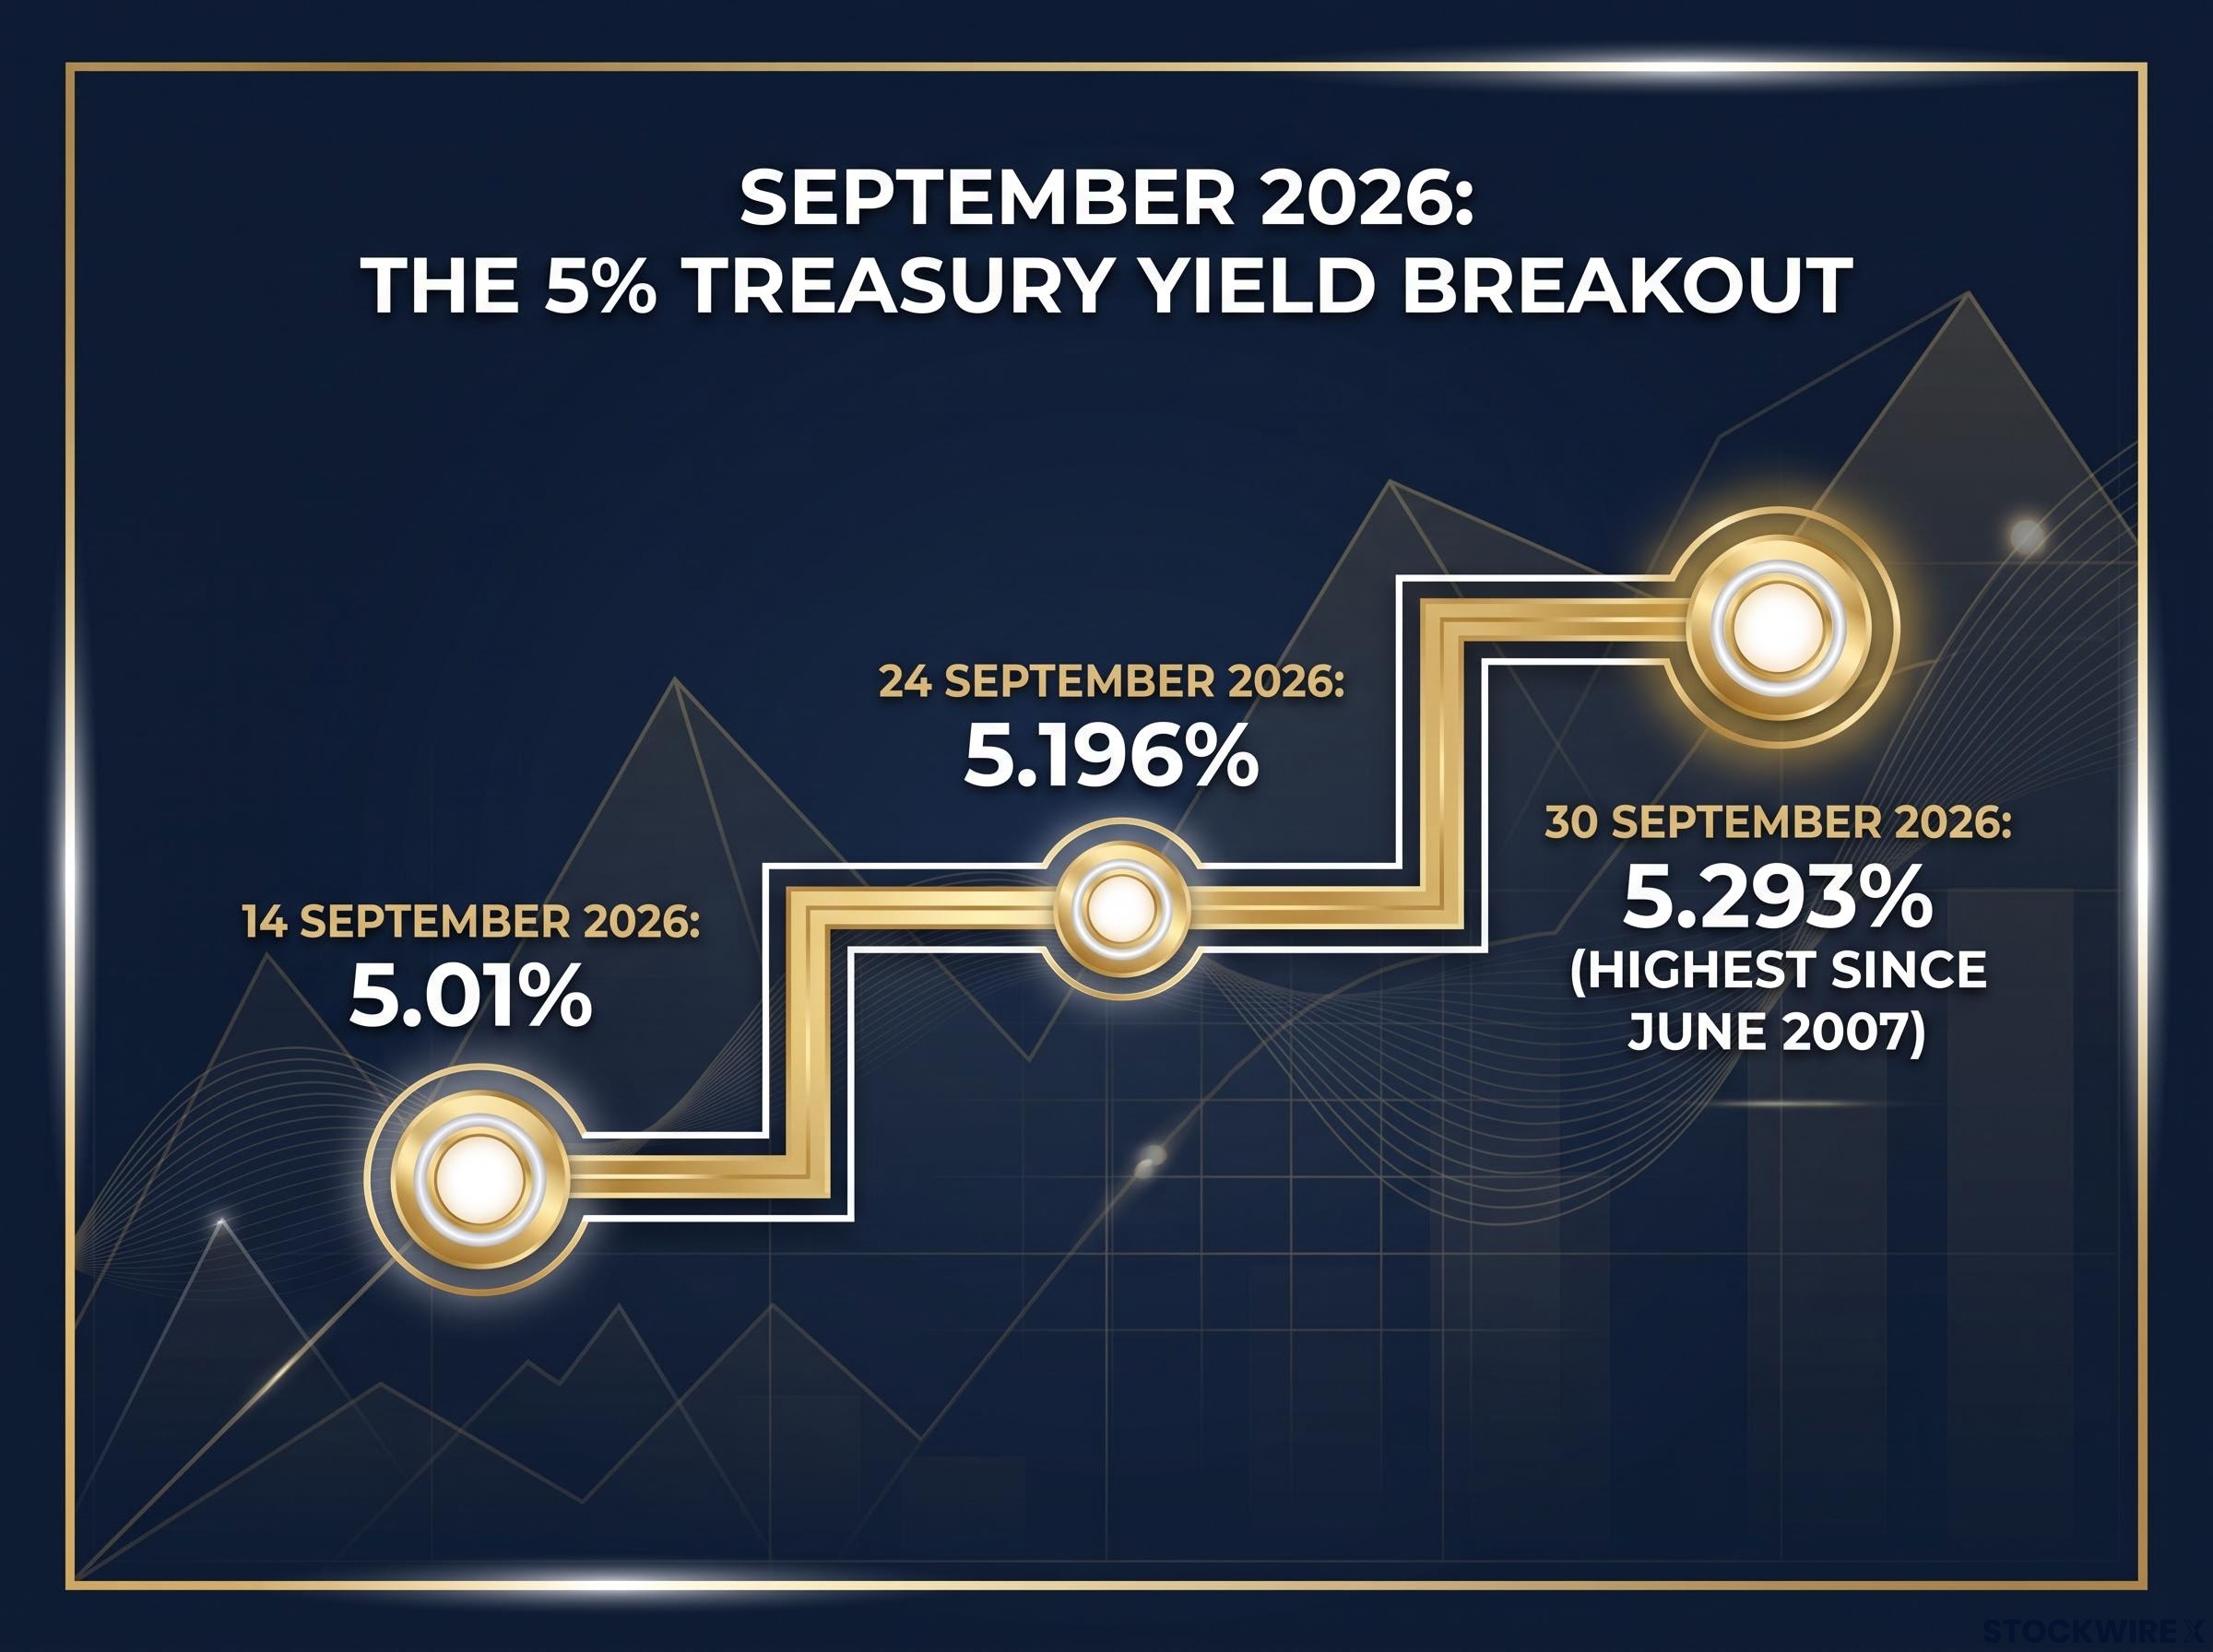
Here is the trajectory that got everyone’s attention:
- 14 September 2026: The yield crossed 5%, with Reuters reporting roughly 5.01% and describing the level as a closely watched psychological threshold capable of threatening the bull market in stocks.
- 24 September 2026: It reached around 5.196%, with CNBC noting a 19-year high.
- 30 September 2026: It touched approximately 5.293%, its highest reading since June 2007.
So why does a move in a government bond yield matter for your tech stocks? The answer sits inside a tool called the discounted-cash-flow model, which is how analysts put a price on a company today based on the profits it is expected to earn in the future.
The inverse math behind bond yield mechanics explains why a yield climbing from 4% to 5% compresses bond prices and simultaneously raises the hurdle rate every equity investment must clear to attract capital away from risk-free government debt.
That model uses a discount rate to translate future earnings into present value, and the risk-free Treasury yield is the foundation of that rate. When the yield rises from roughly 4% to above 5%, the discount rate rises mechanically, and the present value of profits promised years down the road shrinks.
Growth stocks feel this most acutely. Their valuations rest almost entirely on earnings projected far into the future, so a higher discount rate hits them harder than it hits a bank earning steady profits today.
There is a second force at work, and it is just as powerful. When safe government bonds pay 5%, they start competing directly with stocks for your money.
Reuters reported in late September that investors were “dialling back on stocks and switching some money into government bonds to cash in on the juicy yields” now available near 5%. When risk-free returns climb this high, equities have to work harder to justify the extra risk.
What is driving yields up remains genuinely contested. The structural camp points to a U.S. national debt of $40 trillion, deglobalisation, and heavy debt-financed AI infrastructure spending as forces that could keep rates elevated for years.
The cyclical camp, including Reuters columnist Jamie McGeever, frames the break above 5% as part of the ongoing Federal Reserve tightening cycle and the oil-price surge tied to the US-Iran conflict. On this view, yields normalise once inflation cools. Both arguments have merit, and the market has not settled the debate.
What this means for you is direct. When the baseline cost of capital sits at 5%, the market will no longer pay premium prices for profits promised a decade out, so the long-duration growth names dominating your holdings deserve a harder look. A quality tech stock falling on good earnings is often responding to this structural gravity, not a broken business.
When big ASX news breaks, our subscribers know first
The new equity leaders hiding in plain sight
If high rates are the pressure, the relief valve is a group of companies most investors stopped paying attention to years ago. The same forces squeezing growth stocks are quietly handing the advantage to the boring, traditional, cash-generating names that dominate value indexes.
The data backs this up. According to Morningstar, with analysis from indexes strategist Dan Lefkovitz and researcher Robbie Greengold, the Morningstar US Large Cap Value Index outpaced the Morningstar US Large Cap Growth Index on a year-to-date basis through 2026.
Morningstar’s Q4 2026 index analysis, published on 29 September 2026, documents the outperformance of value, micro-cap, and international benchmarks relative to the broad U.S. market, with analysts Dan Lefkovitz and Robbie Greengold attributing the shift to higher rate tailwinds and expanding AI-adjacent spending.
The outperformance is not limited to one corner of the market. Smaller companies joined in, with the Morningstar US Micro Cap Index beating the broader U.S. market, lifted by data centre construction and AI-related spending flowing to names such as SanDisk, Bloom Energy, and Applied Optoelectronics.
International shares told the same story. The Morningstar Global ex-US All Cap Target Market Exposure Index, covering developed and emerging markets across Europe and Asia, outperformed the broad U.S. benchmark, supported by strength in financial services, energy, and AI-related technology.
Why is this happening? Higher rates widen the gap between what banks charge borrowers and what they pay depositors, lifting net interest margins and making value-heavy financials more appealing than long-duration tech. Meanwhile, the debt-financed AI buildout benefits old-economy sectors, the industrials, utilities, and materials firms that supply power and equipment to data centres.
Even inside the growth world, the winners have shifted toward hardware. Semiconductor and equipment companies including Micron Technology, Intel, and Applied Materials were notable contributors to value index gains, a sign that the AI trade is broadening beyond pure software.
The valuation gap sets the table. Many value and international stocks entered 2026 with lower multiples and higher dividend yields than U.S. growth names, creating the conditions for mean reversion, the tendency of cheap assets to drift back toward fair value over time.
The value investing metrics that screen for this rotation, particularly price-to-earnings ratios below 15, free cash flow yield above 5%, and debt-to-equity below 1.0, help identify which financials and industrials are genuinely cheap versus those merely dragged up by sector momentum.
| Asset class | 2026 catalyst | Traditional role |
|---|---|---|
| U.S. value | Higher rates lift bank margins; cheap entry multiples support mean reversion | Income and stability anchor; dividend-paying cyclicals |
| International equities | Larger weightings in financials and energy; lower starting valuations | Geographic diversification and currency exposure |
| Micro-caps | Data centre construction and AI-adjacent spending reaching smaller firms | High-growth, high-volatility satellite exposure |
This broad outperformance across value, size, and geography tells you something encouraging: market breadth is expanding beyond software and AI. After years of dragging on returns, diversification is rewarding investors again, which gives you a logical reason to hold international and value funds even when they feel unexciting.
Natural resources as the ultimate geopolitical hedge
Financial math explains the equity rotation, but the next shift comes from the physical world. Commodities are not just lines on a charting screen. They are tangible claims on things the global economy cannot function without, and in 2026 that mattered enormously.
Natural resources had a strong year. The Morningstar Global Upstream Natural Resources Index meaningfully outpaced the broader global equity universe, driven by elevated energy prices and a surge in copper.
The energy story was written in conflict. Oil prices surpassed $100 per barrel at multiple points during 2026, pushed higher by Middle East supply constraints, and Reuters coverage directly linked that oil jump to the climb in Treasury yields and inflation expectations.
This is exactly why a small resources allocation earns its place. Commodities make up a significant share of the indexes used to measure inflation, so they tend to rise when inflation does, acting as a counterweight to the heavy technology exposure most portfolios carry. According to Morningstar’s 2024 Diversification Landscape report, cited by Morningstar’s Amy Arnott, that counterweight function is precisely the point.
There is also a scarcity argument. Energy and basic materials combined account for less than 6% of the U.S. equity market, so most domestic investors own almost none of this protection by default.
The risks, though, are real and specific. Commodity investing carries dangers that stock investing does not, and you need to understand them before committing capital:
- Boom-bust spot prices: Commodity prices swing violently, from oil’s collapse in 2014-2015 to WTI briefly trading below zero in 2020.
- Geopolitical concentration: Exposure clusters in politically sensitive regions, so a commodity-heavy tilt can quietly concentrate geopolitical risk rather than diversify it.
- Equity correlation: Energy and mining shares are still stocks, and they can fall in a broad market sell-off even when the underlying commodity holds firm.
- Futures roll yield contango: Commodity funds that use futures contracts can lose money through roll yield when longer-dated contracts cost more than near-dated ones, a condition called contango, even if spot prices stay flat.
The speed of 2026’s oil and copper surges shows how fast a physical supply shock can derail an inflation narrative. A small allocation to real assets acts as insurance against the kind of event the Federal Reserve simply cannot control with interest rates.
For investors wanting to stress-test the bullish commodity case before committing capital, our full explainer on the commodity glut forming in 2026-2027 examines EIA data projecting a 4.90 mb/d oil surplus by next year and what that reversal means for commodity equity valuations.
Restructuring your risk buckets for a 5 percent world
Theory is useful only if it changes what you actually do. The temptation in a shifting market is to make a binary bet: dump growth, pile into value, go all-in on commodities. That is market timing dressed up as conviction, and it usually ends badly.
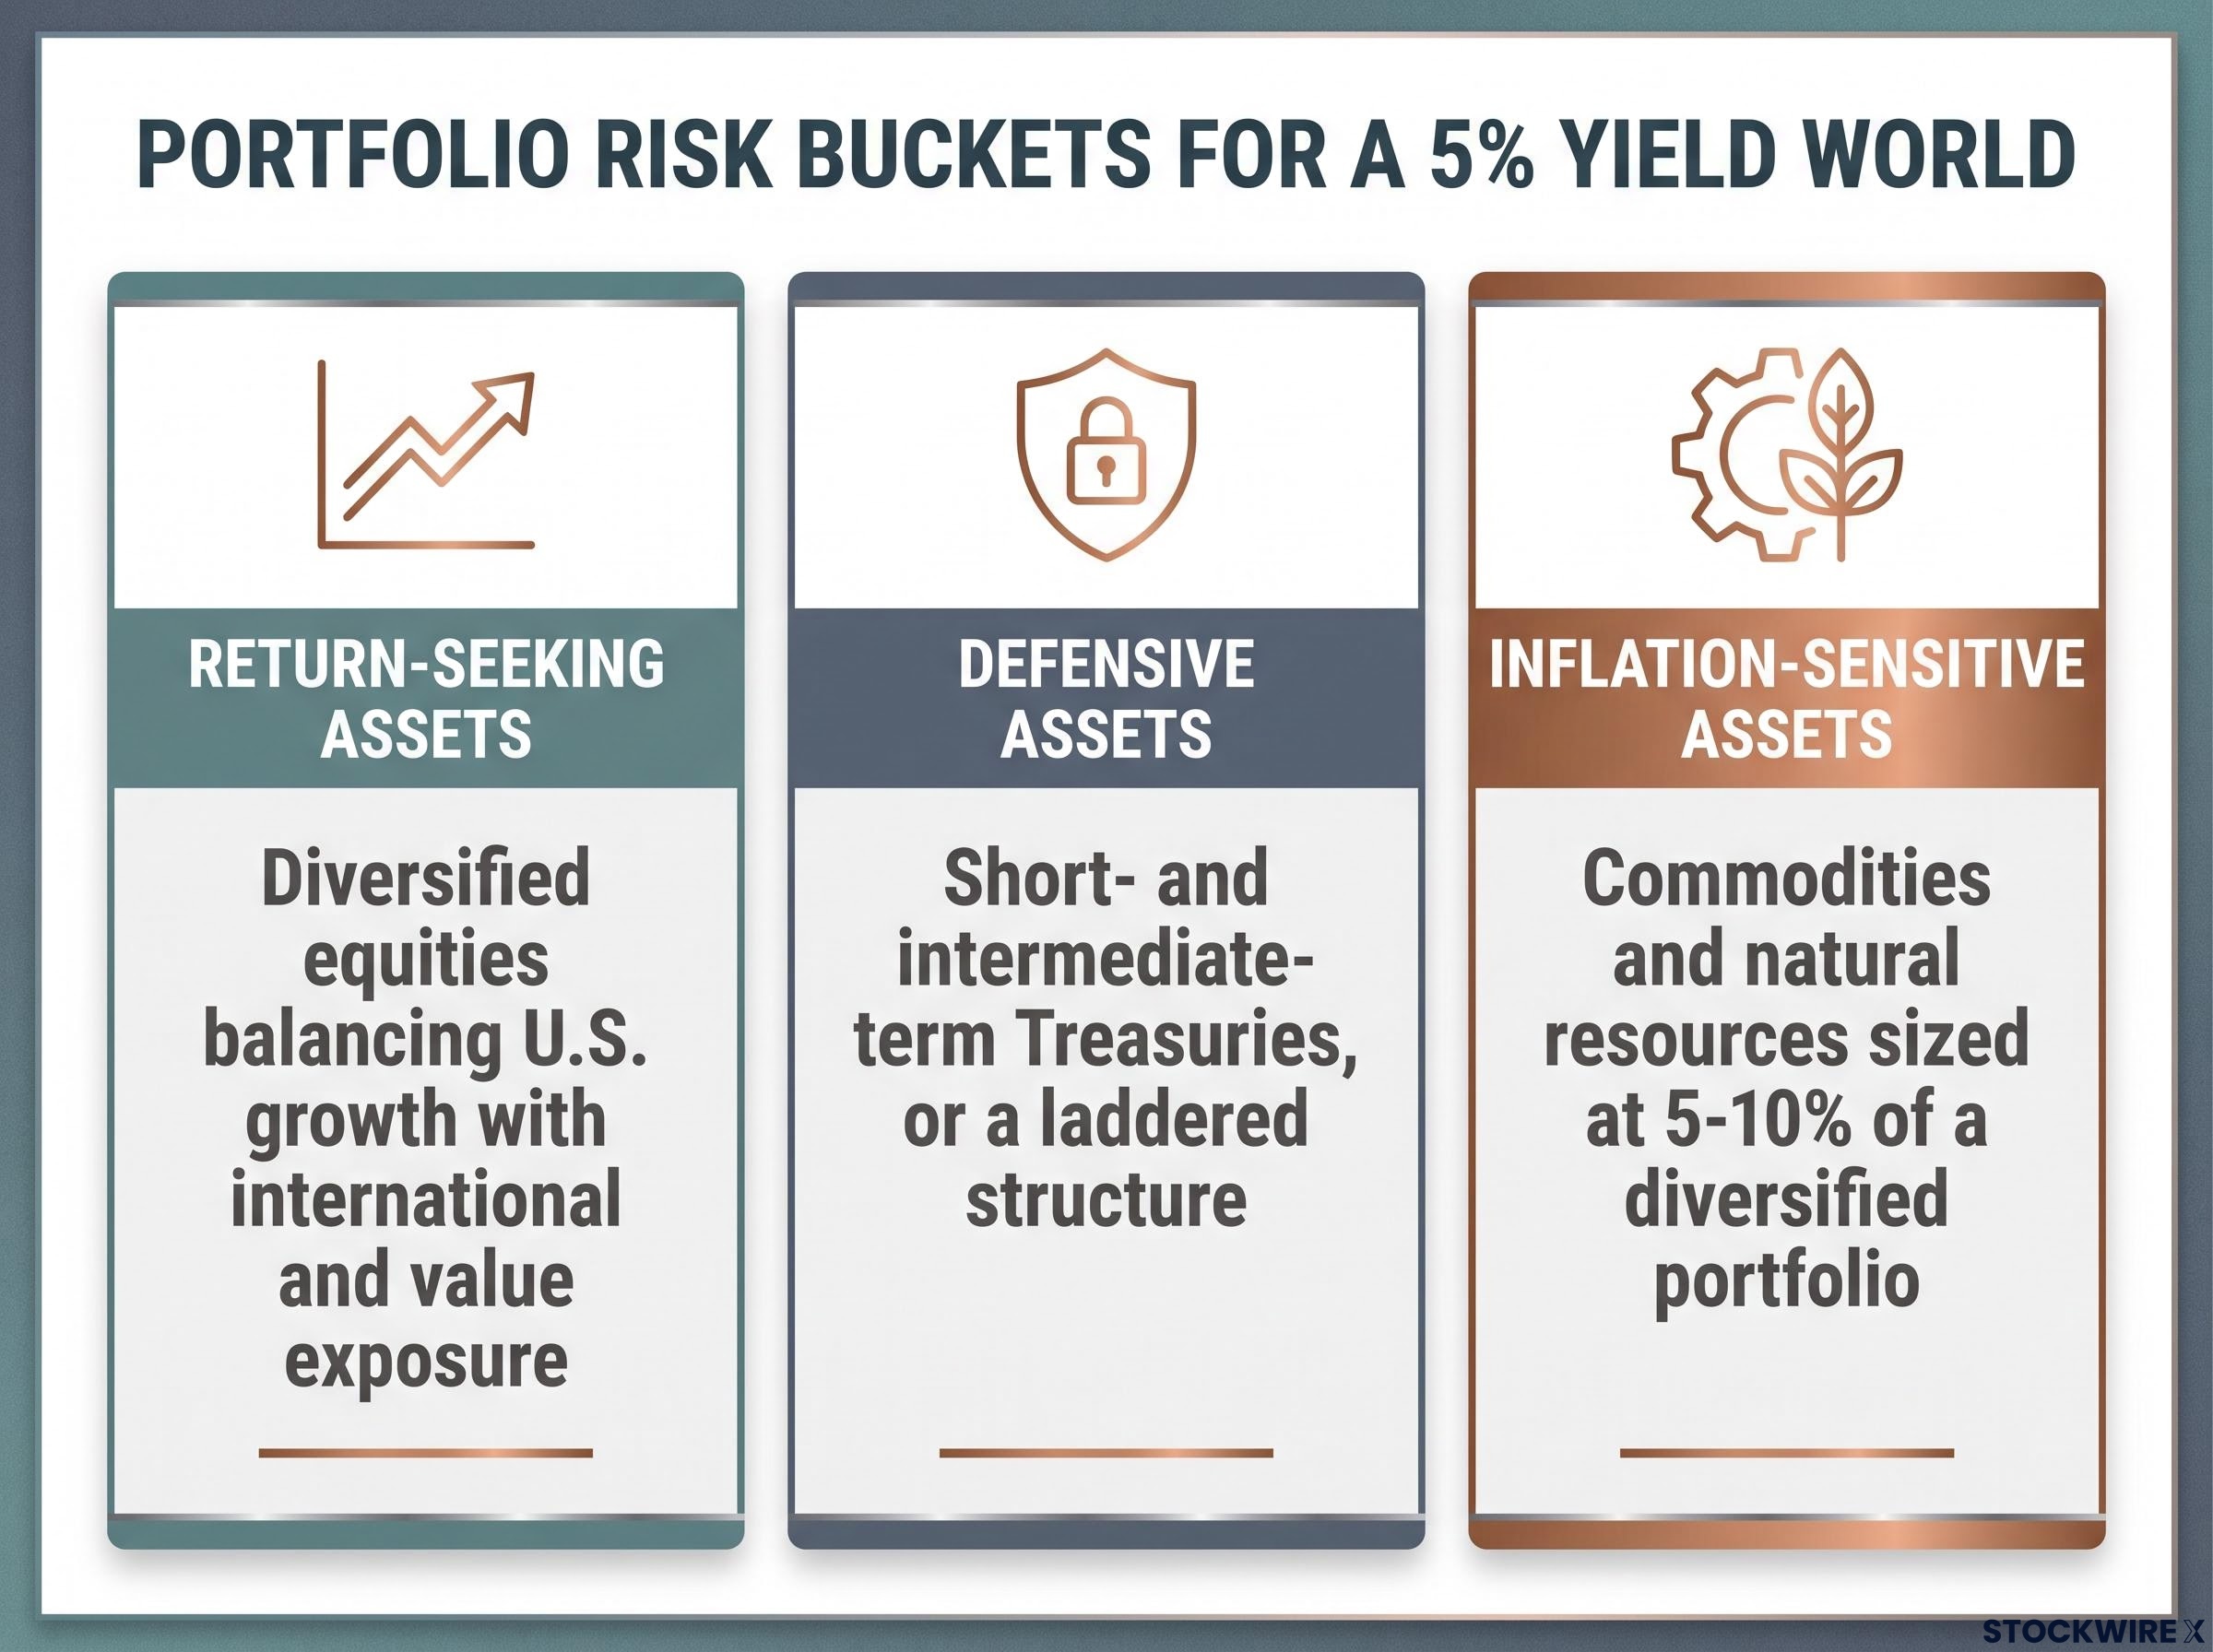
A steadier approach borrows from how institutional multi-asset teams organise money, splitting a portfolio into three functional buckets, each with a distinct job.
Return-seeking assets
This is your growth engine, built from diversified equities. Rather than abandoning U.S. growth, balance it with international and value exposure so the portfolio participates in the broadening rotation while staying linked to secular AI themes.
Multi-factor investing, which blends value, quality, and momentum factors, is one way institutional managers avoid over-betting on a single macro story. The key discipline here is systematic rebalancing on a schedule, not reactive trading on headlines.
Defensive assets
Here is where the 5% world changes everything. For the first time in nearly two decades, safe assets pay you a genuine return, so you can earn income while you wait instead of stretching for risky growth.
The smart move is to capture that yield without the duration risk. Favouring short- and intermediate-term Treasuries, or a laddered structure that spreads bonds across staggered maturities, lets you lock in attractive yields while limiting vulnerability if rates climb further.
Inflation-sensitive assets
This bucket is your satellite, not your core. Institutional frameworks typically size commodity and natural-resource allocations at 5-10% of a diversified portfolio, enough to shift inflation sensitivity without letting a volatile asset class dominate returns.
Within it, understand what you own. Physical commodity funds (often using futures) behave very differently from natural-resource equities, which carry the sector concentration and market risk of ordinary stocks rather than offering a clean inflation hedge.
Across all three buckets, the discipline that ties it together is pre-defined rebalancing and scenario analysis. Dan Lefkovitz of Morningstar has noted that issues looming large at the start of a quarter often prove inconsequential by its end, a reminder that volatility like September’s yield moves is an opportunity to rebalance toward your targets, not a signal to panic.
This article is for informational purposes only and should not be considered financial advice. Investors should conduct their own research and consult with financial professionals before making investment decisions. Past performance does not guarantee future results, and financial projections are subject to market conditions and various risk factors.
Building resilience over predicting the peak
You do not need to guess whether yields peak tomorrow or climb to 6% next year. The structural reality of Q4 2026, the return of 5% yields, the resurgence of value stocks, and the strength in commodities, is already shaping which strategies work.
The lesson from every market cycle is that the issues feeling monolithic today tend to fade, and the only reliable defence against the next geopolitical or economic surprise is broad diversification across styles, sizes, geographies, and asset classes.
For investors wanting to operationalise the three-bucket framework in detail, our comprehensive walkthrough of post-60/40 portfolio construction covers the tactical allocation bands, risk-review cycle timing, and rules-based rebalancing triggers that institutional multi-asset teams use to maintain resilience across inflation, growth, and policy regimes.
There is genuine good news in all of this. The return of real yield and the widening of equity participation beyond a handful of mega-caps is a healthy development for disciplined, long-term investors. Your job is not to call the peak. It is to build a portfolio resilient enough that the peak does not matter.






