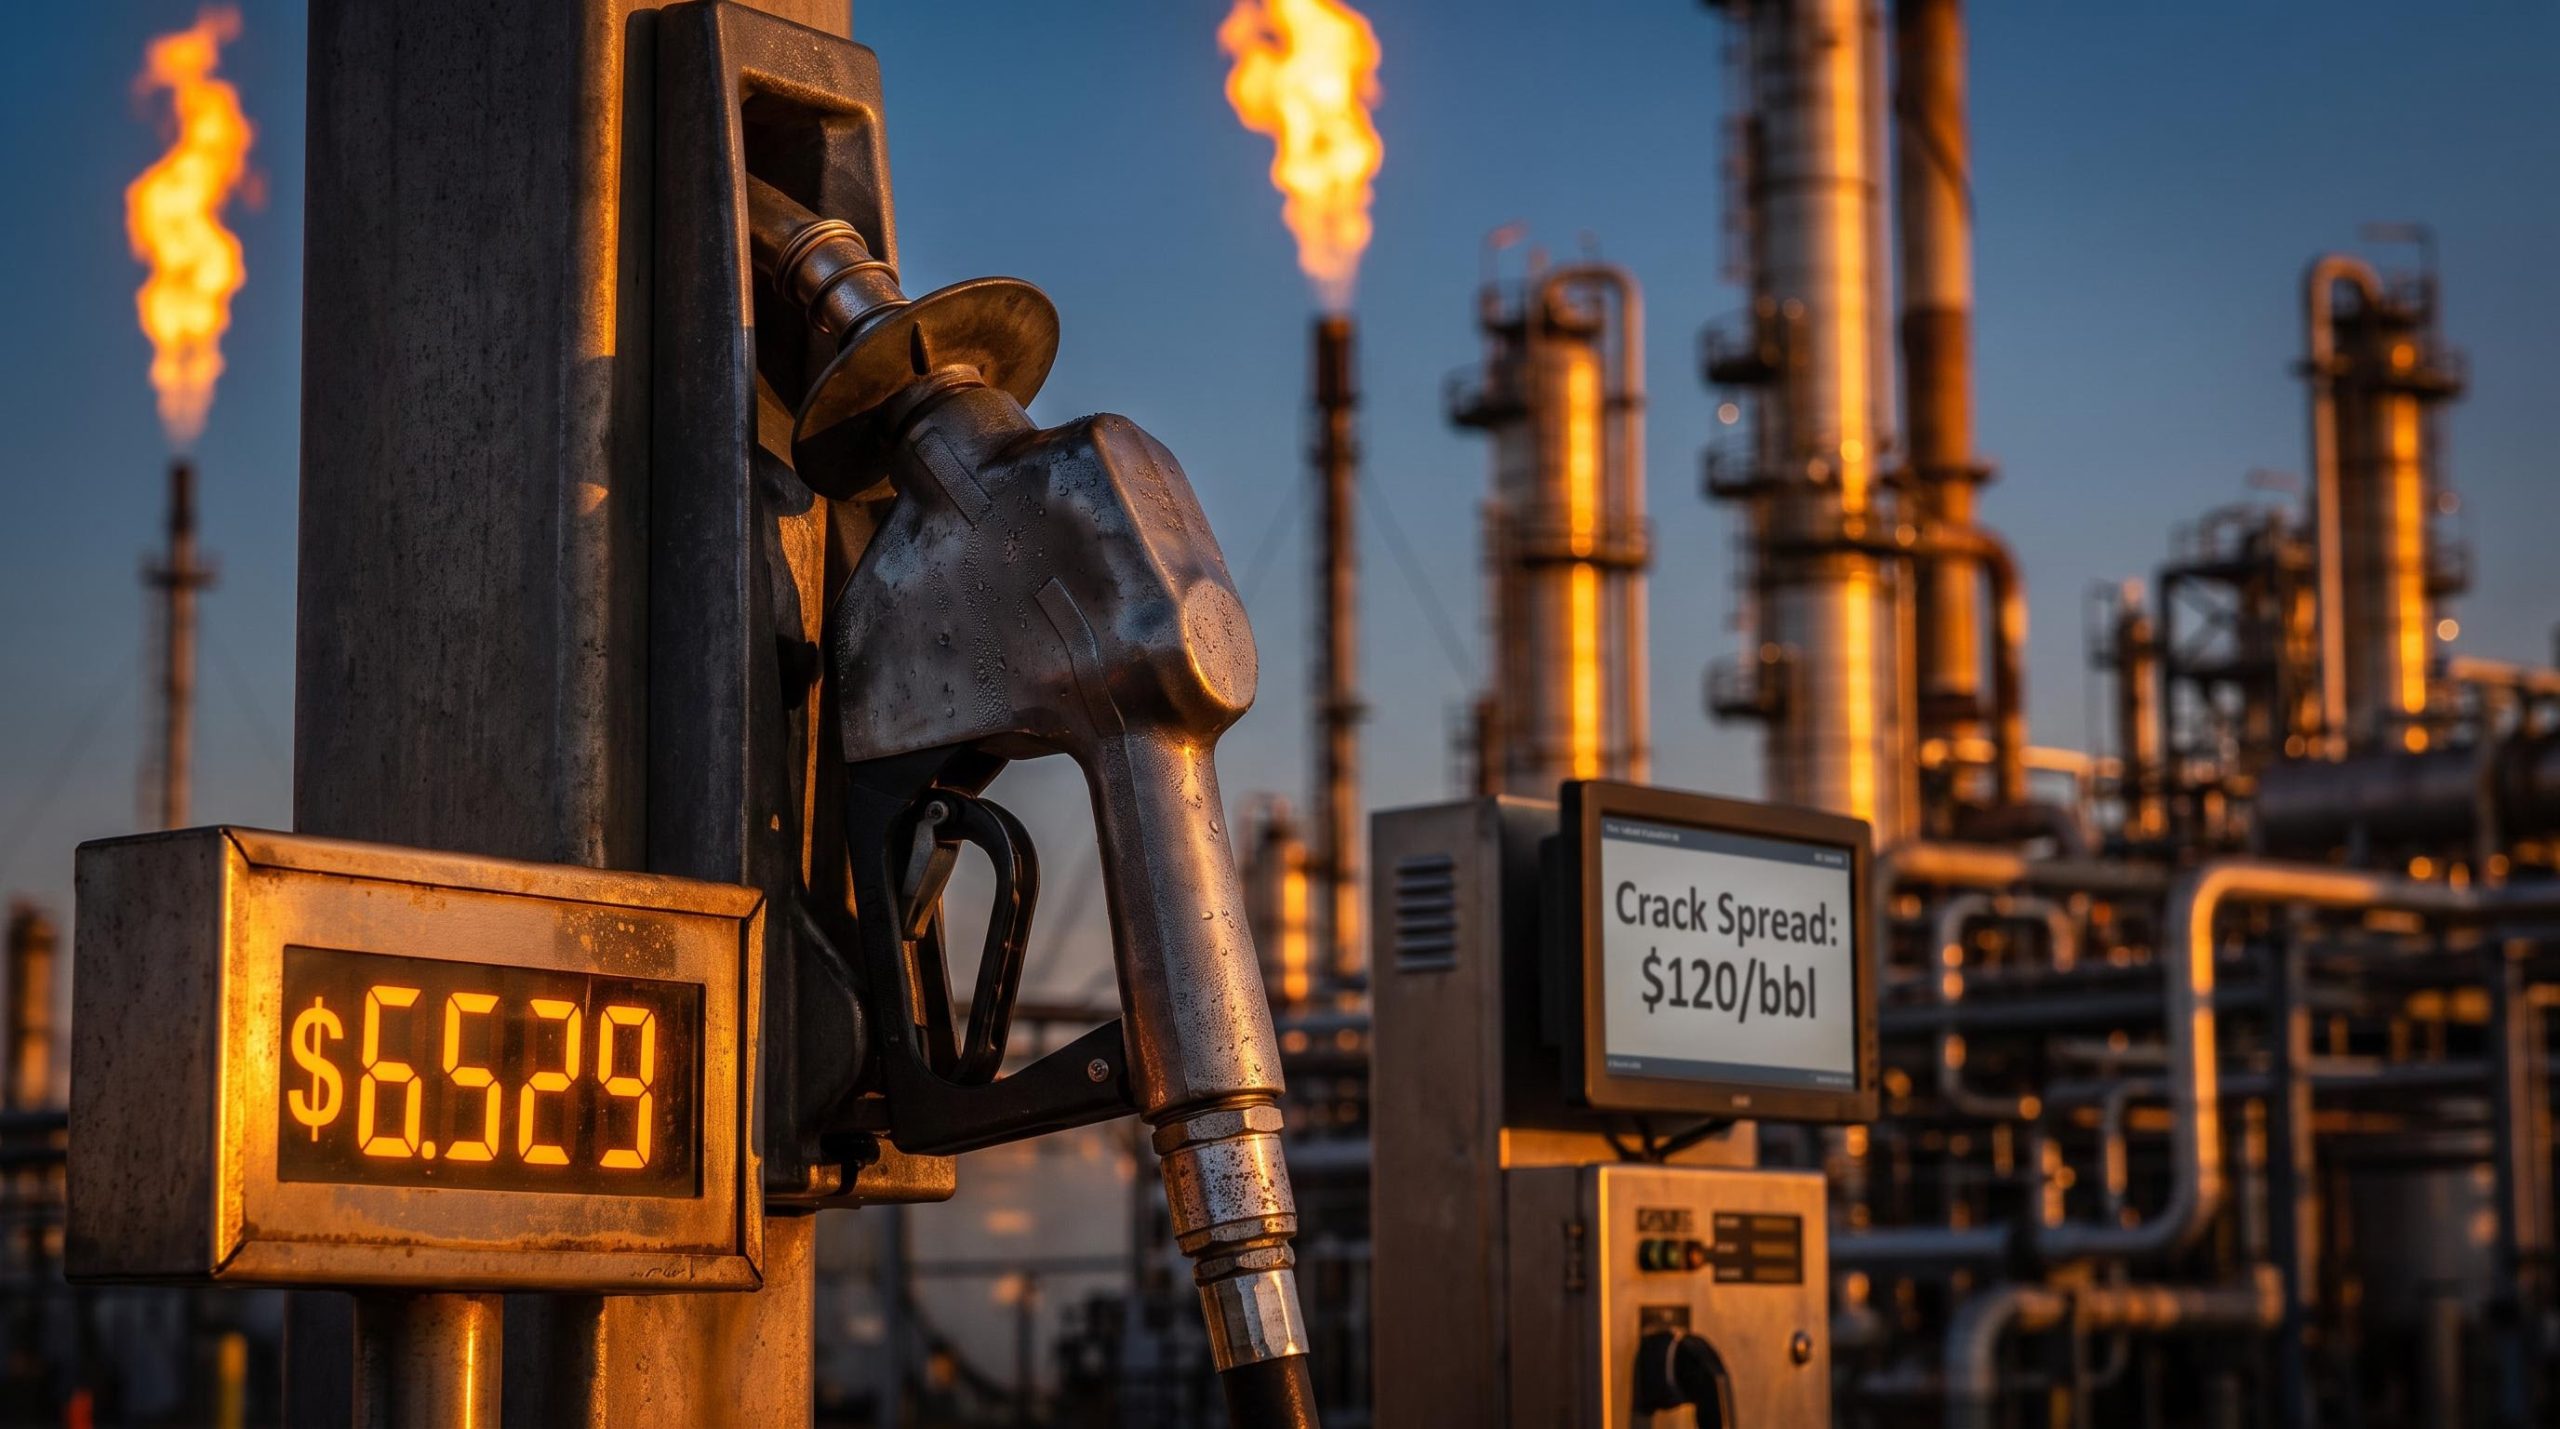
The NYMEX diesel crack spread, the gap between what diesel sells for and what the crude oil to make it costs, has pushed past $120 per barrel. In plain terms, refined diesel is now priced at roughly double the raw crude it is distilled from.
That single number is the clearest signal of what is happening in distillate markets right now, and it is a structural dysfunction, not an ordinary price move.
The diesel crack spread is the refining industry’s most direct measure of margin pressure, sitting four to six times above its historical norm of $15-$40 per barrel and well above the prior stress ceiling of $60 per barrel reached in 2022, a structural break that distinguishes this episode from seasonal fluctuations.
The visible symptom arrived on 21-22 September 2026, when the US national average diesel price hit a record $6.529 per gallon, the highest in the 32 years the Energy Information Administration (EIA) has tracked the figure. Underneath that record sit two supply shocks happening at once: the near-total elimination of Russian diesel exports, and a reduction in Middle Eastern refined product supply of roughly 750,000 to 1 million barrels per day.
This piece maps the forces driving the price, the real-time indicators that will determine how it resolves, and what each one means for anyone tracking freight costs, inflation, or energy-exposed assets. Think of it less as a summary and more as a dashboard for a market that is still moving.
How two simultaneous supply shocks created a structural diesel shortage
The reason diesel is this expensive is not one disruption but two, each with a separate cause, hitting the market in the same window. Walk through them in sequence and the structural nature of the shortage becomes clear.
| Supply shock | Pre-crisis volume | Estimated current volume | Primary cause |
|---|---|---|---|
| Russian diesel exports | ~1 million bbl/day | Effectively zero | Ukrainian strikes on refineries and export infrastructure |
| Middle Eastern refined product | Baseline supply | Down 750,000 to 1 million bbl/day | Strait of Hormuz closure and Jazan refinery attack |
The Russian refinery collapse
Russia normally sends about 1 million barrels per day of diesel and gasoil into global markets. By September-October 2026, that flow had fallen to near zero.
The cause was a sustained Ukrainian strike campaign targeting Russian refineries, pipelines, export terminals, and tankers. At the peak of the disruption, roughly half of Russia’s refinery fleet was reported offline.
There is an irony worth noting. Russia had already been struggling to sell its crude internationally under sanctions pressure and widening price discounts, which meant its diesel refining and export chain was where the real economic value sat. That made the refinery attacks a far more effective economic weapon than they would have been in a normally functioning market.
The Middle Eastern disruption
The second block of lost supply came from the Middle East. The closure of the Strait of Hormuz choked off refined product exports from the region, and Houthi attacks on Saudi Arabia’s Jazan refinery removed further capacity.
Together these events stripped out an estimated 750,000 to 1 million barrels per day of diesel from global markets, a second independent supply loss landing at the same moment as the Russian collapse.
The two shocks also reinforced each other. The Hormuz closure raised global demand for barrels that do not depend on Strait transit, which handed Ukraine a stronger incentive to intensify its attacks on Russian export infrastructure.
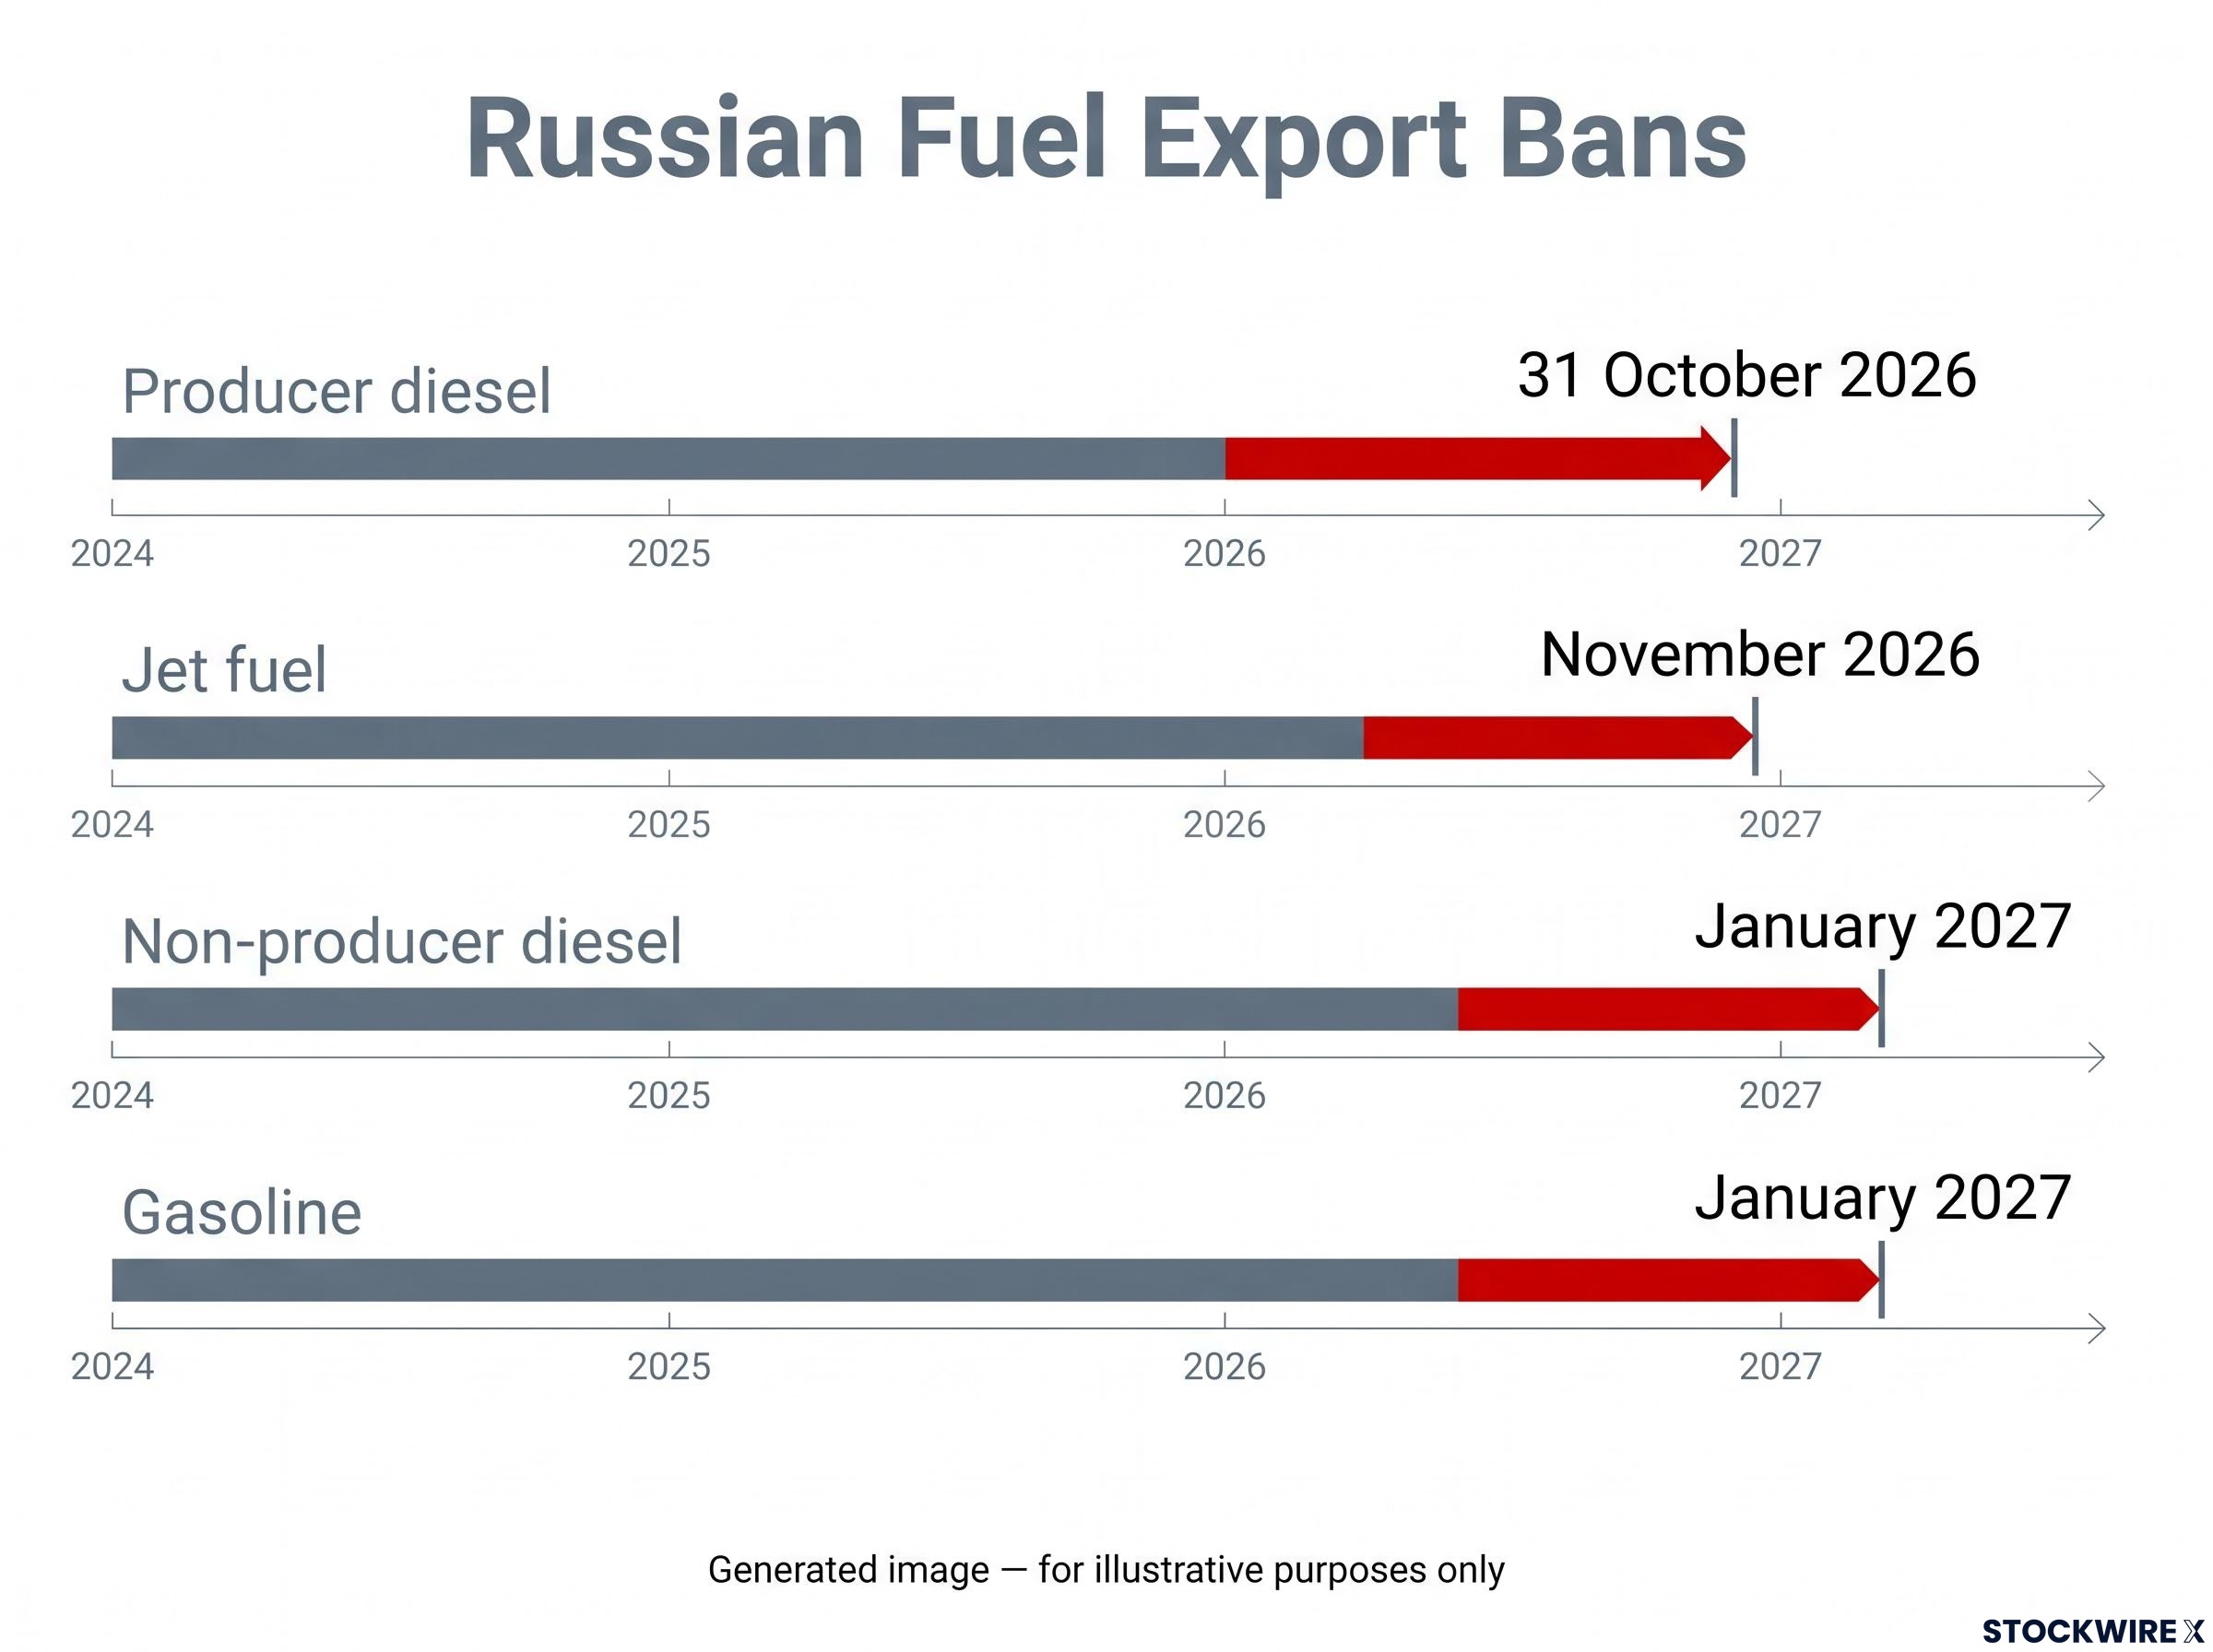
Russia responded on the policy side by keeping diesel at home. On 30 September 2026 it extended its producer export ban, and the full restriction set now reads:
- Producer diesel export ban through 31 October 2026
- Separate non-producer diesel ban through January 2027
- Jet fuel export ban through November 2026
- Gasoline export ban through January 2027
The US stepped into part of the gap. Refinery utilisation sat near 92.5% as of 25 September 2026, and US diesel exports climbed roughly 40-50% from a pre-war baseline of 1 to 1.1 million barrels per day to about 1.5 million barrels per day.
That rebalancing matters, but it does not close the hole. Remove roughly 1.75 to 2 million barrels per day from two unrelated sources and you do not have a spike that normalises on its own. You have a structural gap that needs a new supply actor to step in, which means the identity of the marginal supplier matters more than the direction of the NYMEX price on any given day.
When big ASX news breaks, our subscribers know first
Why diesel inflation hits the real economy harder than gasoline
To understand why markets are treating this as a macro risk rather than a commodity story, start with where diesel actually sits in the economy.
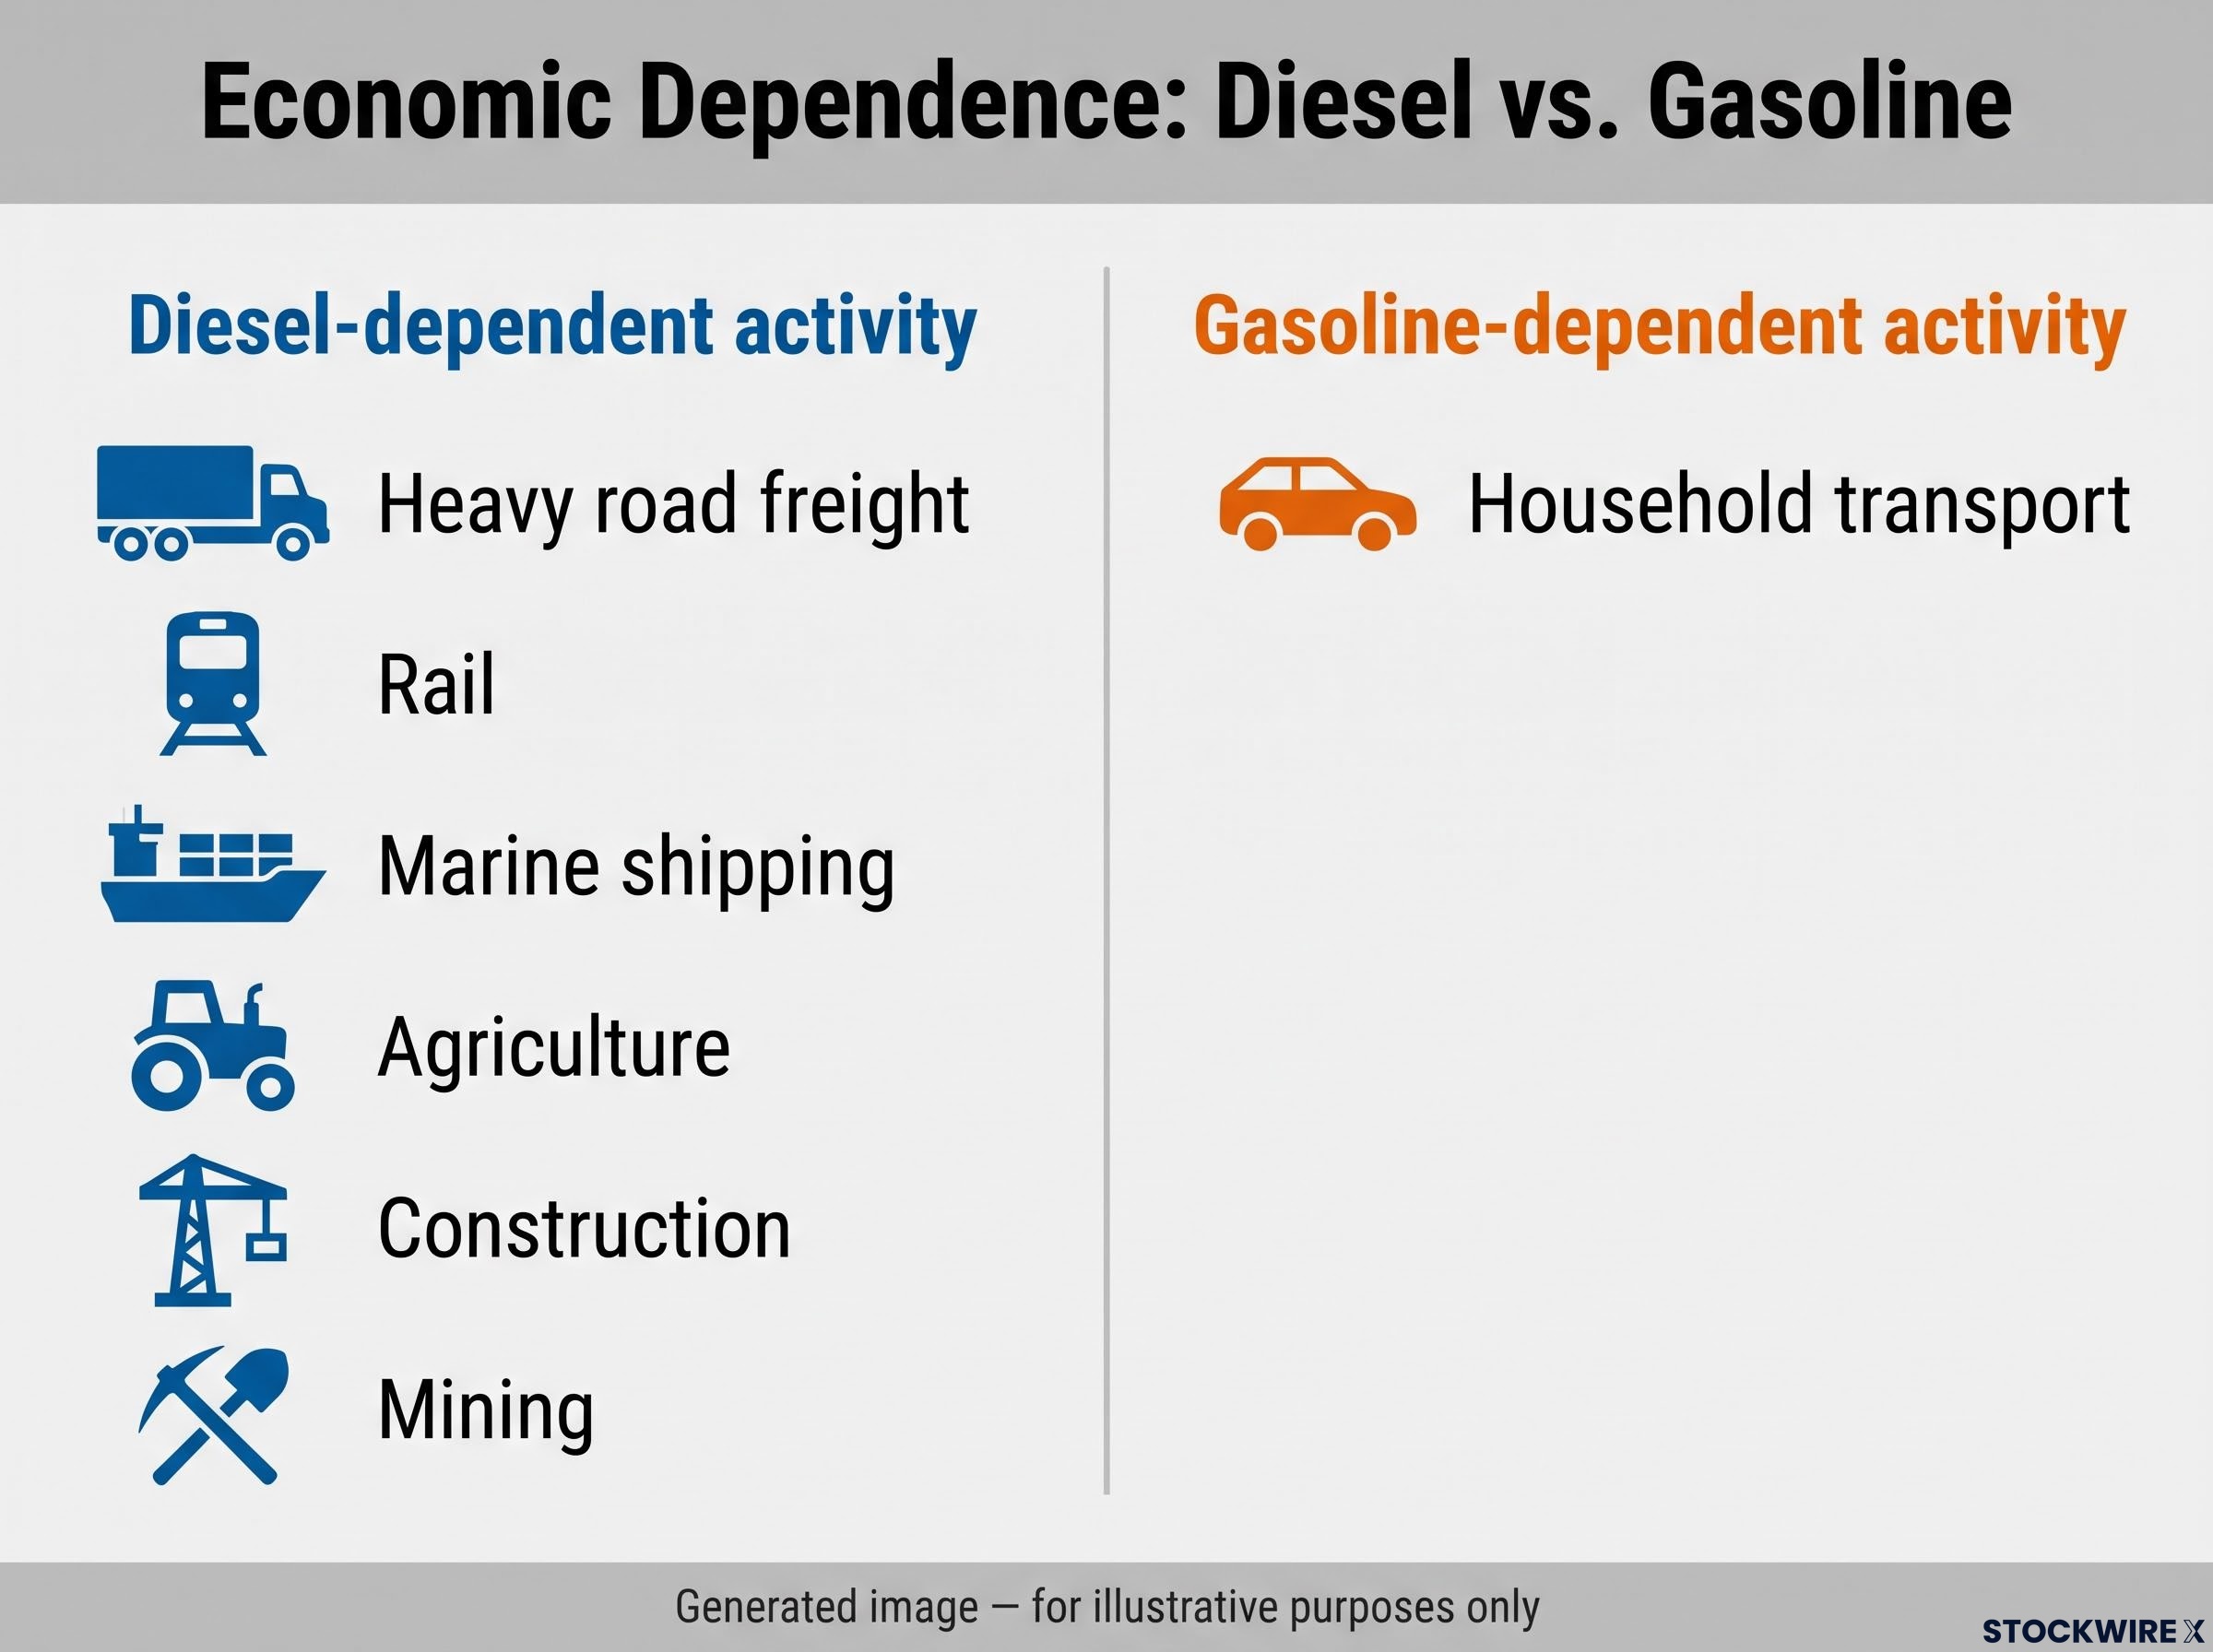
Diesel is the primary fuel for heavy road freight, rail locomotives, marine bunkering, and agricultural machinery. Gasoline, by contrast, lives almost entirely in household transport. That difference is everything.
Here is the contrast in practical terms.
Diesel-dependent activity:
- Heavy road freight
- Rail
- Marine shipping
- Agriculture
- Construction
- Mining
Gasoline-dependent activity:
- Household transport
When gasoline rises, households have room to adjust. They can drive less, combine trips, or delay discretionary journeys. When diesel rises, a trucking fleet cannot simply stop delivering goods, and a farm cannot stop running its machinery mid-harvest.
Because businesses cannot avoid the cost, they pass it through. Diesel feeds straight into freight rates, fuel surcharges, food prices, construction materials, and manufactured goods. Fleet reporting tied the September price climb, from $5.967 per gallon on 9 September to the $6.529 record on 21-22 September, directly to another cost shock for carriers.
This is why diesel inflation behaves differently in the data. It shows up first in producer prices and freight surcharges, then works into categories that sit inside core inflation baskets, the measures that strip out direct energy. Gasoline shocks are more likely to be dismissed as transitory. Diesel shocks are more likely to embed.
A refinery utilisation ceiling of 96.8% processing 17.3 million barrels per day leaves almost no operational slack, meaning any new demand pressure feeds directly into price rather than extra output, a constraint that makes the crack spread a more reliable distress signal than headline crude benchmarks.
That distinction is why one description of sustained diesel inflation is that it acts on the broad economy much like a central bank rate increase, a persistent drag that raises costs everywhere at once.
The energy-to-food transmission lag of 6-18 months means the fertiliser cost shock already visible in anhydrous ammonia prices has not yet fully surfaced in retail food prices, making upstream fertiliser benchmarks a more reliable leading inflation signal than the grocery data that appears in monthly CPI prints.
The policy signal to watch Federal Reserve Governor Austan Goolsbee has been referenced as signalling limited remaining patience for supply-side inflation. Fed officials have acknowledged they cannot increase oil supply directly, while also indicating diminishing willingness to simply wait for a supply-side fix.
CPI data released on 30 September 2026 came in slightly below expectations, though the broader inflation trajectory stayed elevated.
For any reader tracking central bank policy, that combination matters. Sustained diesel inflation at these levels raises the probability that the Fed reads this as a second-round inflation threat that could broaden into wages and core prices, rather than a one-off supply shock it can look past. That changes the calculus on the rate path, which is why this is a macro event and not just a line on a commodity chart.
China’s role as the only actor that can move markets quickly
In August 2026, Chinese diesel exports jumped 42.1% year-on-year to 1.33 million tonnes, the highest monthly total since March 2024. For a market this tight, that single data point carries more weight than almost any other.
The reason is simple. China is the only country with meaningful idle refining capacity that can increase diesel exports through a policy decision rather than years of capital investment. That makes Beijing the single most actionable lever for relieving the global shortage.
| Period | Chinese diesel exports | Context |
|---|---|---|
| Summer 2022 | ~100,000 bbl/day | Baseline before the last global squeeze |
| December 2022 | Over 800,000 bbl/day | Roughly eightfold increase in response to shortage |
| August 2026 | 1.33 million tonnes (+42.1% YoY) | Highest monthly volume since March 2024 |
The case for sustained Chinese supply
The precedent is recent. During the winter of 2022-2023, after Russia’s invasion of Ukraine squeezed global diesel, China nearly quadrupled its clean product exports between summer and December, with diesel specifically rising roughly eightfold from about 100,000 to over 800,000 barrels per day.
The same incentives are present now. Elevated crack spreads make overseas sales highly profitable for Chinese refiners, especially state-owned majors positioned to exploit high margins abroad. Beijing eased export controls in July and again in August 2026, pushing total refined product exports to 6.01 million tonnes in August, up 12.7% year-on-year. January to August diesel exports reached 4.84 million tonnes, up 5.9%.
China’s relaxed refined fuel export limits, extended for a second consecutive month in August 2026 with temporary approval to ship 2.7 million tonnes, represent a meaningful policy pivot after months of tightened quotas from March through June.
There is also slack in the domestic picture. China’s apparent diesel demand fell roughly 20% year-on-year through June and July 2026, even as domestic road freight, which accounts for about 70% of Chinese diesel use, grew around 3.5%. That gap points to inventory being drawn down and capacity available to redirect toward exports.
The constraints Beijing will not override
The counterargument is about control. Beijing’s priority is keeping domestic fuel prices and availability stable to avoid industrial and consumer backlash. When domestic inventories look tight, authorities tighten quotas and slow export approvals.
Then there is the data problem. Chinese refined product storage tanks lack floating roofs, which means satellite imagery cannot track inventory levels. That blind spot became genuinely consequential during this crisis, because outside observers cannot see when Beijing is approaching the point where it reverses course.
The incentives and constraints line up as two opposing forces:
- Push toward more exports: high crack spreads, idle capacity, 2022-2023 precedent, comfortable-looking domestic stocks
- Pull toward fewer exports: domestic price stability priority, opaque inventory data, pattern of quota tightening when supply appears tight
Analysts estimate that adding 500,000 barrels per day of Chinese supply could compress crack spreads by $30-40 per barrel, the single most quantifiable relief scenario on the table.
So the read for anyone watching this market is twofold. China is already responding to the price signal, which is encouraging. But because its domestic inventory position is unobservable, that export posture could reverse with little warning, which makes Chinese supply the most consequential and least predictable near-term variable for diesel prices.
The US export ban debate: who would it actually help?
The question of whether the US should ban diesel exports looks like a political controversy, but the economics point toward a knowable answer. Work through the evidence and the dilemma largely resolves itself.
The case for a ban is real but narrow. A Kalshi prediction market put the probability of a US diesel export ban before the midterm elections at roughly 19.7-20% in late September 2026. The strongest arguments are electoral timing and the direct price benefit: one analyst estimated a full ban could cut domestic prices by about 25 cents per gallon per week, or roughly $1.50 per gallon over six weeks.
The core dilemma in one figure A full ban might shave around $1.50 per gallon off US diesel over six weeks. But US Gulf Coast refineries are built to serve the global market. Trap that diesel at home and export margins collapse, which pushes refiners to cut runs. Lower runs mean less total diesel produced, eroding the very benefit the ban was meant to deliver.
That feedback loop is the heart of the problem. US Gulf Coast refineries are configured for European and Latin American demand. A full ban would collapse export cracks, force run cuts, and reduce output of diesel, gasoline, and jet fuel alike.
The international cost compounds it. Europe and Latin America depend on US diesel to replace lost Russian barrels. Cut them off and they bid up alternative supply, pushing global prices higher and encouraging allies to diversify away from the US over the longer term. The Nixon-era controls of 1973-74 are the main precedent, and the retrospective verdict is that rigid controls worsened shortages, misallocated fuel, and discouraged investment.
| Policy option | Domestic price impact | Refinery run effect | Allied market impact |
|---|---|---|---|
| Full export ban | ~$1.50/gallon lower over 6 weeks | Run cuts likely as cracks collapse | Forces allies to bid up supply; damages relationships |
| Partial licensing | More modest, controllable | Preserves refinery economics | Limited disruption to allied supply |
| Strategic reserve release | Temporary, targeted relief | No distortion to run rates | Minimal allied impact |
The alternatives carry better economics. Partial export licensing, echoing the throttling approach rather than an outright ban, would give policymakers leverage over marginal volumes without destroying refinery economics. Strategic reserve releases can be deployed quickly, have a clear temporary scope, and do not permanently distort investment incentives.
Here is what the 20% probability actually means for a reader. It is not a coin flip; it is the market pricing a meaningful tail risk with asymmetric consequences. If you hold energy-exposed assets or carry logistics costs, you need to understand the 80% scenario, where the US stays a reliable global supplier, just as clearly as the 20% scenario, where it begins a disorderly retreat from that role and global prices spike.
The indicators that will tell you how this resolves
Enough on what caused the crisis. Here is the operational part: the specific signals that will move before pump prices do, in the order they matter most.
- The US Gulf Coast to European ICE gasoil spread. This is the single best real-time read on the market.
- Watch for the spread widening, which signals the market pricing a higher probability of US export restriction and tighter supply
- A narrowing spread signals easing supply fears and reduced restriction risk
- Chinese Q4 2026 export quota signals. This is the most consequential forward-looking indicator for actual relief.
- Watch for new quota guidance from Beijing or export announcements from state refiners
- No Q4 2026 quota guidance had been reported in available sources at the time of writing, so the first concrete signal in either direction will carry outsized weight
- The Russian export ban renewal decision. The nearest binary event on the calendar.
- Watch whether the producer ban, which expires 31 October 2026, is extended again or allowed to lapse
- Any sign of resumed Russian export capacity would ease the global supply balance; a further extension keeps roughly 1 million barrels per day off the market
For context on where the market sits as these signals develop, NYMEX heating oil was priced around $227-228 per barrel in late September 2026, with the diesel crack spread above $120 per barrel. The fragility runs both ways: losing another 500,000 barrels per day of US supply could double crack spreads, adding roughly $50 per barrel.
A reader tracking those three signals, the US-EU spread, Chinese Q4 quotas, and the Russian ban decision, has far more actionable foresight into diesel direction than one watching headline pump prices or crude benchmarks alone. These are the variables that move first. Pump prices follow.
What the next 90 days will decide
The crisis sits on a three-way dependency, and the next 90 days bring all three to a decision point at once. It eases if China sustains exports at or above August levels, Russia’s producer ban lapses in November, and the US avoids an export ban. It deepens if any one of those breaks the wrong way and the others fail to compensate.
The three paths are straightforward to picture:
- All improve: Chinese supply holds, Russian ban lapses, no US ban. Crack spreads begin compressing, with the $30-40 per barrel relief from an extra 500,000 barrels per day of Chinese supply as the most quantifiable upside.
- Mixed: one variable moves favourably while another tightens, leaving the balance roughly where it is.
- All deteriorate: a US export ban, a Russian ban extension, and Chinese quota tightening together.
The asymmetry that matters The downside scenario carries a far larger price shock than the upside carries relief. With crack spreads already above $120 per barrel, there is limited room to compress further on a short timeline, but ample room to spike if supply tightens again.
The nearest binary event is the Russian ban expiry on 31 October 2026. The US electoral calendar sets the political deadline shaping any export-ban window.
The resolution will not show up first at the pump. It will appear in freight rates, food cost indices, and producer price data. Watch those with as much attention as you give crude benchmarks, because that is where this crisis is actually being paid.
This article is for informational purposes only and should not be considered financial advice. Investors should conduct their own research and consult with financial professionals before making investment decisions. Past performance does not guarantee future results. Financial projections are subject to market conditions and various risk factors, and forward-looking scenarios described here are speculative and subject to change based on market and policy developments.