
Most people who own investments could not explain what those investments actually do. They know stocks “go up and down” and bonds are “safer”, but ask them how a stock actually generates a return, or why a bond loses value when interest rates climb, and the answer tends to trail off.
That gap between owning something and understanding it is exactly where poor decisions live.
Asset classes are not interchangeable containers for money. Each one has a distinct engine for generating returns, a distinct set of risks built into its structure, and a distinct job it does inside a portfolio.
Understanding those mechanisms does not need a finance degree. It needs plain-English explanations of how each instrument works and what you are actually signing up for when you buy it.
This gives you a clear functional picture of every major asset class, the tools used to evaluate them, and the structural traps that catch even experienced investors off guard. By the time you finish, you will have the vocabulary to look at any investment and ask the right questions about it, rather than nodding along to a pitch you cannot fully assess.
What an asset class actually is, and why the differences matter
An asset class is not a filing label. It is a group of investments that share the same fundamental way of generating returns and the same category of risk.
Equities, bonds, property trusts, commodities, and cryptocurrency are not five names for roughly the same thing. They are five different machines, each with its own way of turning your capital into a return, and its own way of losing it.
That distinction has real consequences. Because each machine runs on a different fuel, they behave differently when the same thing happens to the economy. That is the entire structural basis for spreading your money across them.
Here is the core return engine behind each one, stripped to a single line:
- Equities: capital appreciation (the business growing in value) plus dividends (the business sharing its profits with you).
- Bonds: coupon payments (agreed interest) plus return of your principal at maturity.
- REITs: rental income distributed to you as regular payments.
- Commodities and gold: price change only. No yield, no income.
- Cryptocurrency: price change only. No yield, no income.
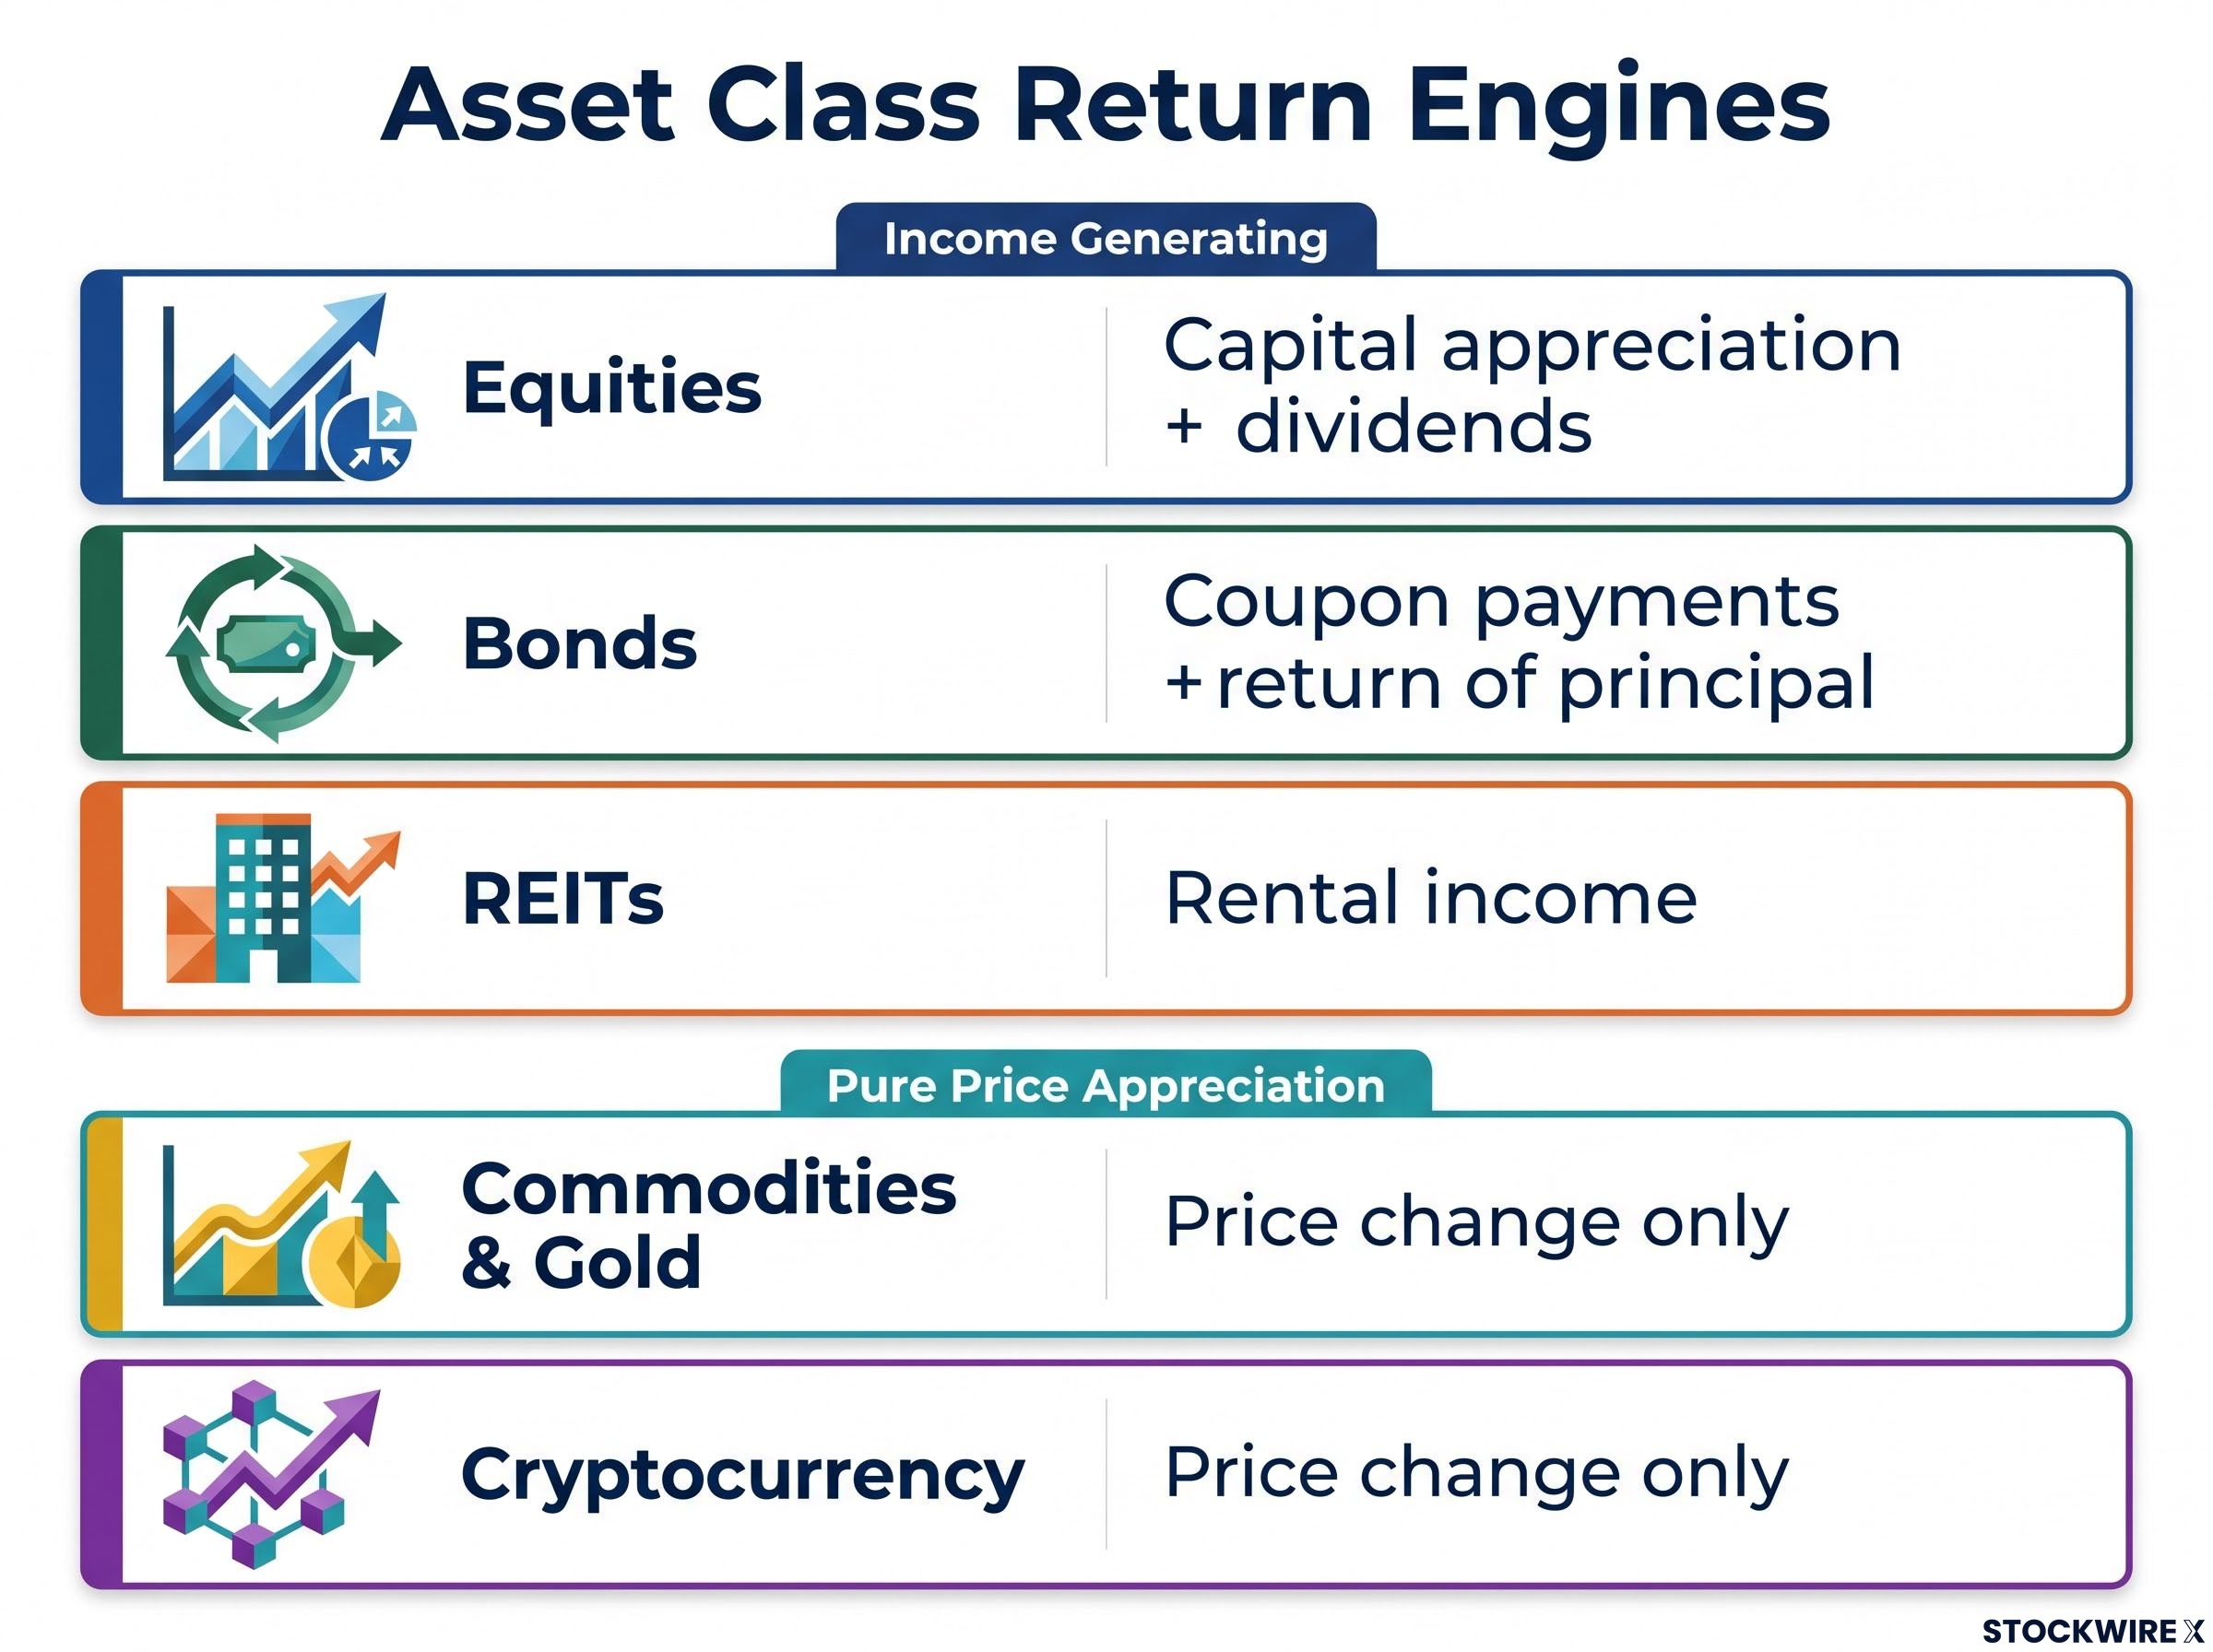
This is where the most common misunderstanding about diversification lives. Owning five different stocks is not diversification in any structural sense, because all five run on the same engine and carry the same category of risk. If the equity market falls, all five tend to fall together.
Institutional consensus from Vanguard, BlackRock, and Morningstar consistently holds that diversification across asset classes, not clever timing of individual positions, is the most reliable tool for managing portfolio risk.
The quantitative case for combining uncorrelated return streams is more precise than most diversification discussions convey: Dalio’s framework shows that 15-20 genuinely independent streams, each with a positive expected return and a correlation below approximately 0.3 with every other stream, can reduce portfolio volatility by around 80% without reducing expected returns.
Why mixing mechanisms reduces risk
Assets with different return engines tend to react differently to the same economic event. That divergence is the point.
Take a sharp rise in interest rates. Bond prices fall, because newer bonds now pay more and your older, lower-paying bond becomes less attractive. Rate-sensitive equities can wobble too, particularly high-growth companies whose value depends on distant future profits. Gold, which pays no yield and answers to different drivers, may barely move on the same trigger, or move for entirely separate reasons.
Over most multi-decade measurement periods, broad equities have delivered higher long-run average returns than investment-grade bonds and gold. The trade-off is materially deeper drawdowns along the way. Mixing engines does not guarantee gains, but it stops a single economic event from taking down everything you own at once.
When big ASX news breaks, our subscribers know first
Equities and fixed income: the two engines most portfolios run on
Stocks and bonds sit at the core of almost every long-term portfolio, so it is worth understanding precisely how each one produces a return. They behave differently under the same conditions for reasons built into their structure.
When you buy equity, you are buying a fractional slice of a real business. Your return comes from two places: the business growing in value over time, and the business handing a portion of its profits back to you as dividends.
Not every company pays dividends, and the ones that do are watched closely for consistency. The market tracks this with real seriousness: Dividend Aristocrats are companies with at least 25 consecutive years of annual dividend increases, and Dividend Kings have managed a full 50 years of unbroken increases. That kind of record is treated as evidence of financial durability.
A bond works on an entirely different principle. When you buy one, you are lending money to a government or a corporation, and in return they agree to pay you interest (the coupon) and hand back your original loan (the principal) at a set maturity date.
That makes the return profile far more predictable than equities. Historically, investment-grade bonds have delivered lower but more stable long-run returns. The trade-off is different risks: interest rate risk and credit risk instead of business risk.
Bond maturities span a wide range, from treasury bills of under 12 months to treasury bonds running 30 years. The longer the maturity, the more sensitive the bond’s price is to interest rate moves. That sensitivity is called duration.
Here is the feature that trips up most new bond investors:
Bond yields encode a great deal of information beyond a simple interest rate number: they reflect auction dynamics, secondary market repricing on inflation data, central bank policy expectations, and fiscal risk perceptions, all of which shift the price of your existing bond even when the coupon payment stays constant.
When interest rates rise, the market price of existing bonds falls. Newer bonds pay the higher rate, so yours, locked at the old lower rate, becomes less valuable to anyone wanting to buy it from you.
This is not a quirk. It is structural. And it matters directly to you.
If you are holding a long-duration bond fund while rates are rising, the fund’s market value is falling even though the underlying bonds are still paying out exactly as promised. Nothing has broken. The mechanism is simply doing what it does, and the longer the duration, the harder it bites.
| Asset class | Return mechanism | Key risk | Typical role | Duration sensitivity |
|---|---|---|---|---|
| Equities | Capital appreciation plus dividends | Business risk, deep drawdowns | Long-term growth engine | Low direct sensitivity |
| Investment-grade bonds | Coupon payments plus return of principal | Interest rate and credit risk | Income and stability | High, rises with maturity |
Understanding these two engines at this level lets you read market commentary and your own portfolio statements without depending entirely on someone else to interpret them for you.
REITs, commodities, and crypto: what the satellite assets actually do
Once you move past stocks and bonds, the differences between asset classes get wider, and so does the potential for misunderstanding. The most important line to draw here is between assets that generate income and assets that only pay off if someone else buys them from you at a higher price later.
A Real Estate Investment Trust, or REIT, lets you collect rental income from commercial property without buying, owning, or managing a single building. You hold a listed security; the trust holds the property and passes the rent through to you.
The defining structural feature of a US REIT is a statutory rule: it must distribute at least 90% of its taxable income to shareholders every year to keep its special tax treatment. That rule is what makes REITs such reliable income payers.
The US listed REIT market is large and established. As of 31 August 2026, roughly 180 REITs were tracked in the FTSE Nareit All REITs Index, representing a total equity market capitalisation of $1.61 trillion, with a dividend yield of 4.04%.
Here is the catch buried inside the appeal. The same 90% distribution rule that funds your income also starves the REIT of retained earnings. To grow, it has to raise new equity or take on new debt.
That means REIT investors are structurally exposed to capital markets conditions in a way that a company retaining its profits is not. When borrowing gets expensive, a REIT’s growth plans get expensive with it.
Commodities and gold work on an entirely different logic. They generate no income at all. Your return depends purely on price movement, driven by supply, demand, and sentiment. They are often held as a theoretical hedge against inflation, though that protection has proven inconsistent rather than guaranteed.
The structural split is worth holding in your head clearly:
- Income-generating satellite assets: REITs pay you rental income while you hold them.
- Pure price-appreciation assets: commodities, gold, and cryptocurrency pay you nothing while you hold them. The entire return depends on selling later at a higher price.
Cryptocurrency belongs firmly in that second group. It is a decentralised digital asset with no underlying cash flows and, in Bitcoin’s case, a permanently fixed maximum supply.
Bitcoin’s maximum supply is capped at 21 million units. This is a design feature written into the protocol, not an investment thesis. Scarcity alone does not make something valuable.
Cryptocurrency: what institutional adoption actually tells you
Institutional interest in crypto is real, but the details matter more than the headline. According to the Bitwise Institutional Crypto Adoption Report (September 2026), none of the 15 major institutions tracked reduced their crypto holdings during a roughly 50% market drawdown between late 2025 and mid-2026.
That sounds like conviction, and it is easy to read it that way. But look at the sizing. Bitwise found allocations typically ranged from 0.5% to 13% of investable assets, with the vast majority sitting at just 1-2%.
The 2026 EY-Parthenon and Coinbase institutional survey adds context: 73% of respondents plan to increase digital asset allocations, and 81% prefer regulated vehicles such as ETFs. Spot Bitcoin ETF assets under management stood near $108-111 billion by late September 2026, with cumulative net inflows since launch exceeding $57-58 billion.
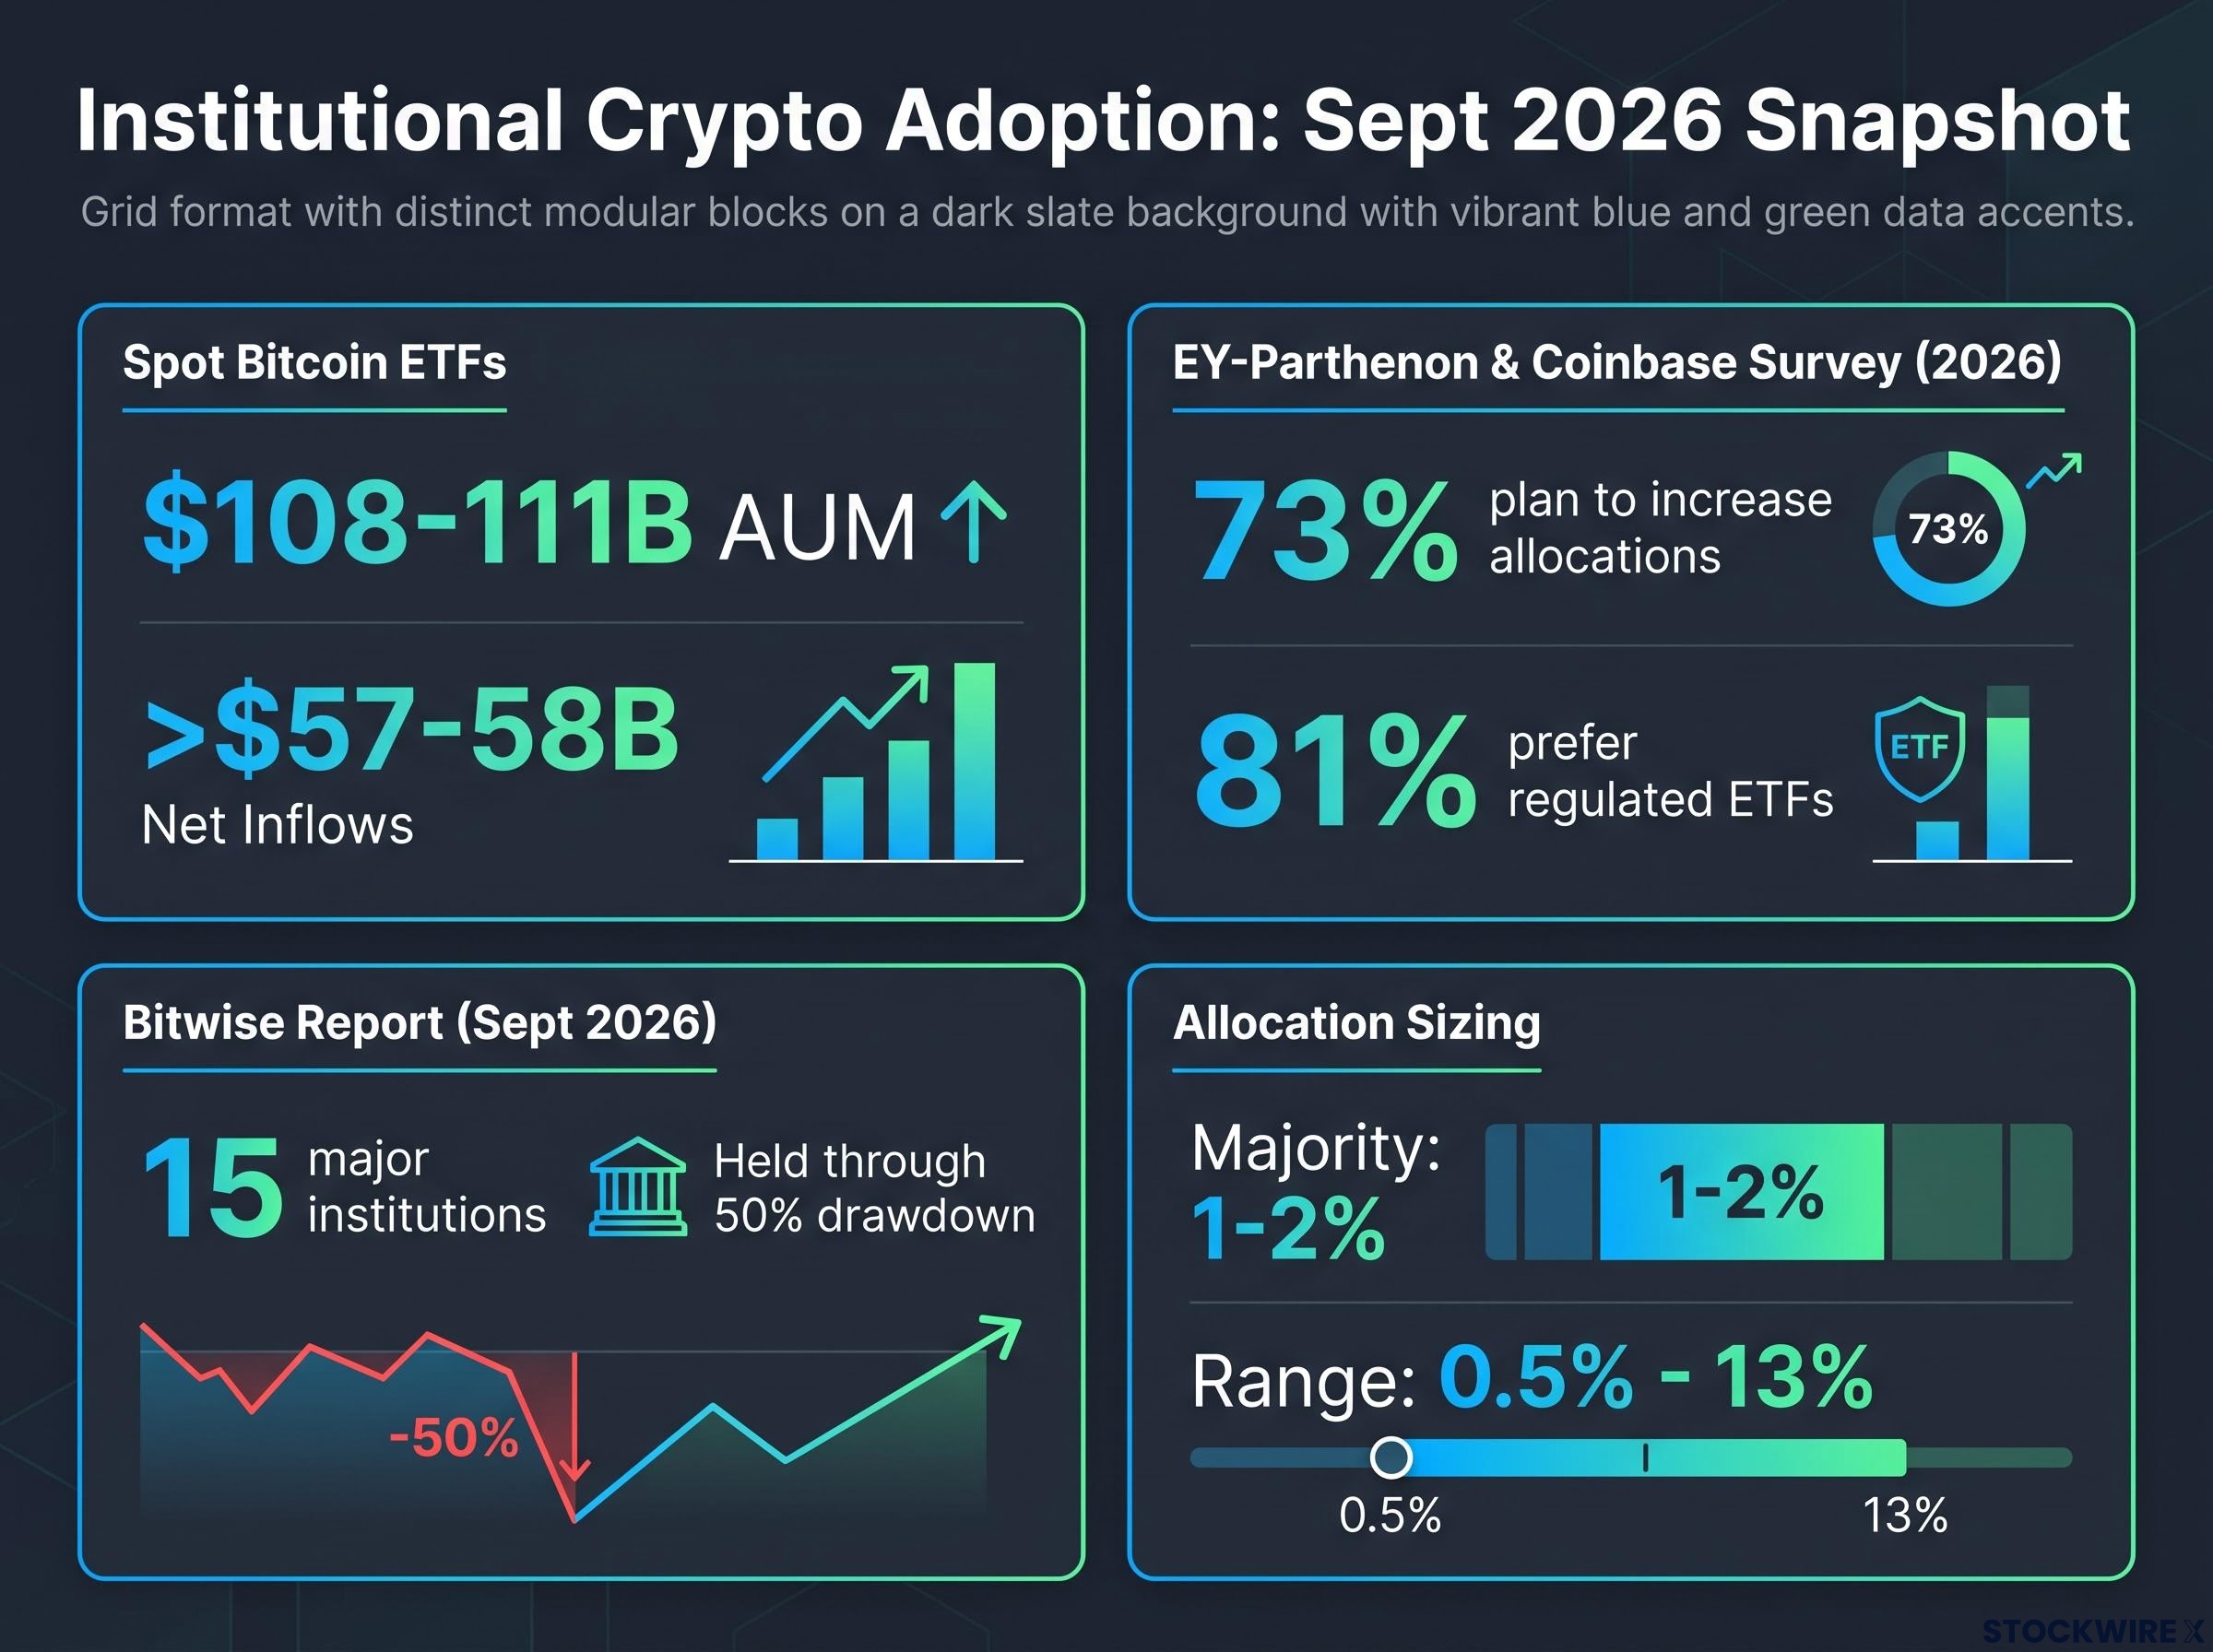
Here is what that 1-2% number actually tells you. It is a deliberate sizing decision that reflects acknowledged uncertainty, not full conviction. Holding through a 50% fall reflects an institution’s risk capacity and long time horizon, not a signal that a 50% drawdown is survivable, or acceptable, for every investor profile.
How to evaluate whether an investment is worth its current price
Once you understand what an asset does, the next question is whether its current price makes sense. Two very different analytical frameworks exist to answer that, and the mistake most people make is treating them as rivals rather than tools that ask different questions.
Fundamental analysis examines the underlying business or asset itself to estimate what it is genuinely worth. It looks at revenues, cash flows, competitive advantages, debt levels, and the quality of management. The CFA Institute frames it as evaluating a shop before you buy it: its profits, its debts, its lease terms, its customers.
Estimating intrinsic value is a process of discounting projected future cash flows rather than reading a current market price, and the terminal value assumption alone typically drives 60-80% of the total implied number, making it the single most important variable to stress-test before treating a valuation as reliable.
Two metrics do a lot of work here. The price-to-earnings (P/E) ratio tells you the premium you are paying for each dollar of a company’s earnings, a quick read on whether a stock looks expensive or cheap relative to its current profitability. The payout ratio tells you what percentage of net profit a company hands out as dividends versus keeping to reinvest, which is your first clue to whether a dividend is sustainable.
Technical analysis ignores all of that. It reads price and volume patterns to gauge short-term sentiment and momentum, working completely independently of whether the underlying business is strong or weak. The 50-day moving average, a running average of the closing prices over the previous 50 trading sessions, is the standard example. It smooths out daily noise to reveal the underlying direction.
Each approach has a signature failure. In fundamental analysis, it is the value trap: a stock with a tantalisingly low P/E that is cheap for a good reason, because something in the business is structurally broken. In technical analysis, it is curve-fitting: piling on so many indicators that you eventually “discover” a pattern that is really just random noise.
This is where the interpretive point sharpens. A low P/E tells you a stock is cheap relative to current earnings. It does not tell you whether those earnings are about to collapse, and that is precisely the question fundamental analysis exists to investigate before you mistake cheapness for opportunity.
| Dimension | Fundamental analysis | Technical analysis |
|---|---|---|
| What it examines | The underlying business or asset | Price and volume patterns |
| Key metrics used | P/E ratio, payout ratio, cash flow | Moving averages, volume, momentum |
| Time horizon it suits | Long-term | Short-term |
| Core limitation | Value traps | Curve-fitting to noise |
| Best used for | Assessing intrinsic worth | Reading sentiment and timing |
The four pitfalls to watch for, roughly in order of how often they catch people:
For readers wanting to put P/E analysis into practice as a screening tool, our full explainer on identifying undervalued stocks covers free cash flow yield and debt-to-equity ratio alongside P/E, showing how the three metrics work together as overlapping filters rather than standalone rules.
- Over-relying on a single metric, such as treating a low P/E as automatically cheap.
- Ignoring business reality by trading charts without understanding the company underneath.
- Curve-fitting with too many indicators until random noise looks like a signal.
- Confusing time horizons by mixing long-term goals with short-term trades.
The risks that do not show up in the returns
Return histories are everywhere. They are marketed, charted, and celebrated. Structural risks are the opposite: invisible until the exact conditions arrive that expose them. Every asset class has one.
Equities carry the risk of permanent capital loss. When a business’s fundamentals genuinely deteriorate or it heads towards bankruptcy, the loss is not a temporary dip. There is also the behavioural risk of panic-selling during a bear market, and equity drawdowns of 20-50% or more are a recurring feature of markets, not a rare accident. And there is the value trap, where a low valuation is masking real decline rather than flagging a bargain.
Bonds hide their risk inside their apparent safety. Duration risk means long-maturity bonds lose price sharply when rates rise. Credit can deteriorate even in investment-grade issuers. And inflation quietly erodes the buying power of those fixed coupon payments over the years.
REITs concentrate several risks at once. Their leveraged capital structures make them highly sensitive to interest rates. Sector concentration bites hard, with retail REITs squeezed by e-commerce and office REITs pressured by the structural shift to remote work.
The reader who grasps that a REIT’s income appeal and its capital-structure weakness are two faces of the same 90% distribution rule is far better placed to judge a REIT in a rising-rate environment than one who only sees the dividend yield.
Commodities suffer long, multi-year price slumps, and many commodity products use futures contracts, where structural costs like contango and backwardation can pull your actual return well away from the headline spot price. Crypto carries the largest tail risk of all, with historical drawdowns exceeding 50-80%, and no intrinsic cash flows, which makes valuing it a narrative exercise rather than a numerical one.
| Asset class | Primary structural risk | Secondary risk | Condition that exposes it |
|---|---|---|---|
| Equities | Permanent capital loss | Panic-selling in drawdowns | Business fundamentals collapse |
| Investment-grade bonds | Duration risk | Inflation erosion of coupons | Sharp rise in interest rates |
| REITs | Interest rate sensitivity | Sector concentration | Rising rates plus a sector shock |
| Commodities and gold | No intrinsic cash flow | Roll costs from futures | Multi-year price slumps |
| Cryptocurrency | Extreme tail-risk drawdowns | Valuation by narrative only | Risk-off market shock |
Underneath all of these sits one principle that applies across every asset class:
Money you need in the short term should not be exposed to volatile asset classes, regardless of how attractive the potential return looks. Time horizon comes first.
Building with the full picture in hand
Pull it all together and the core insight is simple. Each asset class has a distinct job inside a portfolio, and the discipline of investing is matching those jobs to your own goals, time horizon, and risk tolerance.
The evaluative tools covered here, from P/E and payout ratios to the difference between fundamental and technical frameworks, are instruments for ongoing assessment. They are not one-time checks you run before you buy and then forget.
Institutional guidance from Vanguard, Morningstar, BlackRock, and the CFA Institute points consistently in one direction: broad diversification across asset classes, with periodic rebalancing, is more reliable than trying to time market cycles. On crypto specifically, mainstream educators suggest that if you include it at all, a small satellite allocation of 1-5% is the appropriate size, never a replacement for core equity and bond exposure. The Bitwise finding that institutions typically size crypto at 1-2% gives you a useful calibration point.
Before you add anything to a portfolio, ask three questions:
- What is the mechanism by which this generates a return?
- What structural risk is baked into that mechanism?
- What market condition would expose that risk most severely?
The most dangerous investment is one you cannot explain, because if you cannot explain it, you cannot assess its risks. The reader who can now name what engine each of their holdings runs on, and what structural risk each one carries, is already operating at a higher level than the one holding the same portfolio without that understanding. That is what financial literacy actually buys you: the ability to ask a precise question instead of accepting a vague assurance.
This article is for informational purposes only and should not be considered financial advice. Investors should conduct their own research and consult with financial professionals before making investment decisions. Past performance does not guarantee future results, and financial projections are subject to market conditions and various risk factors.