
Consider one number against another. In September 2026, the Japanese yen gained 6.57% against the New Zealand dollar. In the same month, the kiwi lost ground against every single major currency it was tracked against.
Those two figures are not accidents of the same period. They are the top and bottom of a ranking, and the sorting mechanism between them was central bank policy. September was the month that policy divergence stopped being an abstract talking point and started showing up in percentage terms.
The Bank of Japan raised rates to a 31-year high. The Reserve Bank of New Zealand hiked too, then muddied the signal with talk of uncertainty. The Federal Reserve held its hawkish posture. The European Central Bank was read as comparatively soft. Each of those stances mapped directly onto a spot in the currency performance stack. After working through the data and its drivers here, you should be able to look at a cross-rate table and understand not just what moved, but why the hierarchy formed the way it did, and what would need to change to flip it.
The performance stack: who moved, by how much, and in which direction
The yen sat at the top, and it was not close. The largest move in the entire dataset was the yen’s 6.57% gain against the New Zealand dollar, followed by 4.99% against the Swiss franc and 4.71% against the Australian dollar. Against the Canadian dollar it added 4.20%, against the euro 3.91%, and against sterling 3.65%. Even against the US dollar, the hardest currency to beat all month, the yen managed 1.51%.
Read down that list and a pattern emerges before anyone labels it. The yen gained most against risk-sensitive, commodity-linked currencies and least against the dollar. That ordering is not random noise. It is a hierarchy sorted by how much policy credibility each central bank was projecting.
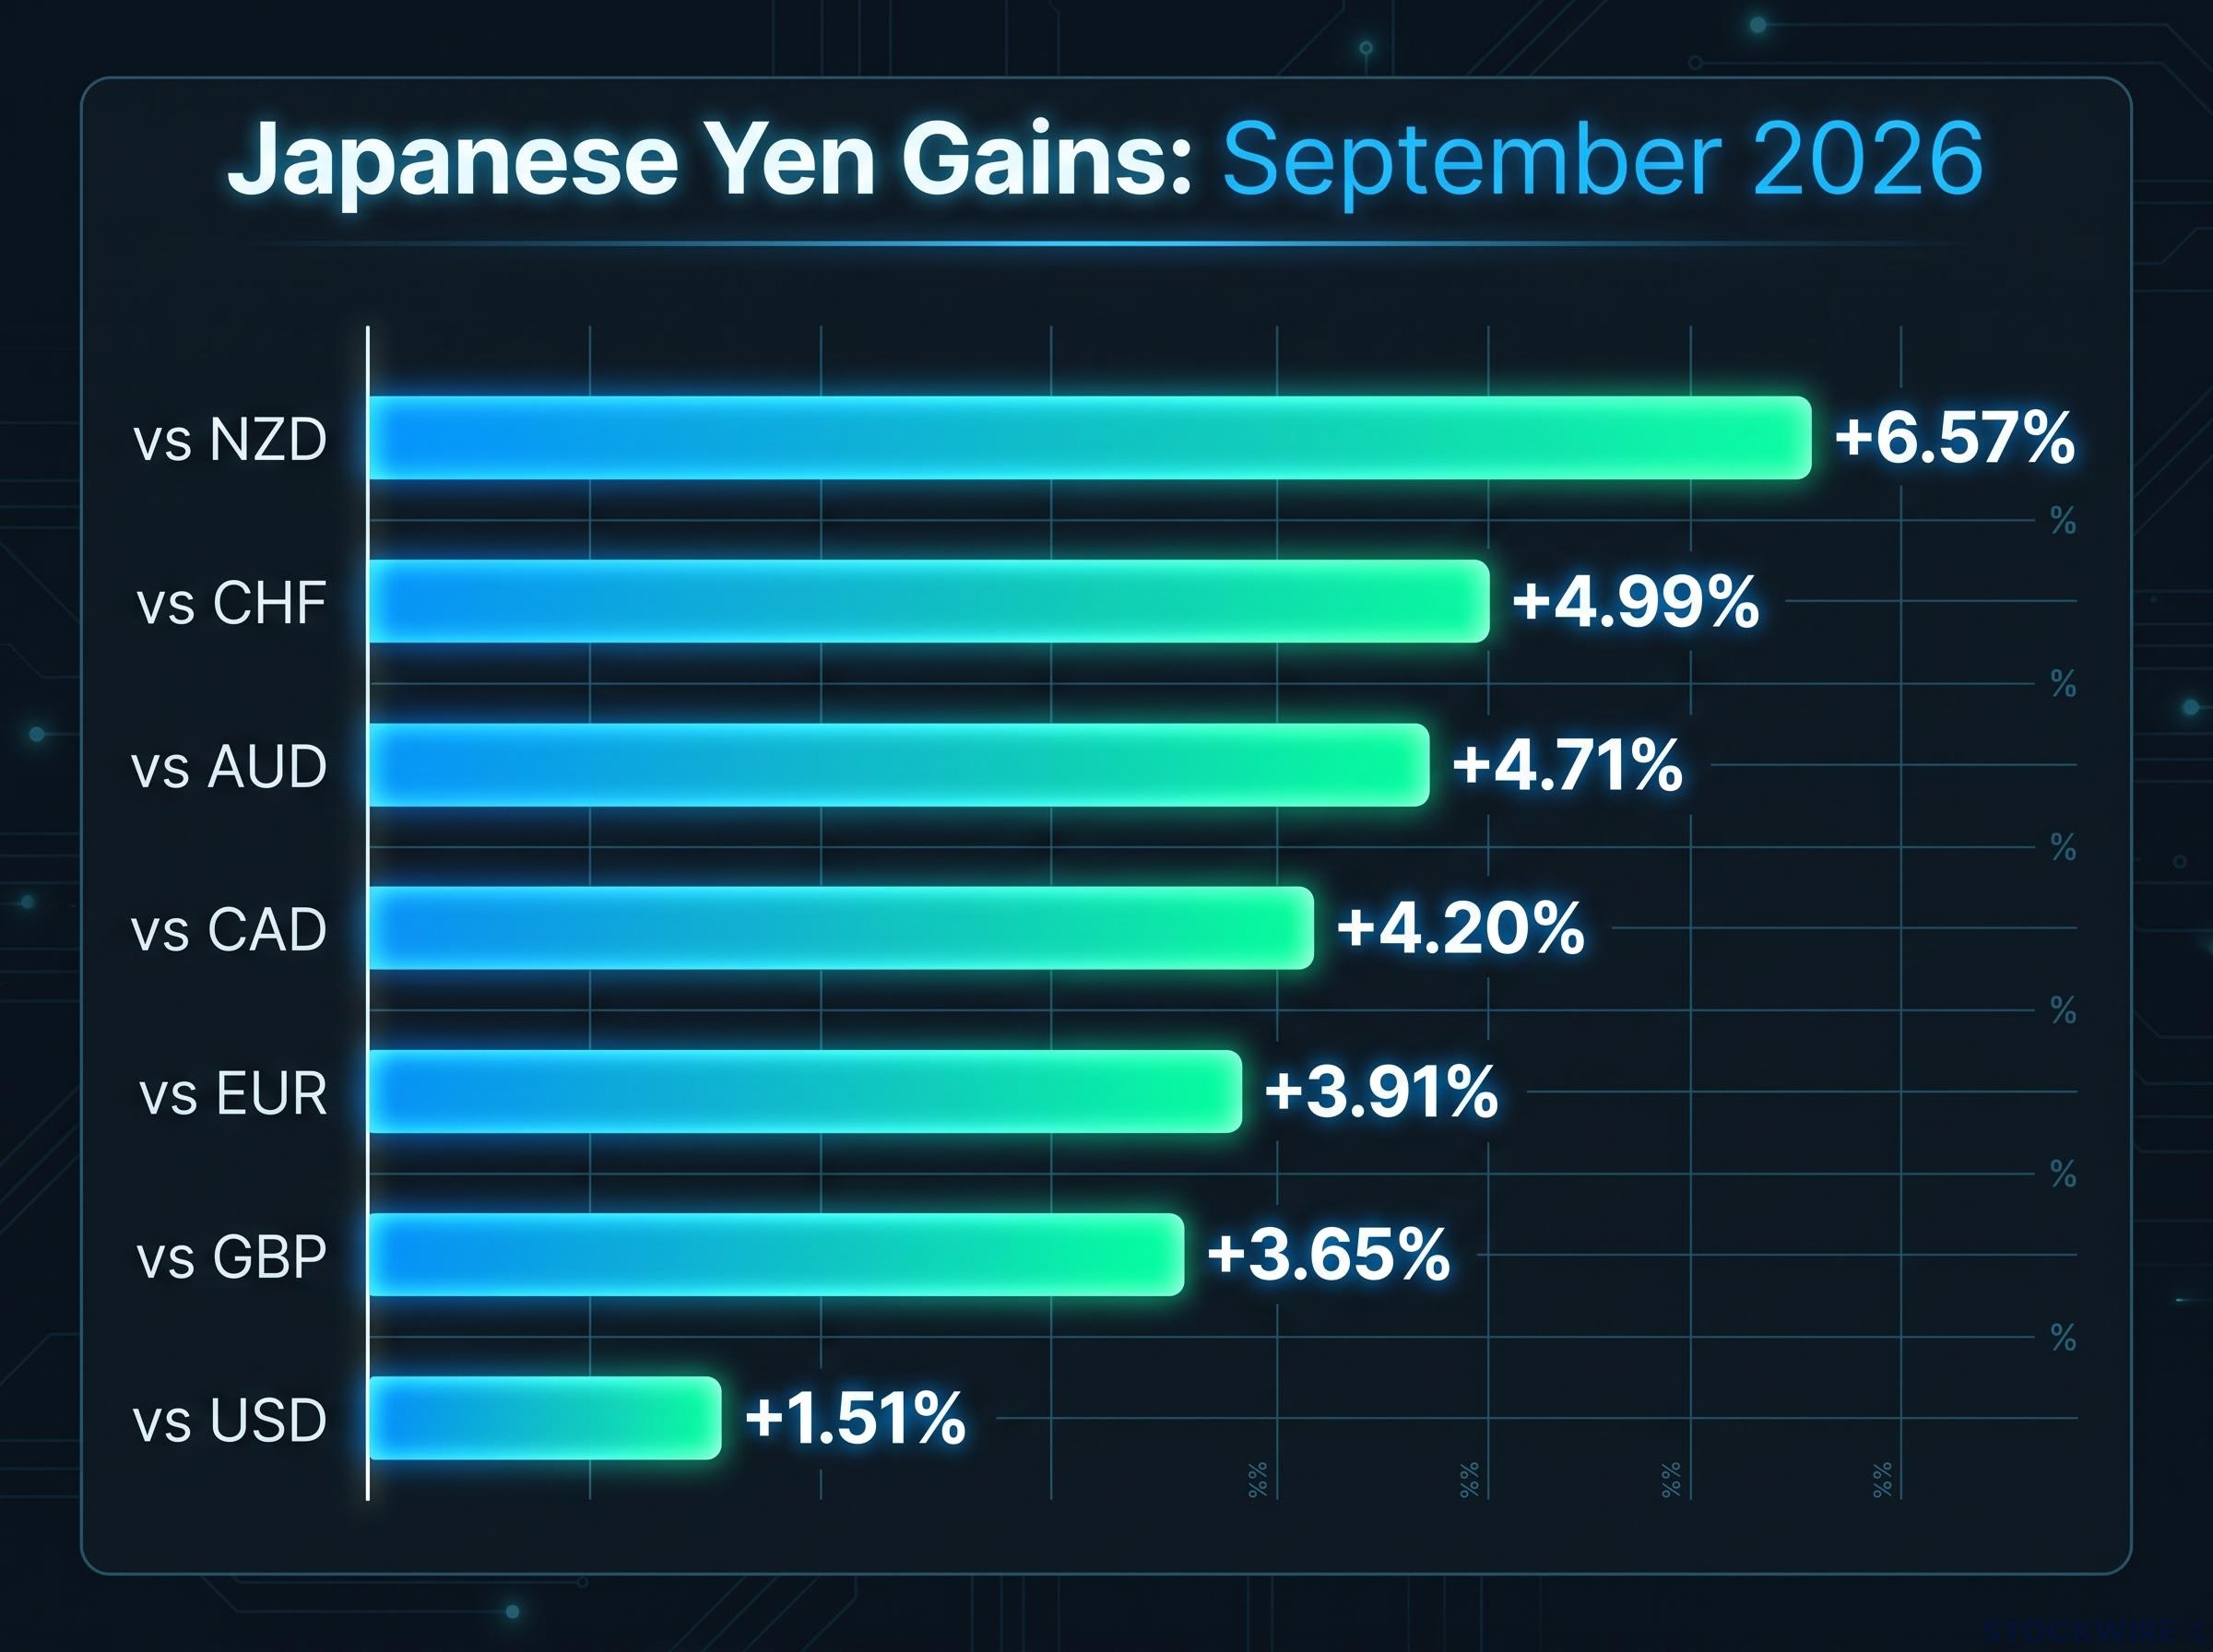
| Currency Pair | JPY Move | EUR Move | NZD Move |
|---|---|---|---|
| vs USD | +1.51% | -2.49% | -5.02% |
| vs JPY | – | -3.91% | -6.57% |
| vs GBP | +3.65% | -0.29% | Weaker |
| vs NZD | +6.57% | +2.47% | – |
| vs CHF | +4.99% | +0.83% | Weaker |
At the bottom of the stack sat the New Zealand dollar, down roughly 5.02% against the US dollar and 6.57% against the yen. It underperformed every major it was tracked against, not just a handful.
EUR’s split result: stronger than some, weaker than others
The euro is the puzzle in the middle, and its mixed results are the clearest evidence of the sorting logic at work. It fell 2.49% against the dollar and 3.91% against the yen, yet it gained 2.47% against the kiwi, 0.83% against the franc, 0.63% against the Aussie dollar, and 0.14% against the loonie. Against sterling it was nearly flat at -0.29%.
That split reflects the euro’s structural position: not the most hawkish central bank, not the most dovish, but stuck in between. Against currencies backed by tighter policy (the dollar, the yen) the euro loses. Against risk-sensitive and commodity-linked currencies it wins. Two different dynamics running at once produce a genuinely mixed cross-rate scorecard by design.
EUR/USD three-month low The euro fell 0.3% on the day to 1.1332 on 29 September 2026, its lowest level against the dollar since 24 June 2026, according to Anadolu Agency.
By month-end the spot levels confirmed the ranking. USD/JPY had fallen to around 157.28 and NZD/USD to 0.5630 on 29 September 2026, per TradingEconomics. What all this data tells you is that September was not a scatter of unrelated moves. It was a structured ranking, and policy credibility was the mechanism doing the sorting.
When big ASX news breaks, our subscribers know first
What drove the yen’s broad-based advance
The yen’s strength was broad because more than one force was pushing it. Three reinforcing mechanisms were operating at the same time:
- Rate differential compression as the BOJ normalised policy
- Repatriation flows as Japanese capital found reasons to come home
- Official verbal intervention amplifying the directional move
Start with rates. Reuters reported the Bank of Japan lifted its policy rate to 1.25% in mid-September, the highest level in 31 years. Each step away from ultra-low rates narrows the gap between Japanese yields and everyone else’s, and that compression removes a chunk of the reason to hold other currencies over the yen.
Beyond rate compression, yen safe-haven flows add a mechanical layer to any broad-based yen advance: when carry trades unwind, investors must buy back the yen they borrowed to fund those positions, creating demand that is structurally separate from policy expectations.
A 31-year high The BOJ’s 1.25% policy rate is the highest Japan has seen in over three decades, a milestone that reset the calculus behind every yen cross.
Then come the flows. A 7 September Reuters piece linked the yen’s surge to a seven-month high, below 153 per dollar, to growing bets that Japanese investors would repatriate funds. As domestic rates rise, the incentive to park money in higher-yielding foreign assets weakens, and capital rotating back toward yen assets adds its own upward pressure.
The third force was verbal. Bloomberg reported on 28 September that the yen rallied as much as 0.4% to 156.51 per dollar after Japan’s currency czar warned about yen weakness. On a separate occasion, The Star reported the yen strengthened as much as 1.2% to 156.94 per dollar when officials raised weak-currency concerns in meetings with US counterparts, outperforming all its Group-of-10 peers that day.
Here is what the mix tells you if you hold carry trades, yen-hedged assets, or Japan-linked equities: the strength was structurally grounded but tactically amplified. The rate differential is durable. The jawboning is not. When the BOJ hiked on 18 September, two policymakers dissented, and Reuters noted the dollar jumped to as much as 158.05 yen on the news, a reminder of how quickly the tactical layer can peel away when conviction in further tightening wobbles.
Why the kiwi fell hardest, and what the NZD story reveals about carry dynamics
Here is the paradox that defines the kiwi’s September. The RBNZ raised its Official Cash Rate to 2.75% on 2 September 2026, its second consecutive hike, and the currency still fell against every major tracked all month. A rate rise is supposed to support a currency. This one did the opposite.
The resolution lies in the sequence:
The NZD/USD driver hierarchy places risk sentiment at the top, above RBNZ guidance, Chinese activity data, and dairy auction results, which explains why a technically positive rate hike can still produce a sharp kiwi sell-off when the risk backdrop is deteriorating simultaneously.
- The RBNZ hiked, mechanically a positive for the kiwi
- Governor Breman called the timing of further increases “highly uncertain,” which markets read as a signal the tightening cycle was near its peak
- The kiwi’s own risk-sensitive nature amplified the resulting sell-off
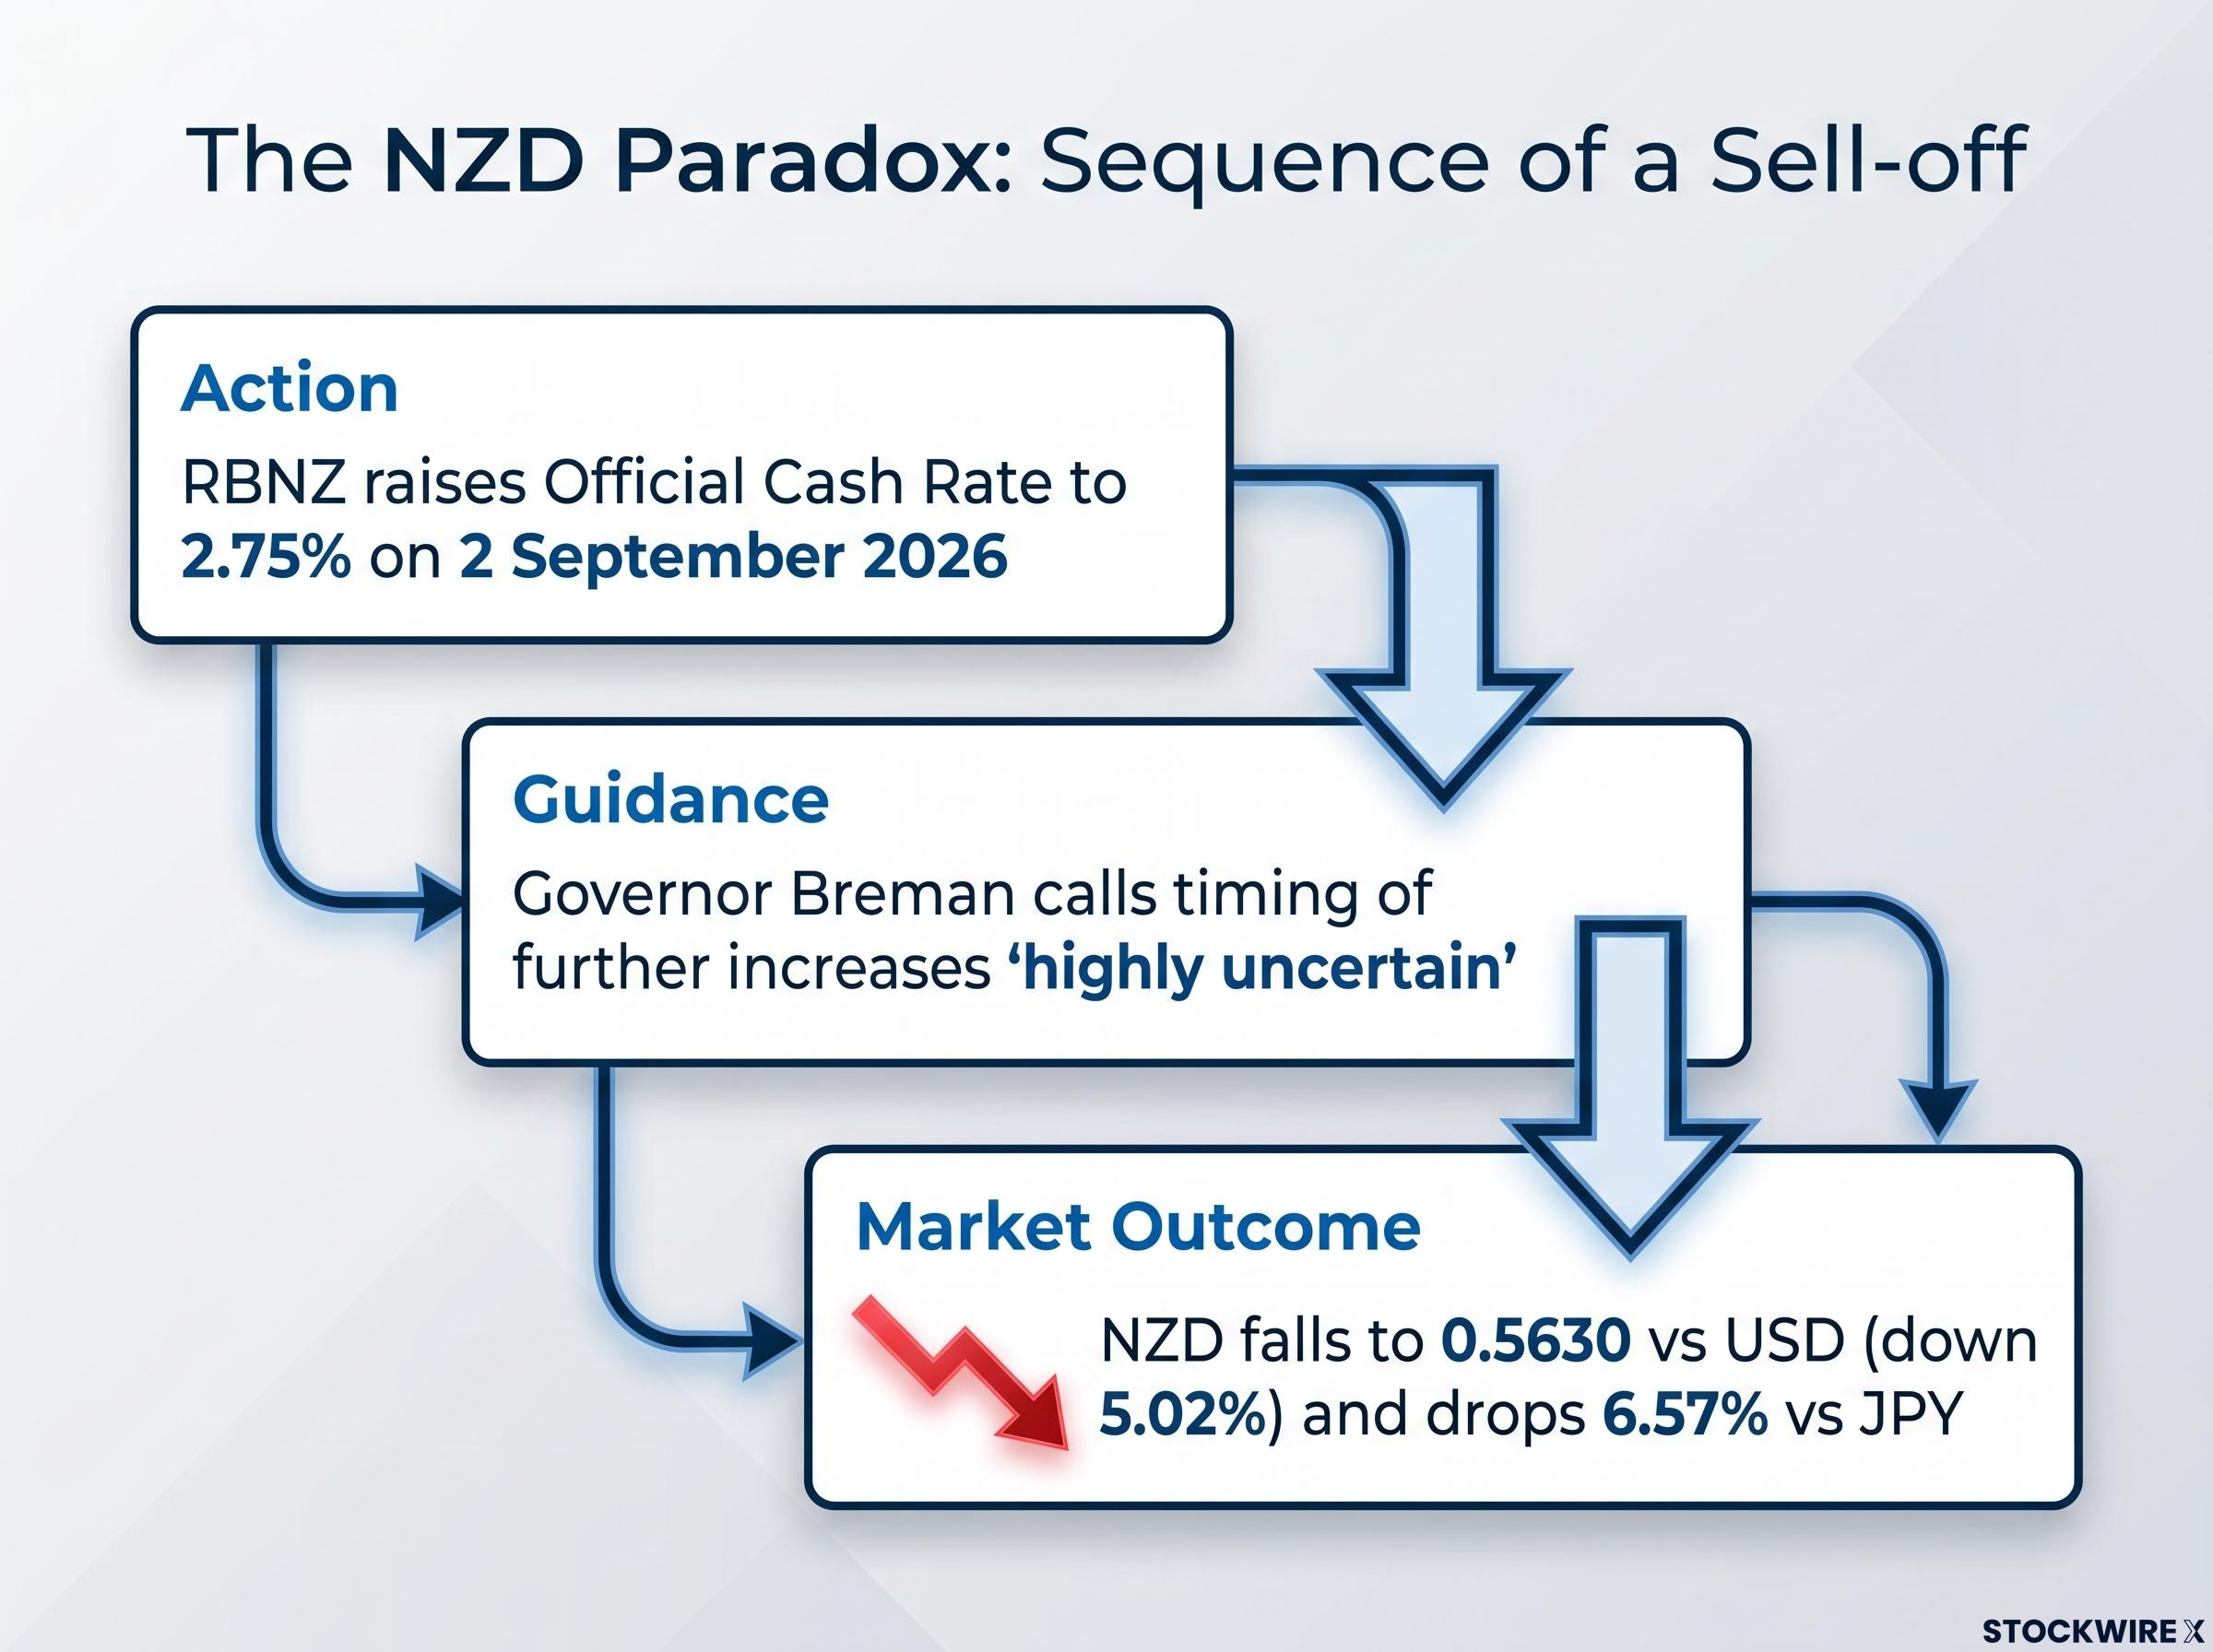
The forward guidance did the damage. According to TMGN, Breman’s “highly uncertain” language neutralised the carry appeal of the hike itself. A rate rise raises the yield on holding a currency, but if the central bank signals it is about done, traders stop pricing in more, and the yield advantage stops growing. The kiwi ended the month around 0.5630 against the dollar, a monthly drop of roughly 5.02% by the original data (TradingEconomics logs 4.82% over its slightly different window), and about 6.57% against the yen, the single largest cross-rate move anywhere in the dataset.
Carry trade profitability research published through EconStor finds that cyclical components of interest rate differentials, not just their absolute levels, drive the returns to holding high-yielding currencies, which explains why the RBNZ’s guidance on the pace of future hikes mattered more to traders than the hike itself.
The read for you is direct: in FX, the direction of rate guidance matters more than the current level of rates. A currency whose central bank telegraphs a pause gets sold even while it is technically still tightening. That principle applies just as cleanly to the Australian dollar and every other carry-dependent currency.
NZD as a risk barometer: what its September move signals about global sentiment
The kiwi is a pro-cyclical currency, meaning it tends to strengthen when global growth and risk appetite are firm and weaken when investors reach for safety. That makes its monthly performance a rough proxy for global sentiment.
September’s sharp decline was consistent with a risk-off tilt in wider markets and a firm US dollar. TradingEconomics data also shows the kiwi down 2.85% against the dollar over the prior 12 months, so the September drawdown extended a longer downtrend rather than breaking a calm one. For you, that means the kiwi’s move is worth watching even if you hold no New Zealand assets at all, because it doubles as a sentiment gauge.
For investors tracking the kiwi’s recovery prospects, our full explainer on NZD/USD and US Treasury yields examines why the direction of US rates is a stronger leading indicator for NZD/USD than any domestic New Zealand data release.
ECB, Fed, and BOJ divergence as the structural frame behind the month’s FX moves
Everything above rests on one concept, and it is worth naming plainly. The interest rate differential is the gravitational force in currency markets. When one central bank raises rates while another holds or eases, capital tends to flow toward the higher-yielding currency, and that flow strengthens it.
The interest rate differential is the gravitational force in currency markets, but it transmits through carry trade channels that can amplify or invert the directional signal depending on whether the rate gap is widening, stable, or beginning to close.
Line up the three banks and September’s stack explains itself.
| Central Bank | Current Rate | Policy Direction | FX Implication |
|---|---|---|---|
| BOJ | 1.25% | Actively normalising | Yen-supportive |
| Fed | Held | Hawkish watch | Dollar-supportive |
| ECB | Neutral-to-soft | Closer to a pause | Euro soft |
The BOJ was actively normalising toward its 31-year-high 1.25% rate, which is why the yen led. The Fed held but stayed on a hawkish watch, weighing whether incoming inflation data justified another move, which kept the dollar firm. The ECB was perceived as closer to neutral, and that softer posture left the euro trailing both.
That perception is why EUR/USD sat near a three-month low of around 1.1332 to 1.1353 at month-end, per Anadolu Agency and TradingEconomics, while the euro still outperformed the risk-sensitive kiwi and Aussie.
Quantitative tightening (QT) QT is the reversal of bond-buying stimulus: the central bank stops purchasing new bonds and stops reinvesting the proceeds of maturing ones. Because it withdraws money from the system, QT is generally treated as positive for the currency.
The euro had that structural QT support in principle. But a neutral-to-dovish stance in September meant it was not enough to offset dollar and yen strength. What this framework tells you is that the September ranking was predictable given the inputs, and the same framework will keep sorting currency outcomes until the policy divergence narrows.
What would need to change to reverse September’s FX hierarchy
The hierarchy holds only as long as its assumptions do. Each currency’s position rests on specific conditions that incoming data can test. Three reversal scenarios are worth watching:
- Yen fragility: strong US data or renewed Fed hawkishness reopening the rate gap
- NZD recovery: the RBNZ turning more convincingly hawkish, or risk appetite rebounding
- EUR pivot: the ECB hardening its tone, or US data softening the Fed’s path
The yen’s vulnerability is already visible in the record. Two BOJ members dissented from the September hike, and Reuters reported the dollar jumped to 158.05 yen on that announcement. The yen also retreated within the month from its seven-month high below 153 per dollar to around 157.48 by 21 September, and the rally after the currency czar’s warning faded later in the New York session, per Bloomberg.
The intramonth reversal The yen ran from a seven-month high below 153 per dollar to around 157.48 within the same month, a concrete illustration of how quickly its strength can unwind.
The kiwi is the mirror image. Having fallen roughly 5% in the month and 2.85% over the prior year against the dollar, it is deeply oversold. If the RBNZ signals more hikes with conviction, or if global sentiment rotates toward high-beta currencies, that drawdown gives it room to rebound sharply.
The euro’s fate hinges on relative positioning. If the ECB shifts hawkish, or US data softens enough to pull the Fed’s trajectory down toward Europe’s, EUR/USD would recover from its 1.1332 three-month low. The takeaway is that September’s ranking is durable while the divergence holds, but each position can be tested by data over the next one to two months.
Reading the October FX landscape before the next central bank move
September’s outcome was not luck. It was the product of identifiable inputs: BOJ normalisation, RBNZ guidance uncertainty, a Fed hawkish hold, and a neutral ECB. Leave those inputs unchanged, and October should produce a broadly similar ranking.
The variables that will confirm or disrupt the pattern are a short, watchable list:
- BOJ communication on the pace of further hikes
- Any shift in RBNZ signalling tone
- US inflation data and the Fed’s response
- ECB rate decision language
Whether you hold yen-exposed assets, track the kiwi for recovery signals, or watch EUR/USD for a bounce off its 1.1332 low, that list is your lens. Remember that the currency czar’s jawboning effect faded within a single session, which confirms verbal intervention is a short-term tool, not a structural driver. Tracking these four inputs over the next four to six weeks will tell you whether September’s hierarchy holds or rotates.
This article is for informational purposes only and should not be considered financial advice. Investors should conduct their own research and consult with financial professionals before making investment decisions. Past performance does not guarantee future results. Financial projections are subject to market conditions and various risk factors.