
Overnight index swap markets are pricing roughly 100 basis points of additional ECB tightening through 2027. That would put the deposit rate near 3.50%. The rate sits at 2.50% today, and one major institutional research desk says the cycle ends at 2.75%.
Someone is materially wrong. In late September 2026, with the ECB one 25-basis-point decision away from that lower figure, the answer carries direct consequences for anyone holding euros or positioning around the central bank’s path.
Here is a concrete framework for reading whether rate expectations are mispriced, what the resolution means for EUR/USD, and where the genuine risks to that thesis sit. This is not a prediction. It is an analytical lens you can apply the next time market pricing and central bank delivery pull apart.
A 75-basis-point gap: what markets are pricing versus what the ECB is likely to deliver
Start with the arithmetic, because the size of the divergence is the whole story.
The ECB deposit facility rate stands at 2.50%, effective 16 September 2026, having stepped up from 2.25% on 17 June 2026. That is the anchor. Everything else is a claim about where the rate goes from here.
The deposit facility rate is the true policy signal because it reprices the overnight cost of money for every bank in the eurozone system instantly, making it the number that anchors OIS pricing, yield curves, and EUR positioning rather than the MRO or marginal lending facility rates that feature in older commentary.
TD Securities places the endpoint one hike away. Its Macro Research team expects a single 25 basis point increase in December to lift the deposit rate to 2.75%, which it characterises as mildly restrictive, and then a full stop. Sustained growth and lingering inflation keep policymakers oriented toward moderately restrictive territory, but not beyond it.
The OIS market disagrees, and not by a small margin. Overnight index swaps, the instruments that price where traders expect central bank rates to settle, imply roughly 31 basis points of further tightening through end-2026, building to close to 100 basis points cumulatively through end-2027.
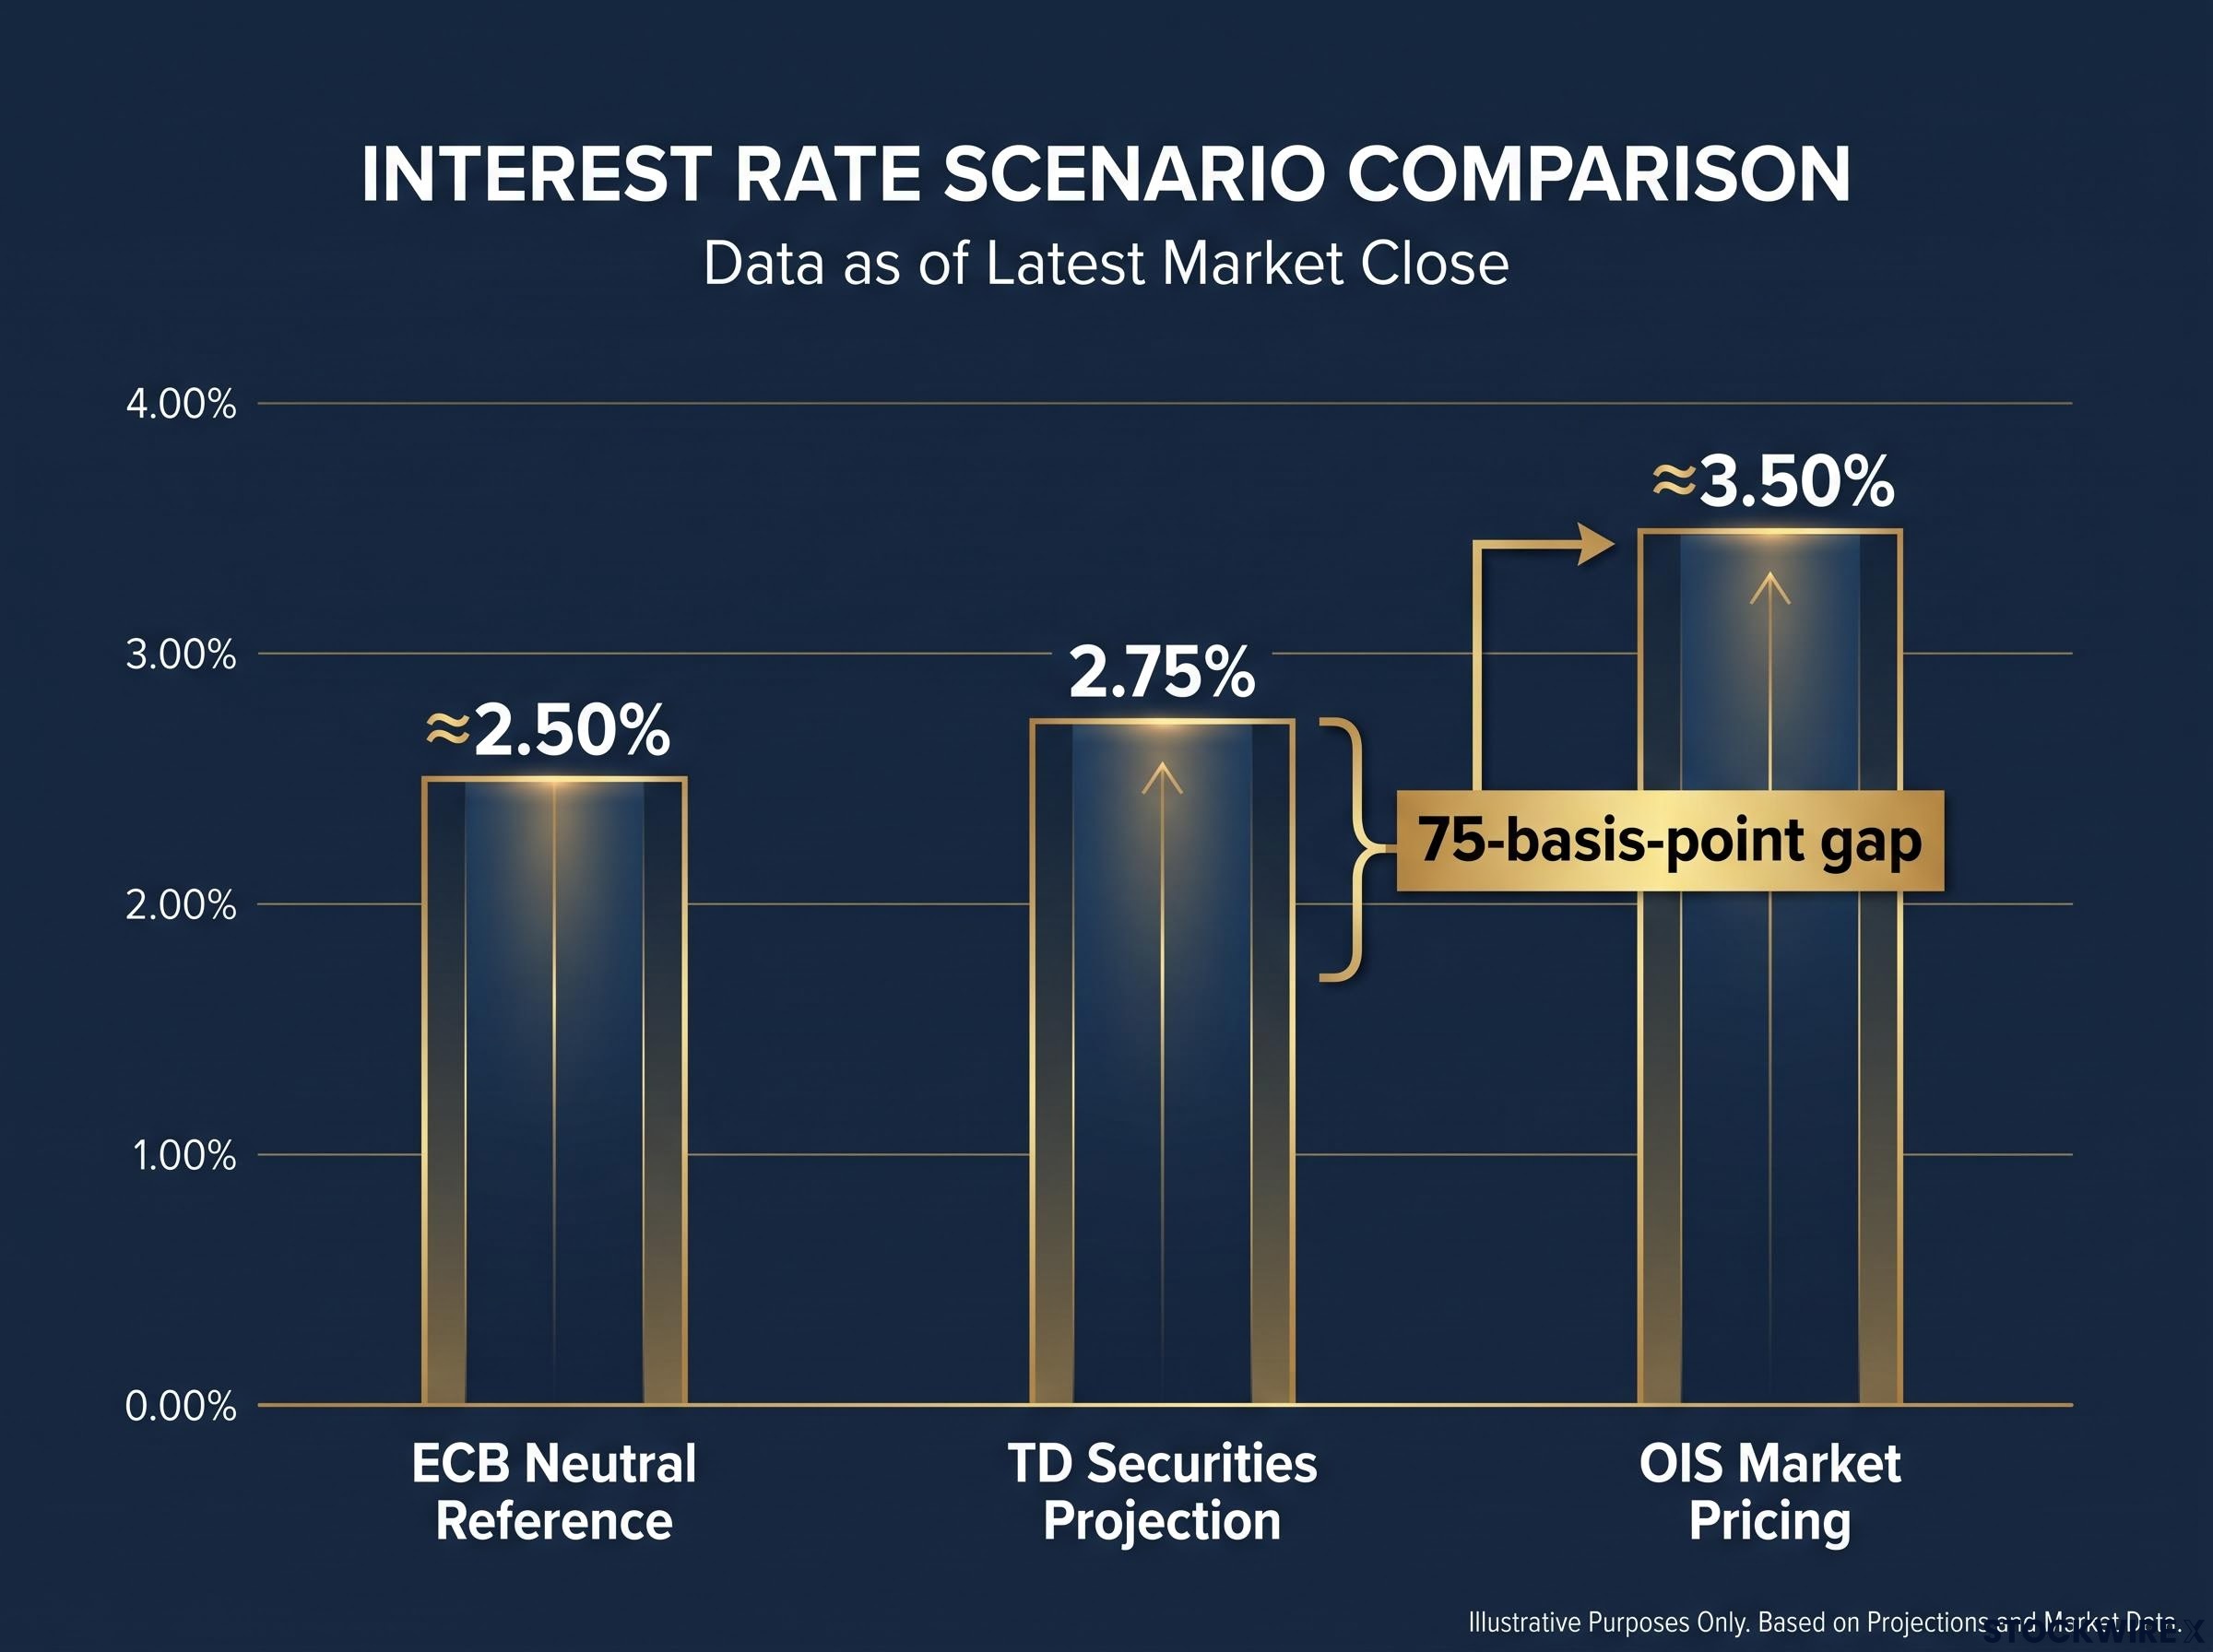
The OIS-implied terminal rate sits near 3.50%, a full 75 basis points above what TD Securities projects and a level no ECB policymaker has publicly endorsed.
That last point sharpens the picture. Multiple Governing Council members have referenced a neutral rate of approximately 2.50%, the level where policy neither stimulates nor restrains. That reference point sits below even TD Securities’ 2.75% call, and well beneath what the swaps market has built in.
| Scenario | Projected Terminal Rate | Additional Tightening Required | Implied EUR Yield Direction |
|---|---|---|---|
| ECB policymaker neutral rate reference | ~2.50% | 0 bps | Flat to lower |
| TD Securities projection | 2.75% | 25 bps | Mildly higher |
| OIS market pricing | ~3.50% | ~100 bps | Materially higher |
The gap tells you something specific: currency markets are currently priced for a materially more aggressive ECB than most institutional analysts, or the ECB’s own policymakers, appear willing to deliver. That distance is where both the opportunity and the risk in current EUR/USD positioning live.
When big ASX news breaks, our subscribers know first
Why the ECB’s own data argues against the path markets are pricing
If the swaps market is priced for 100 basis points of tightening, the burden falls on the inflation numbers to justify it. They do not, at least not on the ECB’s own projections.
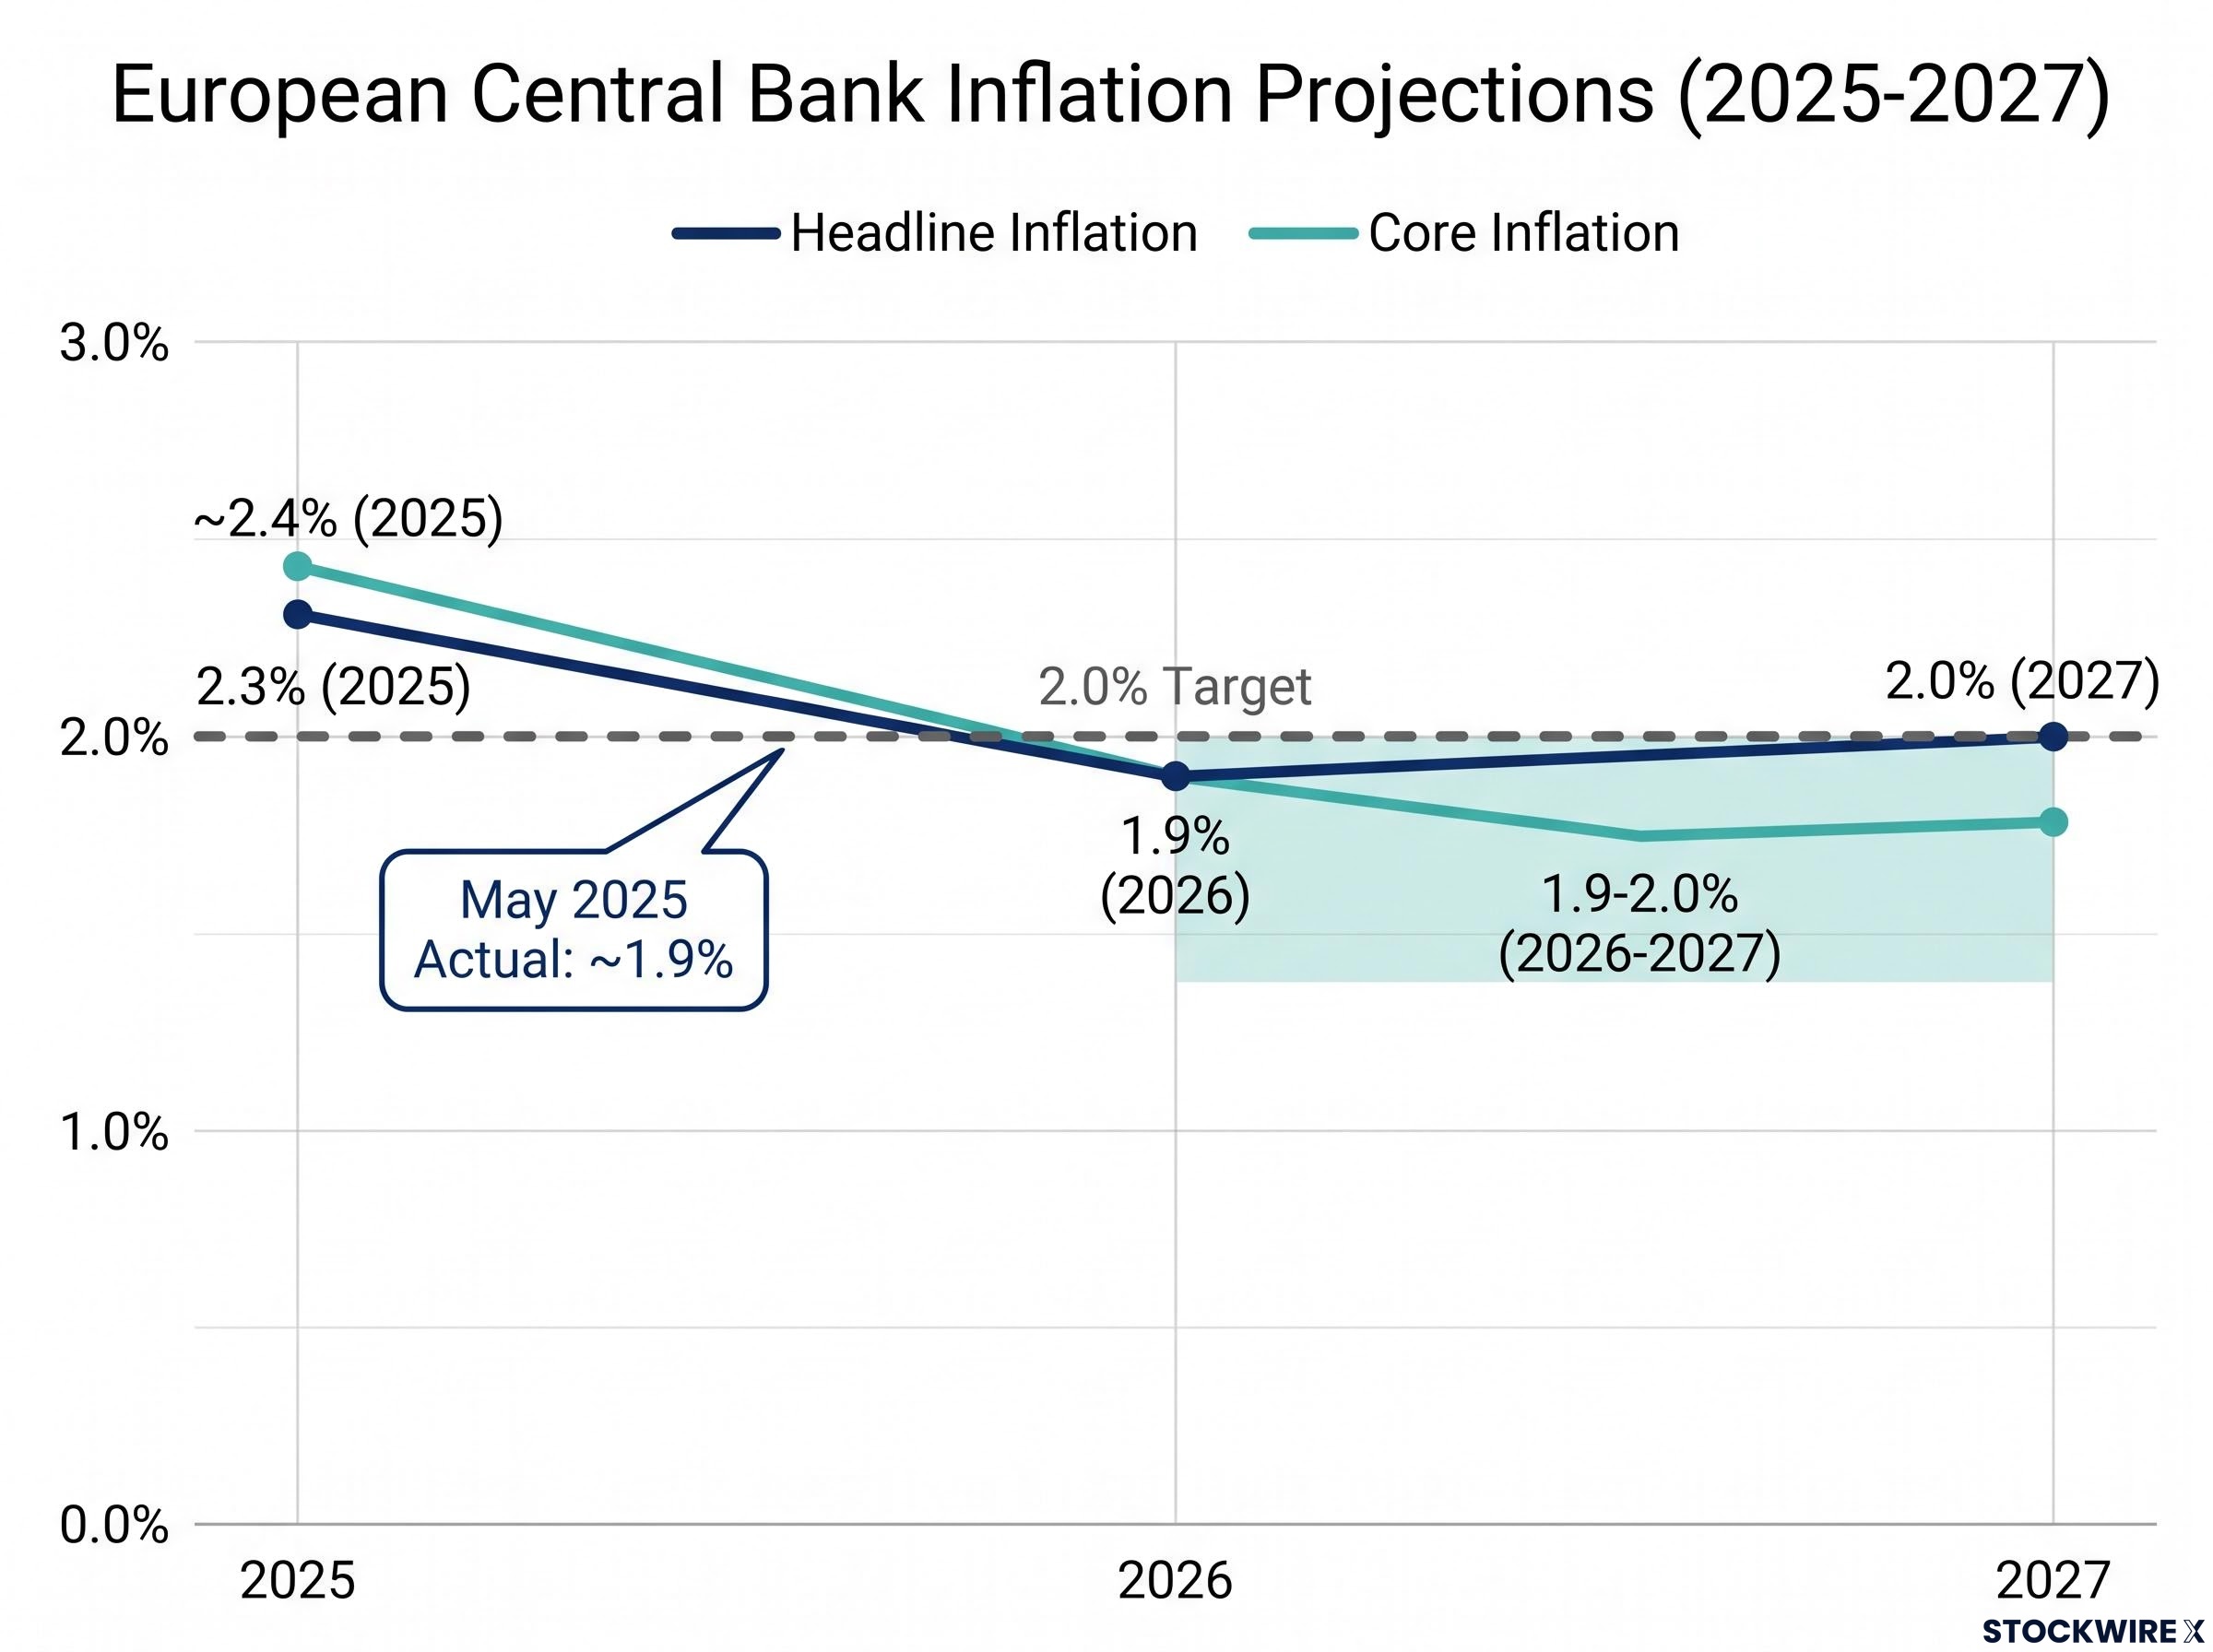
At her 6 March 2025 press conference, President Christine Lagarde presented staff forecasts for headline inflation that trend toward, and then sit at, the 2% target across the projection horizon.
- 2.3% headline inflation projected for 2025
- 1.9% headline inflation projected for 2026
- 2.0% headline inflation projected for 2027
- ~1.9% headline inflation actually recorded in May 2025, per the European Parliament’s “Navigating Neutrality” study
The actual data is already tracking close to the projections. That matters, because it removes the “forecasts are optimistic” objection: reality is landing where staff said it would.
ECB Economic Bulletins reinforce the read. Underlying inflation indicators, the measures that strip out volatile components to show the trend, are described as increasingly consistent with the Governing Council’s 2% medium-term target. When a central bank characterises its own core measures that way, it is signalling that significant further restriction is hard to justify.
The ECB’s September 2026 projections introduced a material complication for the dovish case: headline HICP revised upward to 2.5% in 2027 and 2.1% in 2028, with core inflation remaining above 2% across the full forecast horizon, driven by a Middle East energy shock pushing oil toward US$145 per barrel.
Put plainly, with staff projections placing headline inflation at or below 2% from 2026 onward, and actual readings already close to those figures, the ECB’s published numbers offer limited support for the 100 basis points of extra tightening the OIS curve implies.
What Lagarde’s March 2025 pivot actually signalled
The March 2025 decision did two things at once, and both point in the same direction.
First, the ECB cut all three key rates by 25 basis points, an active reversal of the prior hiking phase rather than a hold. Second, Lagarde tied future moves to incoming data, the language central banks use when they no longer see a pre-set path of increases ahead.
She was careful to note that domestic inflation, linked to services and wages, “remains high.” That caveat keeps the door open to one further move. But the combination of a cut and data-dependent guidance communicates a central bank that believes the hard work of disinflation is largely done, with policy now settling into neutral or mildly restrictive territory. That is the foundation TD Securities builds its 2.75% call on.
The case for more tightening: where the OIS market’s hawkish read finds its ground
The swaps market is not pricing fantasy. Two components of euro-area inflation give the hawkish reading real credibility, and dismissing them would weaken the whole analysis.
The first is services inflation. According to the European Parliament’s “Navigating Neutrality” study, services has been the largest and most persistent driver of headline inflation since early 2024. Services prices adjust more slowly than goods prices, so even as energy and food inflation fade, the services component can keep overall inflation elevated.
The second is wages. The persistent component of wage growth, which strips out one-off bonuses, runs at approximately 3%, above the 2% target. ECB Economic Bulletins project wage growth to stabilise around 2.7-3.0% by end-2026, only a gradual easing.
Then there is core inflation, which measures HICP excluding energy and food. It is projected at approximately 2.4% for 2025, declining only slowly toward 1.9-2.0% across 2026 and 2027, and starting from a level still above target.
The logical structure of the hawkish case follows from these figures. Even with headline inflation near 2%, sticky domestic pressures in services and wages mean the ECB may need to hold a clearly restrictive stance for longer, or tighten further, to durably anchor expectations. The ECB has said as much itself.
ECB Economic Bulletins explicitly condition further disinflation on wage growth easing and services inflation declining. Fail on either front, and restrictive rates stay, or climb.
Competing inflation forecasts sharpen the stakes considerably: Rabobank’s energy-revised models place eurozone headline inflation peaking near 4.4-4.5% in early 2027, roughly double the ECB’s own 2.5% forecast for that year, with the entire divergence driven by differing energy price assumptions rather than broad demand-side overheating.
For anyone tempted to bet on ECB underdelivery, this is the scenario you are betting against. The two variables that will settle the contest are worth tracking directly:
- Services CPI trajectory: whether the most persistent component of headline inflation keeps cooling or stalls above target.
- Wage settlement data: whether the persistent 3% component eases toward the projected 2.7-3.0%, or holds firm and keeps unit labour costs elevated.
A long-EUR position predicated on the ECB stopping at 2.75% is, in effect, a wager that these two data streams cooperate with the dovish forecast. If they do not, the OIS market’s read gains ground.
How mispriced rate expectations resolve, and what it means for EUR/USD
Gaps between what OIS curves imply and what central banks actually deliver do not stay open indefinitely. They close, and historically they close through three channels that tend to operate in combination rather than in isolation.
- Forward guidance pushback. Central bank officials use speeches and statements to signal that market pricing has run too far, nudging the curve back toward their reaction function.
- Data invalidation. Incoming inflation and growth releases undermine the assumptions embedded in the curve, forcing a repricing.
- Risk sentiment shift. Changes in global appetite for risk alter demand for higher-yielding currencies, independent of the rate story itself.
When markets have overpriced future hikes, the resolution typically runs one way: the OIS curve shifts down, domestic yields soften, and the currency underperforms once positioning built on the mispricing unwinds. TD Securities has flagged that ECB or other central bank officials may act to push back against elevated pricing in the near term, precisely the first channel above.
The EUR/USD transmission from ECB underdelivery to spot rate
Here is the causal chain, stated plainly.
EUR/USD reflects the expected interest-rate differential between the euro area and the United States, alongside growth and risk sentiment. When OIS prices a 3.50% terminal ECB rate, the euro is effectively valued as if future euro yields will be that high.
If the ECB instead stops at 2.75%, the euro-area forward curve reprices downward. Expected short- and medium-term yields fall, the EUR-USD rate differential narrows, and the carry advantage, the return an investor earns from holding the higher-yielding currency, shrinks.
Traders who went long EUR expecting the more aggressive path then see their expected return deteriorate. The resulting position unwinding amplifies the downward pressure on EUR/USD, a feedback loop between narrowing yields and reduced positioning.
TD Securities expresses its view through a 3-month EUR/USD risk reversal, an options structure designed to fade broad US dollar strength, held long EUR with a year-end forecast horizon. The choice of an options instrument rather than an outright spot position is deliberate. It reflects a thesis with a known risk scenario, the hawkish case from the previous section, where the 75-basis-point gap (2.75% versus 3.50%) is what is being faded.
For you as an investor, that framing matters. The trade is not a directional macro bet on euro strength in isolation. It is a bet that the gap between current market pricing and likely central bank delivery closes, with the options vehicle acknowledging the genuine uncertainty over whether wage and services dynamics force the ECB’s hand.
What the data will tell you before the market admits it is wrong
The resolution of this gap is not an event. It is a process that plays out across weeks and months as guidance, data, and positioning interact, and the EUR/USD move associated with ECB underdelivery accrues over that period rather than in a single session.
That makes this less a static trade to copy and more an ongoing monitoring exercise. The analytical value is in knowing which data points settle the contest between the dovish and hawkish camps.
The near-term decision point is the December meeting, where TD Securities expects the one further 25 basis point hike that closes the cycle at 2.75%. Language signalling comfort at that level would confirm the cycle-end scenario; any appetite for more, or a refusal to rule it out, extends the uncertainty and hands the OIS market a point.
Here is the watchlist to run alongside it:
- Services HICP prints: a continued cooling supports the dovish call; a stall above target keeps the hawkish scenario alive.
- Wage settlement data: easing from the current ~3% persistent component confirms disinflation is on track; a firm reading argues for rates staying higher.
- Governing Council speech language: explicit pushback against elevated OIS pricing signals the gap closing in TD Securities’ favour; hints at further action signal the opposite.
- The December outcome itself: a hike-and-hold framing confirms 2.75%; an open-ended stance defers the question.
Currency dislocations driven by central bank mispricing are not rare, but catching them requires knowing what to look for. The ECB has told you its own condition for further disinflation, that wage growth eases and services inflation declines. Watch those two variables, and you will read the resolution of this thesis before consensus does.
For investors who want to track the services HICP and wage variables without mistaking component-level noise for a structural shift, our dedicated guide to reading eurozone inflation data walks through the analytical framework for distinguishing energy-driven headline moves from the core and services trends that actually drive ECB decisions.
This article is for informational purposes only and should not be considered financial advice. Investors should conduct their own research and consult with financial professionals before making investment decisions. Past performance does not guarantee future results. Financial projections are subject to market conditions and various risk factors, and forward-looking statements are speculative and subject to change based on market developments.