
Core PCE just printed at 3.0% year-over-year, its softest reading in months, and equity futures immediately rallied 0.4%. That looks like a signal the Fed’s fight is nearly won.
The Treasury market disagrees. The 10-year yield is sitting at 5.23% and the 30-year is near 5.59%, levels that reflect a bond market pricing in an extended stretch of restrictive policy, not a soft-landing celebration.
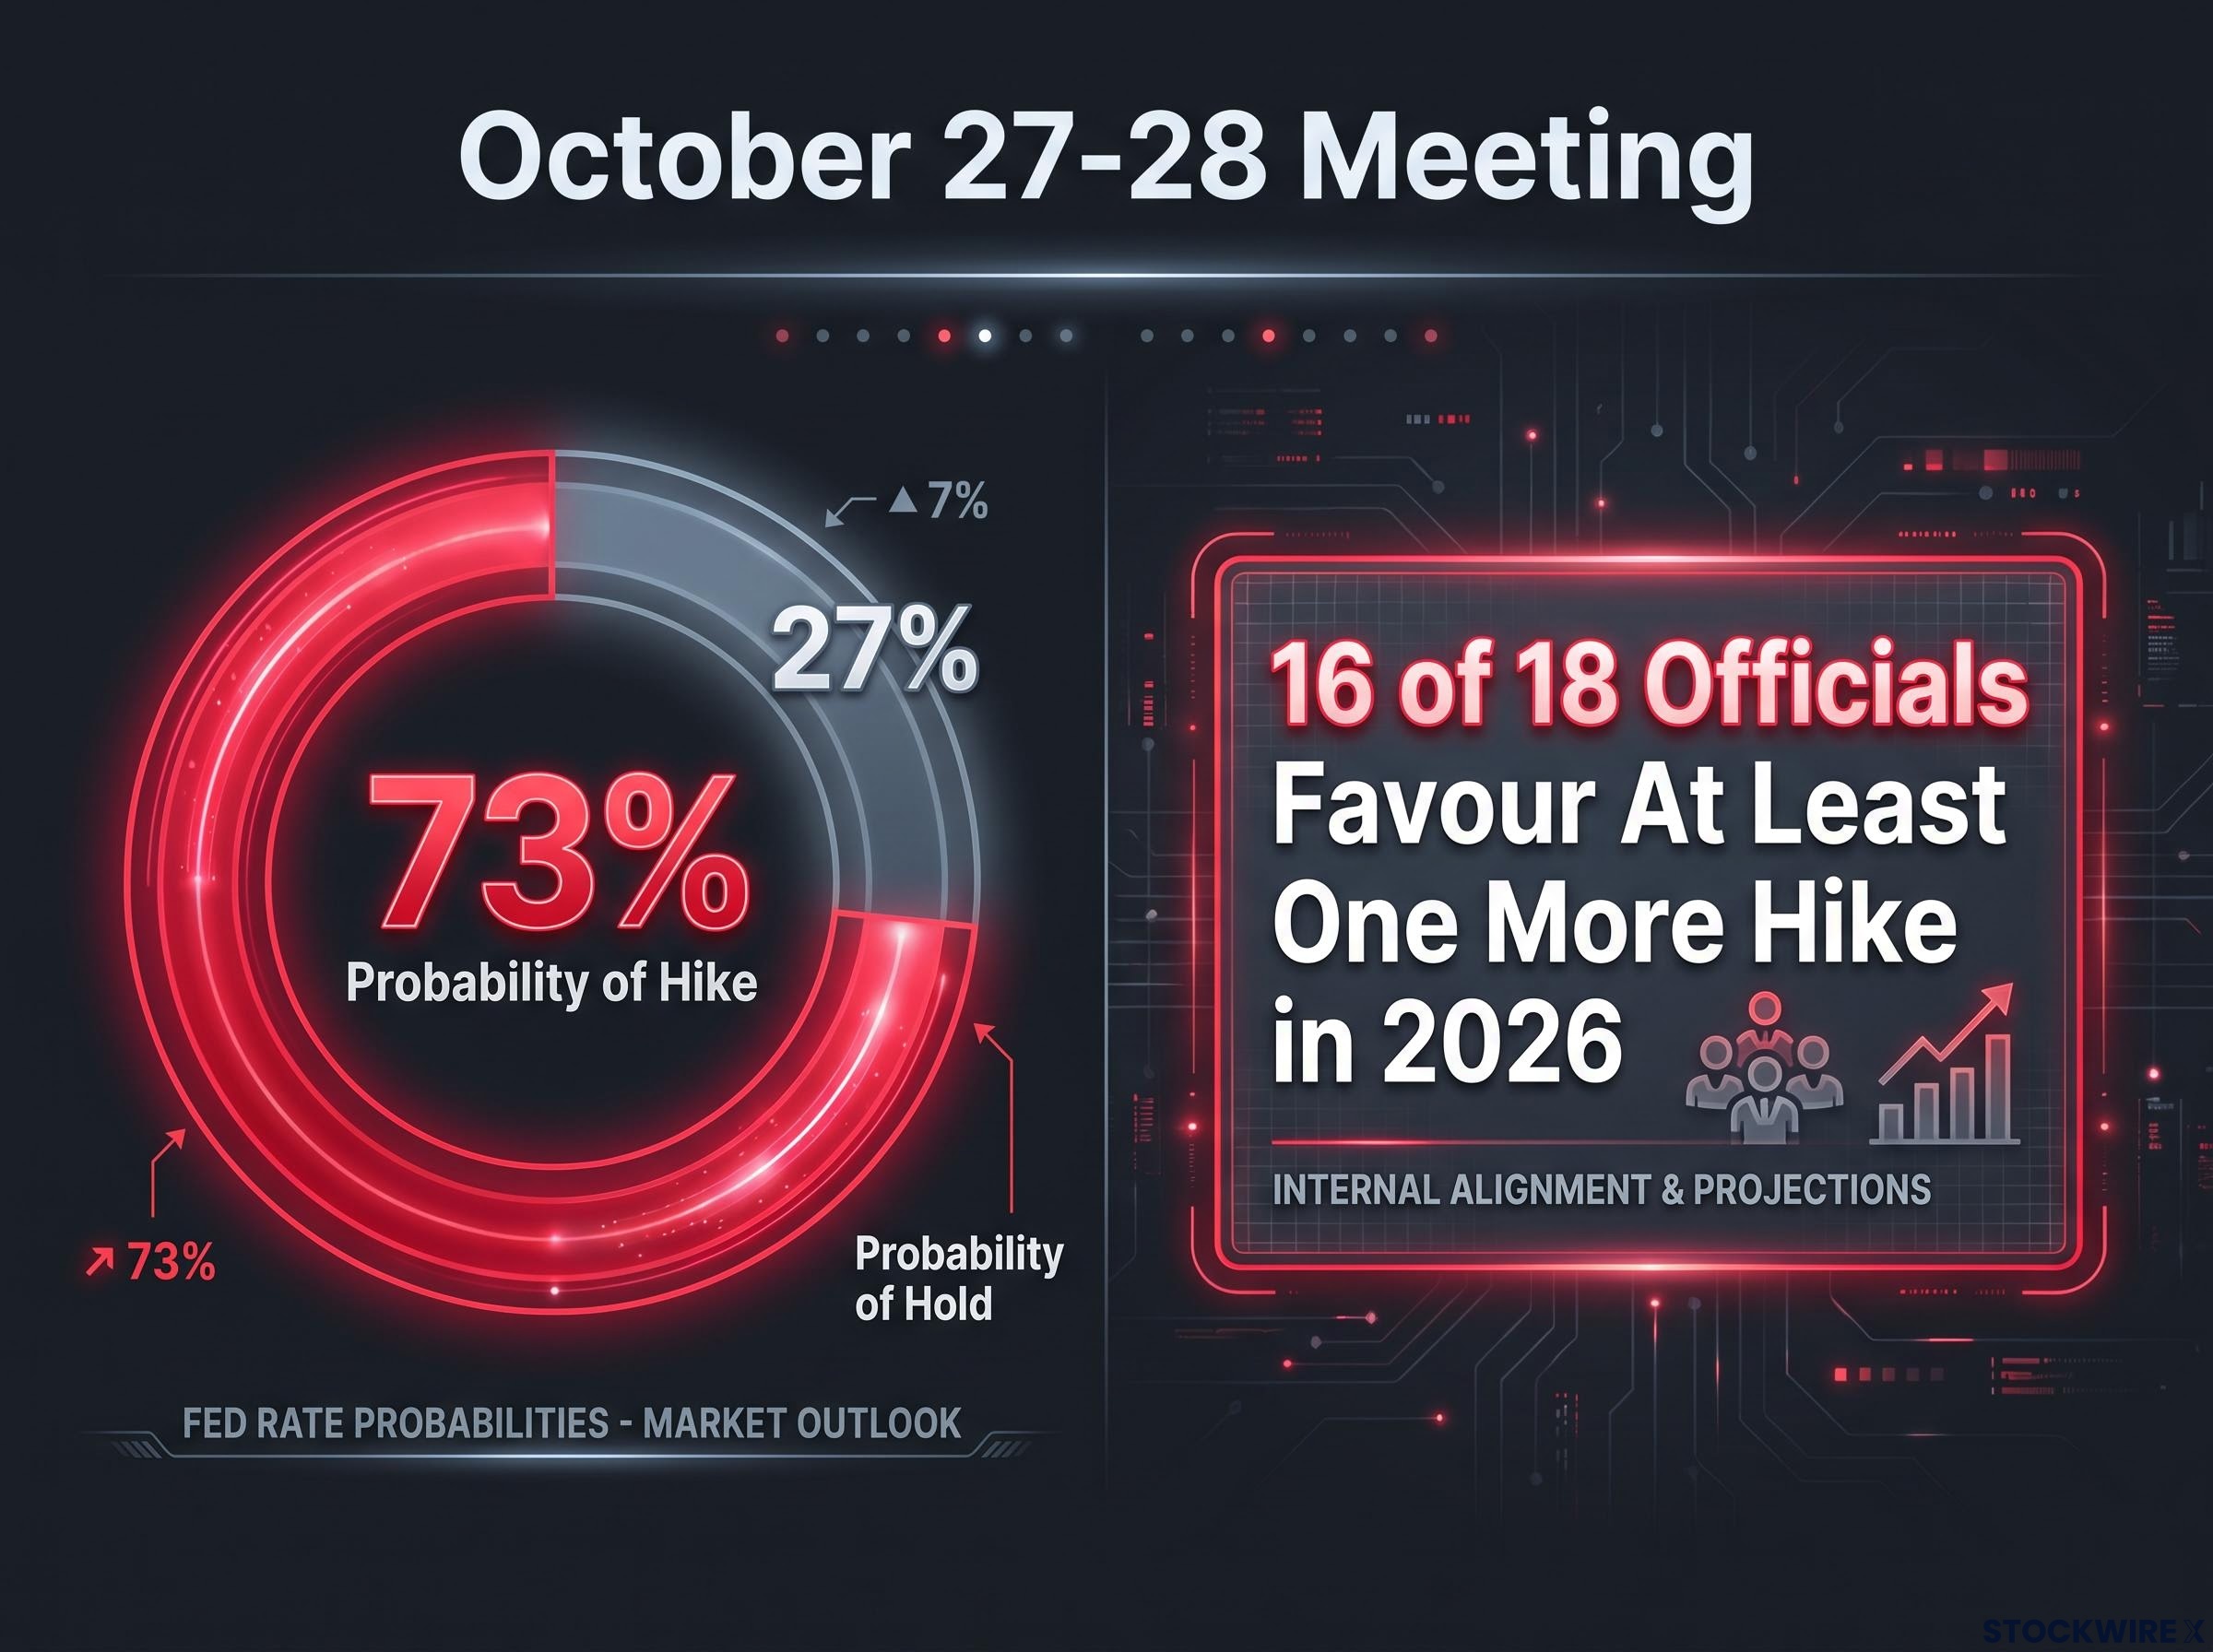
The August data, released 30 September 2026, dropped into an already charged environment. The Fed hiked 25 basis points in September, the Federal Open Market Committee (FOMC) meets again on 27-28 October, and futures markets currently put the odds of another hike at roughly 73%. The cooler print complicates a picture that was already contested inside the Fed, where 16 of 18 officials still favour at least one more hike this year, even as New York Fed President John Williams has signalled no immediate urgency to move.
This piece gives you a framework for reading the PCE print alongside the Treasury yield curve, the internal FOMC debate, and the 3 October payrolls release, so you can form a grounded view on where the Fed rate path goes from here rather than reacting to each data point in isolation.
A softer print, but not a green light
The August numbers undershot economist forecasts on every measure that matters. Core PCE, which strips out volatile food and energy prices, rose just 0.2% month-over-month against a consensus of 0.3%, according to LSEG-compiled estimates. On an annual basis it landed at 3.0% versus the 3.3% economists had penned in.
Headline PCE told the same story, coming in at 0.3% month-over-month and 3.4% year-over-year, both below the 0.4% and 3.7% the market expected.
The BEA Personal Income and Outlays release for August 2026 confirmed core PCE at 0.2% month-over-month and 3.0% year-over-year, both below consensus, establishing the primary data foundation from which futures repricing and FOMC deliberations now proceed.
The direction is genuinely encouraging. Core PCE has cooled from 3.3% in July to 3.0% in August, and headline has eased from 3.7% to 3.4% over the same span. That is the disinflation the September hike was designed to produce.
The July PCE trajectory established the baseline that makes August’s softness legible: core held at 3.3% for a second consecutive month, real personal spending flatlined at 0.0%, and the Fed’s five-point convergence test for easing remained unmet on every gauge, which is precisely why a single below-forecast month does not shift the Committee’s posture.
Here is where the optimism runs into arithmetic.
| Measure | Consensus | Actual | Prior (July y/y) |
|---|---|---|---|
| Core PCE m/m | 0.3% | 0.2% | – |
| Core PCE y/y | 3.3% | 3.0% | 3.3% |
| Headline PCE m/m | 0.4% | 0.3% | – |
| Headline PCE y/y | 3.7% | 3.4% | 3.7% |
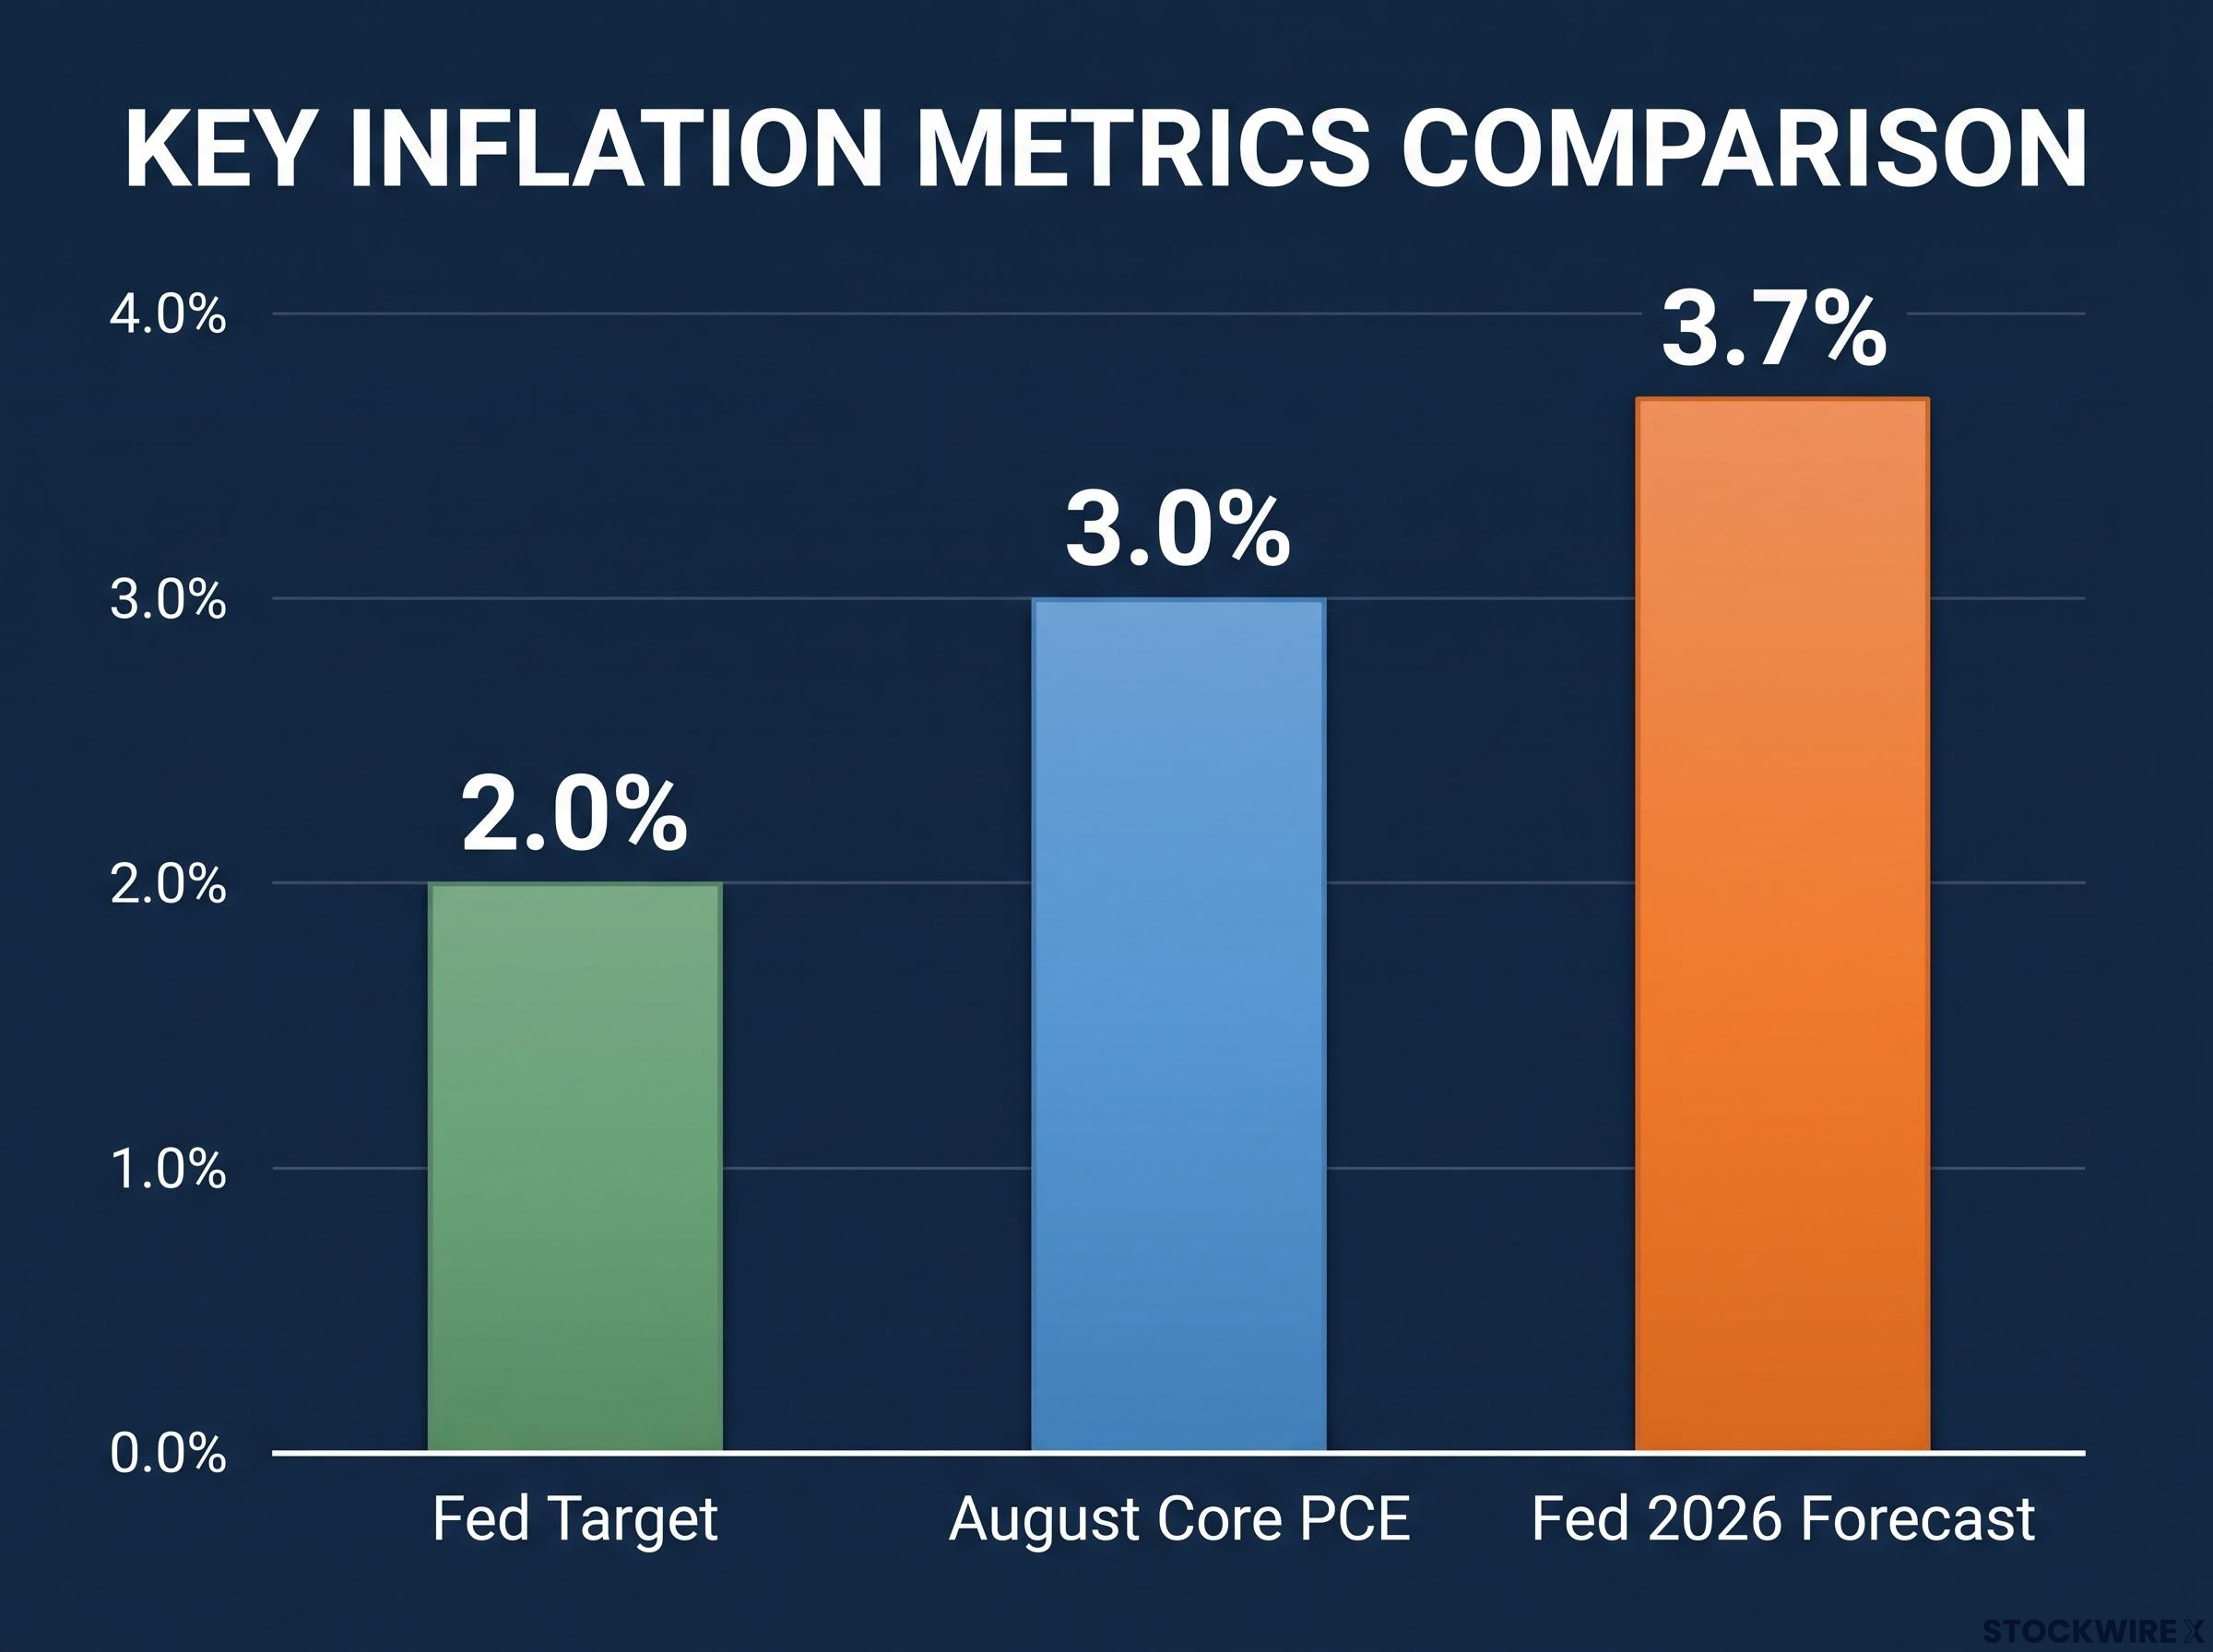
A core reading of 3.0% is still 50% above the Fed’s 2% target. And the Committee’s own projections do not see inflation back at target until 2029, with its 2026 PCE forecast now sitting at 3.7%, revised sharply up from the 2.7% it published in March.
Fed’s own read on the data Fox Business characterised the release as inflation that “cooled in August but remained elevated.”
That framing captures the tension precisely. The distance between where core PCE is now and where the Fed needs it to be is not a rounding error, and a single soft month does not dissolve the structural problem the Committee is managing. Knowing the difference between a directionally positive data point and a policy-decisive one is what protects you from the kind of premature optimism that gets repriced hard when the next FOMC statement arrives with no pivot language in it.
When big ASX news breaks, our subscribers know first
What the Treasury curve is telling you that futures markets are not
The dominant market narrative after the print was the futures probability. CME FedWatch-derived odds put the chance of an October hike at 72.5% as of 29 September, per Admiral Markets, broadly in line with the 73% CNBC reported on 23 September following comments from Fed Vice Chair for Supervision Michael Barr that markets read as opening the door to more tightening.
The central consensus number Markets are pricing roughly a 73% probability of a 25bp hike at the 27-28 October meeting, implying only around a 27% chance of a hold.
That number tells you what the market expects at the next meeting. The yield curve tells you something more structural.
The signal in the long end
The 10-year Treasury yield eased to 5.23% on 30 September, down 0.026 points on the session, while the 30-year sat near 5.59% at the prior close, according to Treasury Department and Yahoo Finance data. The 5-year is where sourcing gets messy: Treasury Department yield curve data shows 4.89% for 29 September, while an alternative source puts it at 5.014% for the same window, a discrepancy likely down to intraday timing.
| Maturity | Yield | Date | Change on session |
|---|---|---|---|
| 5-year | 4.89% (Treasury) / 5.014% (alt) | 29 Sep 2026 | -0.049 (alt source) |
| 10-year | 5.23% | 30 Sep 2026 | -0.026 |
| 30-year | 5.59% | 29 Sep 2026 | -0.013 |
A 10-year above 5% is not just a bet on one more rate move. It reflects a term premium, the extra yield investors demand to hold longer-dated debt through years of inflation uncertainty. When the market is willing to lock in 5.23% for a decade, it is telling you it expects rates to stay high enough, for long enough, that doing so looks rational.
That should recalibrate how you think about duration risk in your own portfolio. The futures market gives you the next meeting; the curve gives you the next several years. Read together, they paint a materially more complete picture of the policy environment than either signal alone.
Reading the three bond market signals simultaneously, the 2s10s compression, rate futures probability, and TIPS breakeven rates, produces a more complete picture of the policy environment than any single indicator, particularly because CME Group analysis of prior easing cycles found futures curves routinely underestimate eventual cut depth by 400-625 basis points.
When the equity rally and the bond market tell different stories
The apparent contradiction is worth naming: equity futures climbed 0.4% on the softer print while the curve signalled no near-term easing. The S&P 500 had closed at 7,670.84 on 29 September, down 0.17% on the day, before the pre-market gain. That move reads as a relief trade on a single cooler data point, not a wholesale repricing of the rate path.
The Fed’s internal fault lines and the dual mandate arithmetic
The debate inside the Fed is not a simple hawks-versus-doves standoff. It is two internally coherent readings of the same data set, which is exactly why it remains unresolved.
The hawkish case is anchored in the dot plot, the chart where each official marks their rate expectation. 16 of the 18 officials favour at least one more hike in 2026, and the Committee’s decision to revise its 2026 PCE forecast up to 3.7% from 2.7% signals it does not believe current policy has done enough. Barr’s 23 September comments were the catalyst that pushed October hike odds toward 73%.
The cautious case runs through Williams. His argument is that after September’s 25bp move, policy is already firmly restrictive, and the lagged effects of cumulative tightening have not yet fully surfaced in the data. On that logic, the smart move is to wait rather than presume another hike is needed.
The dual mandate in practice: why the jobs number on 3 October matters as much as the PCE
The Fed operates under a dual mandate: it is legally tasked with pursuing both price stability and maximum employment. PCE speaks to the first half; nonfarm payrolls speak to the second.
The Federal Reserve dual mandate creates asymmetric policy pressure when both goals are simultaneously out of range: with inflation sitting 100 basis points above the 2% target and unemployment holding at 4.1%, the Bostic principle holds that the Fed leans hardest on whichever mandate gap is largest, making price stability the dominant objective regardless of what the payrolls report delivers.
That is why an inflation beat does not settle the argument. TradingEconomics noted that strong payrolls data “could reinforce expectations for further policy tightening” even if inflation keeps cooling, because a tight labour market sustains the wage pressure that feeds back into prices.
The next payrolls report lands on 3 October, and it is where the two sides of the mandate will either converge or diverge.
Three developments would tip the balance toward a hold at the October meeting:
- Nonfarm payrolls coming in materially weaker than expected on 3 October.
- The next inflation reading confirming August’s softness as a genuine trend rather than a one-month blip.
- Financial conditions tightening on their own through the yield curve, doing some of the Fed’s work for it.
The 16-of-18 alignment tells you something important. Even if October is held, the working presumption inside the Fed is that more tightening remains on the table. That distinction matters for how you weigh the duration of the restrictive period, not just the outcome of a single meeting, and it carries real implications for both fixed income positioning and equity valuations.
The component gap: what the PCE data does not yet tell you
Here is what the available reporting on the August release does not yet reveal: which components drove the softness. Whether the 0.2% core print came from goods disinflation, services moderation, or housing costs is not specified in public sourcing at the time of writing.
A live uncertainty, not a settled question The “why” behind the softer core print remains underspecified in current reporting. That gap is where the next market-moving interpretation is likely to emerge.
The distinction matters for durability. Goods disinflation can reverse fast if supply chains tighten again. Services inflation is stickier, driven by wage dynamics that move slowly in both directions. Housing costs are a known lagging indicator, meaning they show up in the data long after the underlying shift has occurred.
Without that breakdown, calling August a durable turn rather than a favourable month is guesswork. What you can do is know exactly what to watch next:
- The 3 October payrolls report and average hourly earnings, for the labour-market read.
- The next Consumer Price Index (CPI) release before 27-28 October, to test whether August’s softness holds.
- Any shift in FOMC members’ public communication in the weeks between now and the meeting.
Readers who know what to track as the data arrives are far better positioned to revise their view than those who locked in a conclusion on the August headline alone. That is where analytical edge lives: in getting ahead of the interpretive moment rather than reacting to it after markets have already moved.
What the August PCE print actually changes, and what it does not
The softer print is real, directionally important, and consistent with the disinflation the Fed’s September hike was built to produce. What it does not do is move the Committee’s 2029 return-to-target timeline or dislodge the 16-of-18 dot plot alignment.
So what has actually changed? The data hands the Williams camp more rhetorical ammunition and trims, without eliminating, the probability of an October hike from its 72.5-73% baseline. It strengthens the case for a hold; it does not win the argument.
The decision framework from here is sequential. Watch the 3 October payrolls first, then the next CPI reading, then listen for any shift in FOMC rhetoric before 27-28 October.
- The hold case strengthens if: payrolls disappoint, CPI confirms cooling, and Williams-style caution dominates the commentary.
- The hike case hardens if: payrolls come in strong, CPI proves sticky, and Barr-camp hawkishness escalates.
Hold your interpretation loosely until those numbers land. Investors who understand what would need to be true for the Fed to hold versus hike can position ahead of each release with a logic model rather than chasing market moves driven by the same information after the fact. The restrictive period, on the Fed’s own projections, is measured in years, not months.
For investors wanting to track how internal Fed divisions evolve between now and the October decision, our full explainer on reading FOMC vote splits covers the specific market transmission mechanisms, Treasury yield responses, and historical precedents for how dissent clusters have signalled cyclical turning points in the rate cycle.
This article is for informational purposes only and should not be considered financial advice. Investors should conduct their own research and consult with financial professionals before making investment decisions.
Past performance does not guarantee future results. Financial projections are subject to market conditions and various risk factors. These statements are speculative and subject to change based on market developments and economic data.