USD/CAD is trading at 1.4190, its 14-period Relative Strength Index (RSI) is reading 75.45, and price is pressing directly into Bollinger Band resistance near 1.4260. Every trader watching this pair is asking the same question right now: does the rally still have room, or has it already run too far?
That is the live problem this analysis sets out to answer. The pair has climbed from a corrective phase near 1.3780 in early September 2026 to its current level above 1.41, recovering back through key moving averages in a pattern that has repeatedly caught out traders who called the top too early.
RSI, Bollinger Bands, and moving average structure are the three tools that can give that pattern a disciplined reading rather than a guess.
What follows gives you a clear framework for reading this specific chart setup, understanding what the indicators are actually saying, and knowing which price levels will decide the next meaningful move. You should leave with a map of the trade, not a prediction of it.
What the current chart structure is telling you
To understand where USD/CAD sits now, it helps to trace how it got here across 2026. Earlier in the year, the pair drifted inside a tight consolidation range between 1.3650 and 1.3710, defined by its 20- and 50-day simple moving averages.
Then came the September wobble. On 9 September 2026, price sat around 1.3780, below both its 9-day and 50-day exponential moving averages (EMAs), trading inside a descending channel that pointed lower. At that moment, the structure looked broken.
It did not stay broken for long. Buyers pushed price back up through those dynamic supports and drove it to 1.4190 by late September, with the 25 September low holding at 1.4133. That is a recovery of more than 400 pips in under three weeks.
The speed of that move cuts two ways. It tells you buyers re-established control decisively, but a recovery that fast is also a reason to treat the current level with caution rather than confidence.
The structural evidence is now stacked on the bullish side. Price trades above the 20-period EMA at roughly 1.4016-1.4020 and above the 100-day SMA at approximately 1.3980, clearing two independent moving average tests.
Here are the levels that define the current structure:
- Spot price: 1.4190 (late September 2026)
- 20-period EMA (immediate support): approximately 1.4016-1.4020
- 100-day SMA (secondary support): approximately 1.3980
- 25 September low (first downside marker): 1.4133
- Earlier 2026 consolidation range: 1.3650-1.3710
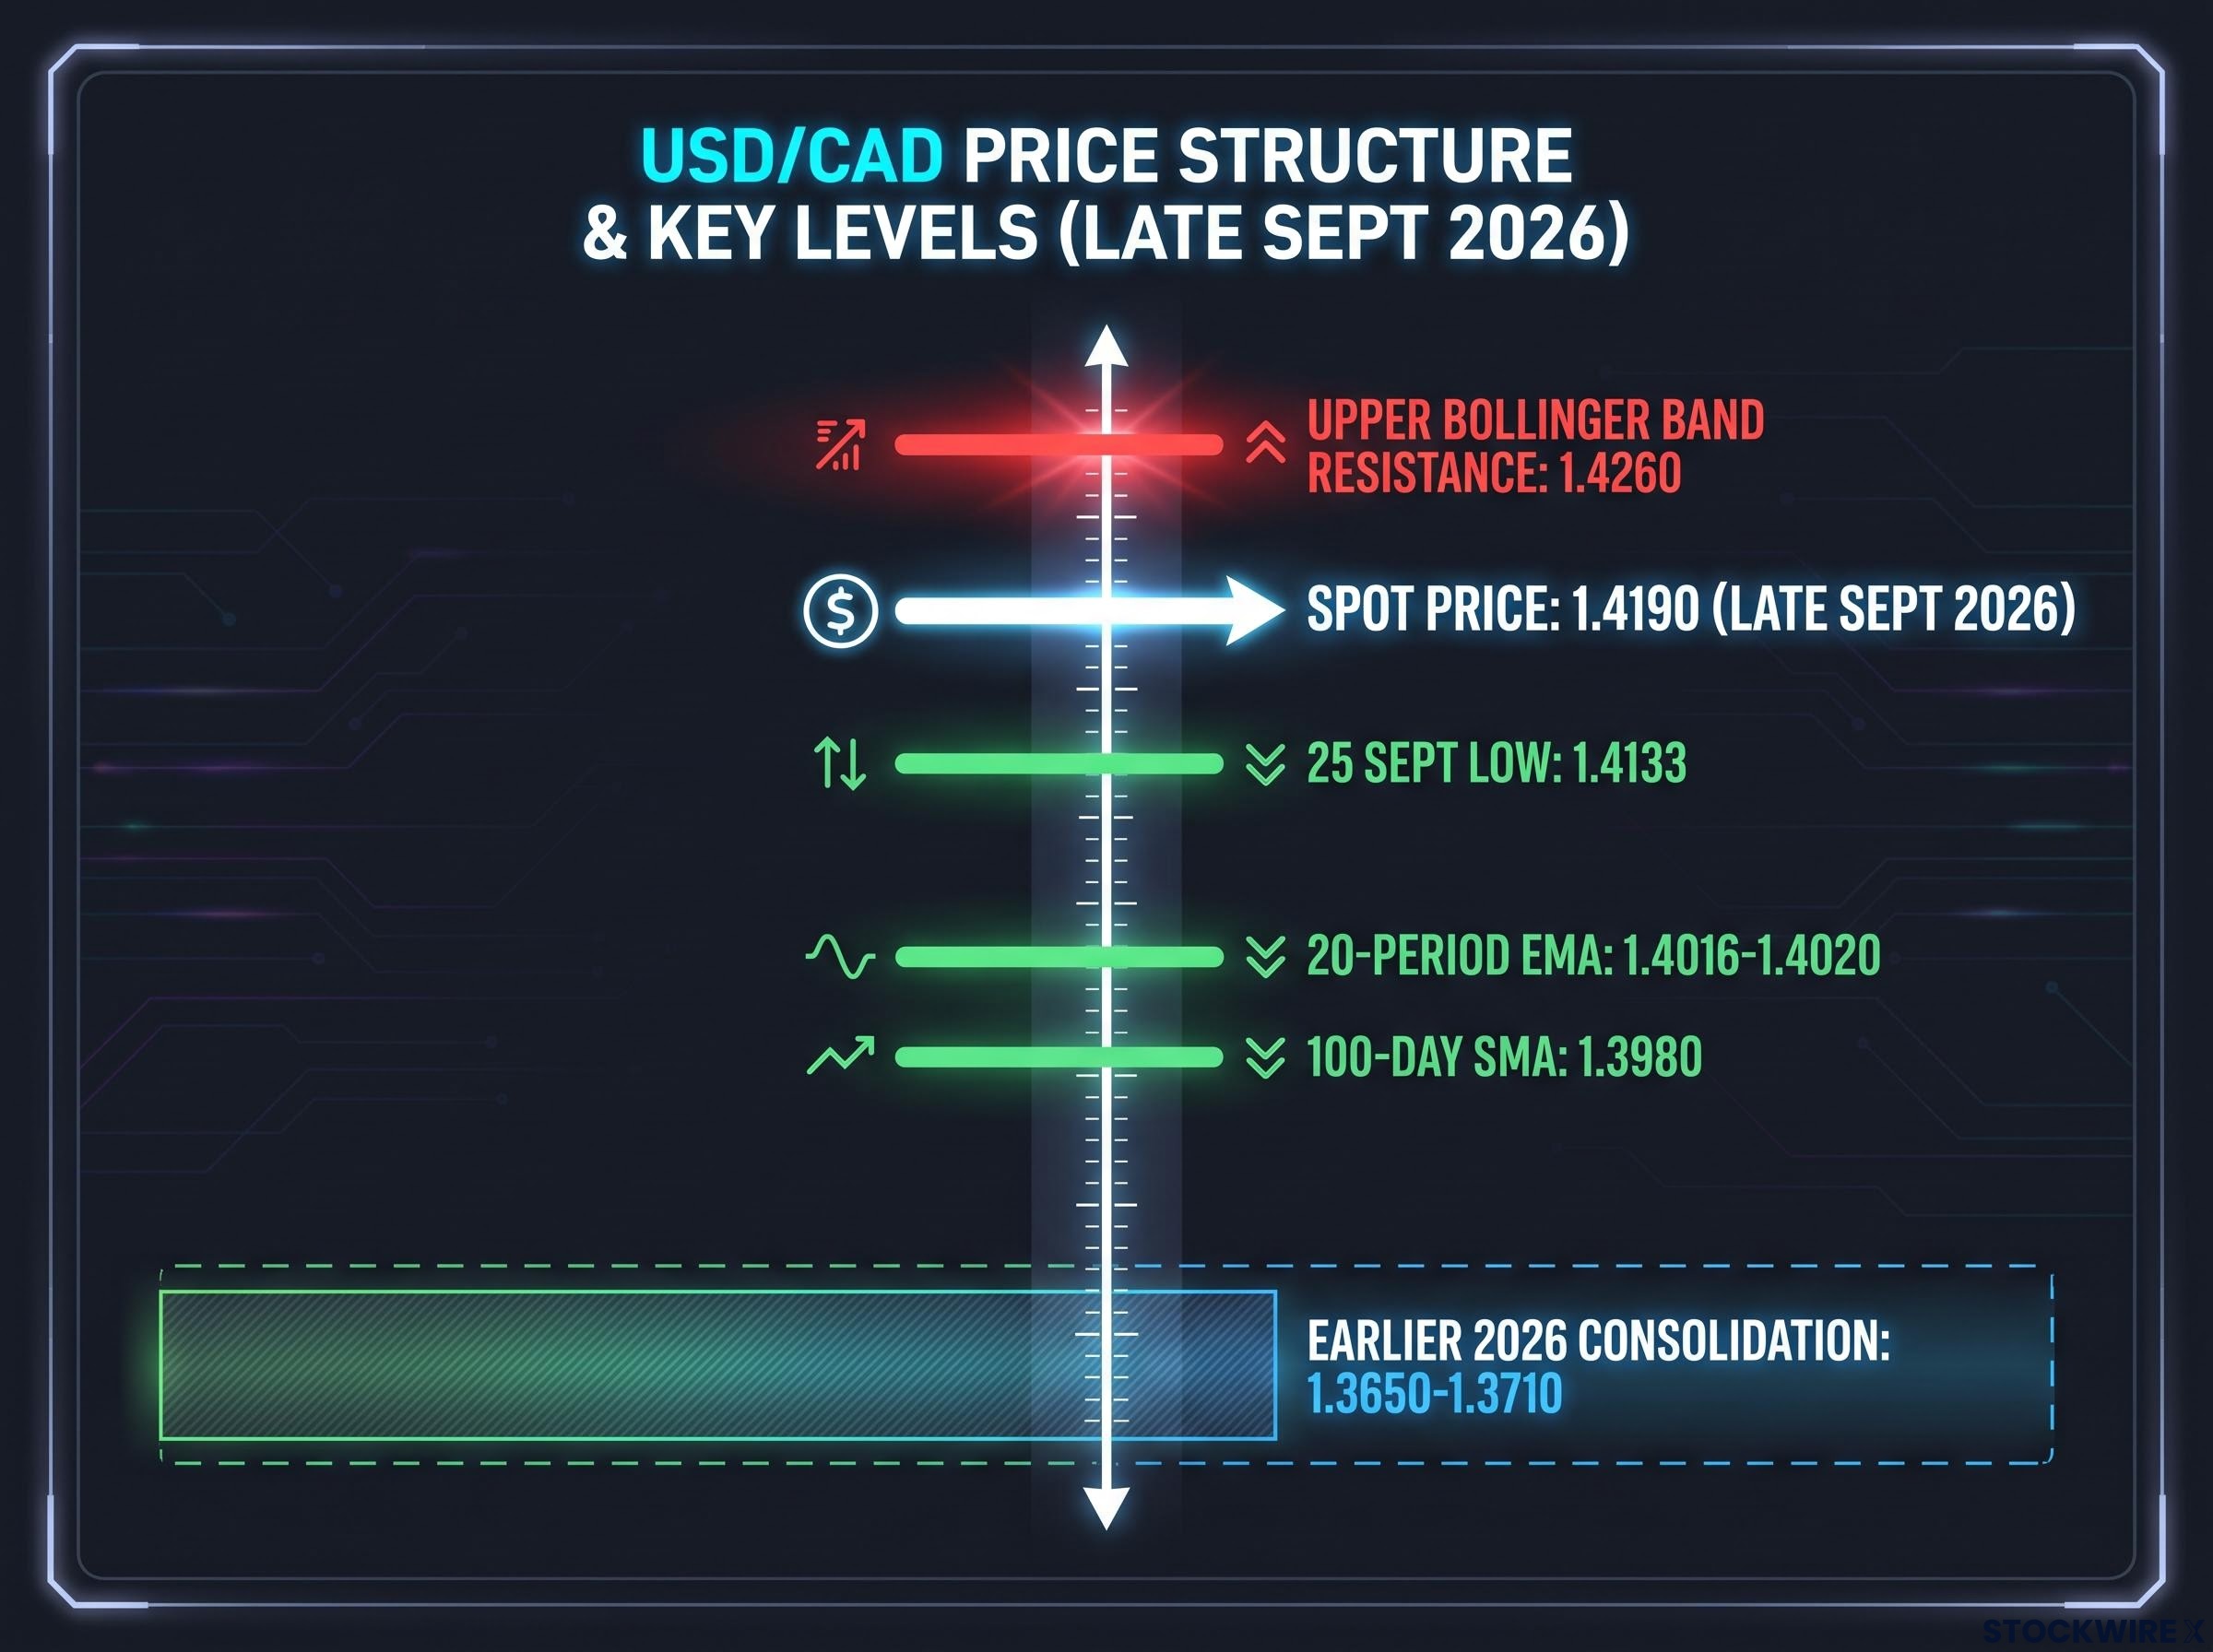
Structural read: Price trading above both the 100-day SMA and the 20-period EMA confirms a bullish structural bias. As long as those two levels hold, pullbacks are corrections, not reversals.
That layered moving average structure is what tells you the difference between a routine pullback and a genuine breakdown. A dip that holds above the 20-period EMA is noise; a close below the 100-day SMA is a different conversation entirely. Knowing which is which is what separates a managed stop from a blown position.
The same logic applies across major currency pairs: in the GBP/USD case study from September 2026, moving average configuration confirmed a bearish structural bias even when RSI sat near oversold territory, demonstrating that the structural read always overrides the oscillator signal.
When big ASX news breaks, our subscribers know first
RSI at 75 and Bollinger Band resistance: what overbought actually means here
Pull up the chart and two warnings jump out immediately. RSI is reading 75.45, well inside overbought territory, and price is pushing straight into the upper Bollinger Band near 1.4260. Neither reading alone would be decisive. Their coincidence is what makes this setup worth pausing on.
What the RSI reading actually signals
RSI measures the speed and size of recent price moves on a scale of 0 to 100, and readings above 70 are traditionally labelled overbought. The instinct many traders feel is to sell the moment RSI crosses 70.
In a trending pair, that instinct loses money. RSI above 70 signals stretched momentum and rising pullback risk, but it is not a reversal signal. Price can stay overbought for weeks while a strong trend runs.
RSI divergence at structural confluence levels has achieved an 87.61% success rate in academic testing of equity markets, a finding that underscores why the current 75.45 reading carries weight only when read alongside the price structure at 1.4260, not in isolation.
The September comparison makes the point. On 9 September, RSI sat near 38, nowhere near oversold territory of 30, yet the pair was still falling inside a downtrend. Overbought and oversold labels only mean something when read alongside price structure.
| Date (2026) | Spot | RSI | What followed |
|---|---|---|---|
| 9 September | ~1.3780 | ~38 | Still falling despite non-oversold RSI; buyers later reclaimed control |
| 9 July | ~1.4153 | Retreating from overbought | Momentum faded, pair pulled back from highs |
| 29 September | 1.4190 | 75.45 | Overbought, pressing into Bollinger resistance |
Why the upper Bollinger Band acts as resistance
Bollinger Bands are a volatility envelope drawn around a moving average, with the upper band set at the average plus a multiple of standard deviation. When price pushes into or past that upper band, it is statistically stretched.
That stretch triggers behaviour. Longs take profit, counter-trend sellers step in, and few new buyers are willing to chase price at elevated levels. Those clustered sell orders are exactly why the upper band tends to behave like resistance.
USD/CAD has already shown this in 2026. On 13 July, a two-month rally stalled near a 14-month high around 1.4246 after a triple rejection over several weeks, then dropped below the 20-day SMA.
The market has memory here. The July triple rejection at 1.4246 sits almost exactly where RSI is now overbought at 1.4260. That memory is worth respecting before adding exposure into this zone.
Why the same resistance zone keeps forming near 1.4246-1.4260
Once a level produces multiple rejections, it becomes embedded in both trader psychology and the reference ranges that algorithms track. Each future test of that level draws in the same profit-takers and counter-trend sellers, making the resistance self-reinforcing.
The current upper Bollinger Band and the prior triple rejection high converge inside the same 14-15 pip band. That overlap concentrates the significance: this is not two separate resistance points but one dense supply zone that price will need to clear convincingly.
The macro layer: what fundamentals are doing to the technical picture
The technical levels do not exist in isolation. They are where underlying fundamentals become visible on the chart, and three macro forces are running beneath USD/CAD in the late September 2026 session.
Here they are, ranked by near-term immediacy:
- Crude oil’s partial recovery. Rising petroleum prices are offering support to the commodity-sensitive Canadian Dollar, contributing to the modest decline in USD/CAD toward 1.4190.
- Pending US data. Investors are awaiting the ADP employment figures and the PCE Price Index (the Fed’s preferred inflation gauge) for fresh reads on the interest rate path.
- Medium-term rate expectations. Anticipated Federal Reserve easing sits in the background as a structural headwind to further USD strength.
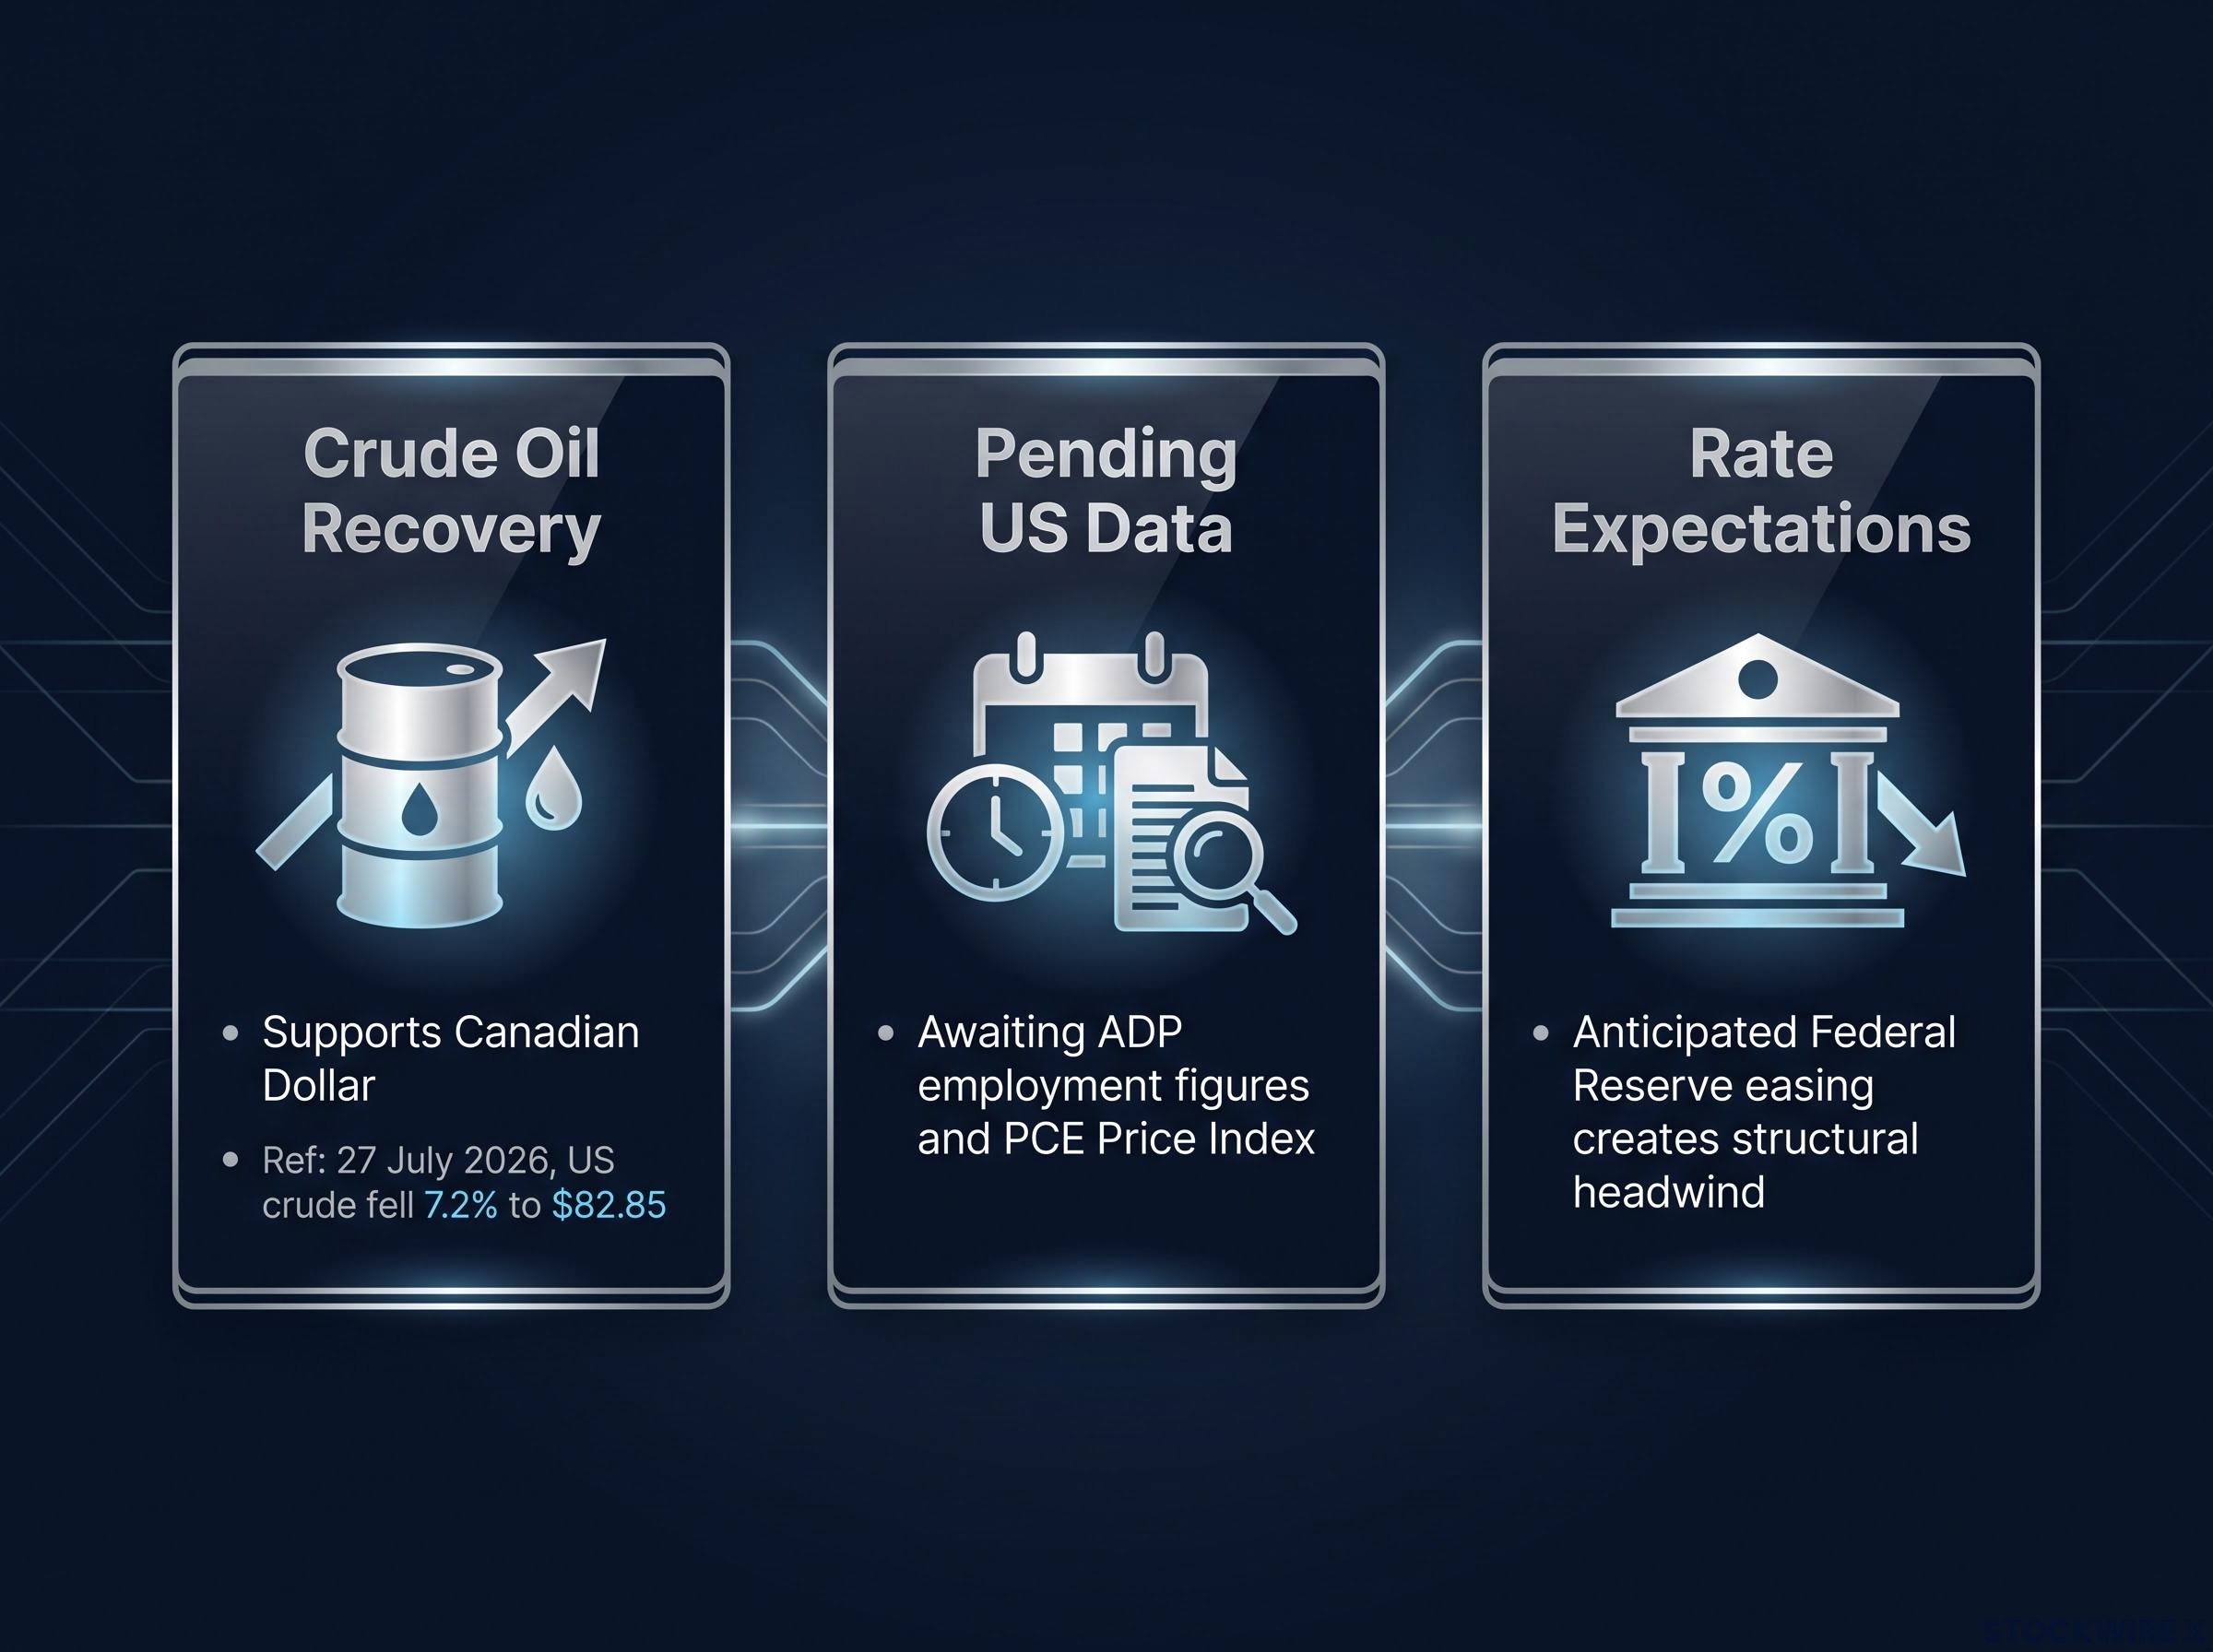
The oil relationship is worth pinning down because it is quantified in the 2026 record. On 27 July 2026, the US crude benchmark fell 7.2% to around $82.85 per barrel, and the Canadian Dollar hit a near two-week low. George Davis, chief technical strategist at RBC Capital Markets, attributed that CAD weakness to the oil drop.
The CAD-WTI oil correlation has collapsed from 0.88 before 2018 to near zero by 2025-2026, which means the crude oil recovery offering support to the Loonie in late September carries far less mechanical weight than the terms-of-trade framing suggests.
The reverse held too. On 20 August 2026, the loonie reached a near three-month high as oil climbed and the US dollar softened, with Darren Richardson of Vantry Capital citing higher crude and broad USD weakness tied to US debt concerns.
That relationship is the terms-of-trade channel at work: stronger energy prices lift Canada’s export revenues and support its currency directly.
Where the fundamental picture gets interesting is the medium-term countercase. Two named strategists are calling for USD/CAD downside on fundamental grounds.
Jayati Bharadwaj of TD Securities has argued that USD/CAD is likely to weaken as the Federal Reserve eases interest rates, risk-on sentiment strengthens, and USMCA trade uncertainty resolves. Nick Rees of Monex Europe points to improving risk conditions, eroding US dollar haven demand, and higher oil prices as factors favouring downside.
Here is what that alignment tells you. When credible strategists are calling for downside on fundamentals while the chart shows overbought technicals pressing into major resistance, the technical and fundamental pictures are pointing the same way against further upside. That raises the stakes of any breakout attempt considerably.
Trading RSI signals in isolation while ignoring this macro context means flying blind on the forces most likely to move the pair beyond the next few sessions. The skill is holding both pictures at once.
Where traders draw the line: upside targets and downside scenarios
This is where the analysis becomes actionable. Two clean scenarios define the next meaningful move, each with a specific trigger.
| Scenario | Trigger level | Next target | Implication |
|---|---|---|---|
| Bullish | Decisive break above 1.4260 | 1.4415, then 1.4541 | Momentum-driven; no clear resistance above, so vulnerable to sharp reversal |
| Bearish | Close below 1.4016-1.4020 | 1.3980, then 1.3695 | Structure shifts from bullish to neutral, then toward reversal |
The upside scenario
A decisive break above 1.4260, the Bollinger upper band, opens the path toward the 1 April 2025 high at 1.4415, and beyond that the 3 March 2025 high at 1.4541.
There is a catch. Above 1.4260, the current dataset shows no clearly defined resistance. That means any extension would be driven purely by momentum, with no structural ceiling to slow it.
That absence cuts both ways. A breakout could run fast, but the only governor on the move is momentum itself, which makes position sizing and stop placement more important than the entry level.
The downside scenario
On the way down, the levels stack in order. A pullback that holds above the 20-period EMA at 1.4016-1.4020 is a normal corrective retracement inside the uptrend.
A break below the 25 September low at 1.4133 would be the first warning shot. A close below the 20-period EMA would shift the structure from bullish to neutral.
A genuine reversal would need more. It would require a break of the 100-day SMA near 1.3980 and could ultimately expose the lower Bollinger Band near 1.3695, replicating the September corrective sequence but from a higher starting point.
If 1.4260 holds: what a failed breakout looks like
The most instructive scenario is a failed breakout. Price pushes above 1.4260 intraday, fails to close above it, and reverses back through the Bollinger midline, echoing the July triple rejection sequence exactly.
A failed breakout from an overbought RSI condition tends to produce a sharper mean reversion toward the 20-period EMA, not a gradual drift. That is the setup to respect if you are watching for a short.
Having this scenario map before price moves means you execute a pre-decided plan rather than reacting in real time. That is the practical difference between disciplined technical trading and guessing under pressure.
Building conditional scenario maps before price moves is the discipline that separates managed execution from reactive guesswork; the USD/MXN case study from August 2026 applies the same five-step framework of SMAs, RSI, and support mapping that structures the USD/CAD analysis here.
Reading the setup with both eyes open
Pull the three layers together and the picture is coherent. The chart structure is bullish, the indicators are stretched and converging with prior resistance, and the macro context supplies a credible medium-term headwind. That combination rewards patience over aggression.
The core practical risk sits on the short side. Overbought conditions can persist in trending pairs, and USD/CAD held above 1.41-1.42 for extended stretches in 2026 with RSI frequently at or above overbought levels while pullbacks stayed shallow. Selling simply because RSI crossed 70 has repeatedly failed in this pair. Resist the reflex to fade the move without confirmation at the key levels.
Two levels matter above all others: 1.4260 as the resistance trigger, and 1.4016-1.4020 as structural support. Price behaviour at those two points decides which scenario plays out.
Three live variables will resolve the ambiguity within days, not weeks. Keep them on your watchlist:
- ADP employment data: a read on US labour strength and the Fed path
- PCE Price Index: the Fed’s preferred inflation gauge, capable of moving rate expectations sharply
- Crude oil direction: the terms-of-trade lever that drives CAD strength
None of these is background noise. Each can resolve the technical standoff at 1.4260 quickly, and a trader not watching all three is working with an incomplete picture.
This article is for informational purposes only and should not be considered financial advice. Investors should conduct their own research and consult with financial professionals before making investment decisions.
Past performance does not guarantee future results. Technical projections are subject to market conditions and various risk factors, and forward-looking scenarios are speculative and subject to change based on market developments.