The data week for Fed watchers started before it officially began. By late Wednesday, two same-day releases had already begun reshaping the calculus around the October meeting, and both came before a single one of the week’s headlined reports had landed.
That matters because the Fed has signalled it is not finished. September’s decision brought the target funds rate to 3.75%-4.00%, and the central bank has communicated its intention to deliver at least one more increase this year, with both October and December still live. Three marquee releases, PCE inflation, ISM Manufacturing PMI, and the September jobs report, will either validate or complicate that path in the span of 72 hours.
After reading this, you will know which of those releases to watch most closely, what the numbers need to show to move October hike odds materially rather than marginally, and where the market’s implied rate path stands all the way through 2027. The framework matters more than any single print, because the debate this week is not really about whether the Fed hikes again.
What the market is already pricing in before Friday’s jobs number
Before any of the week’s headline releases arrived, the probability tables told the story of a live disagreement rather than a settled consensus. The clearest evidence of that split sits in the October reading itself, which has moved depending on who you ask and when you asked them.
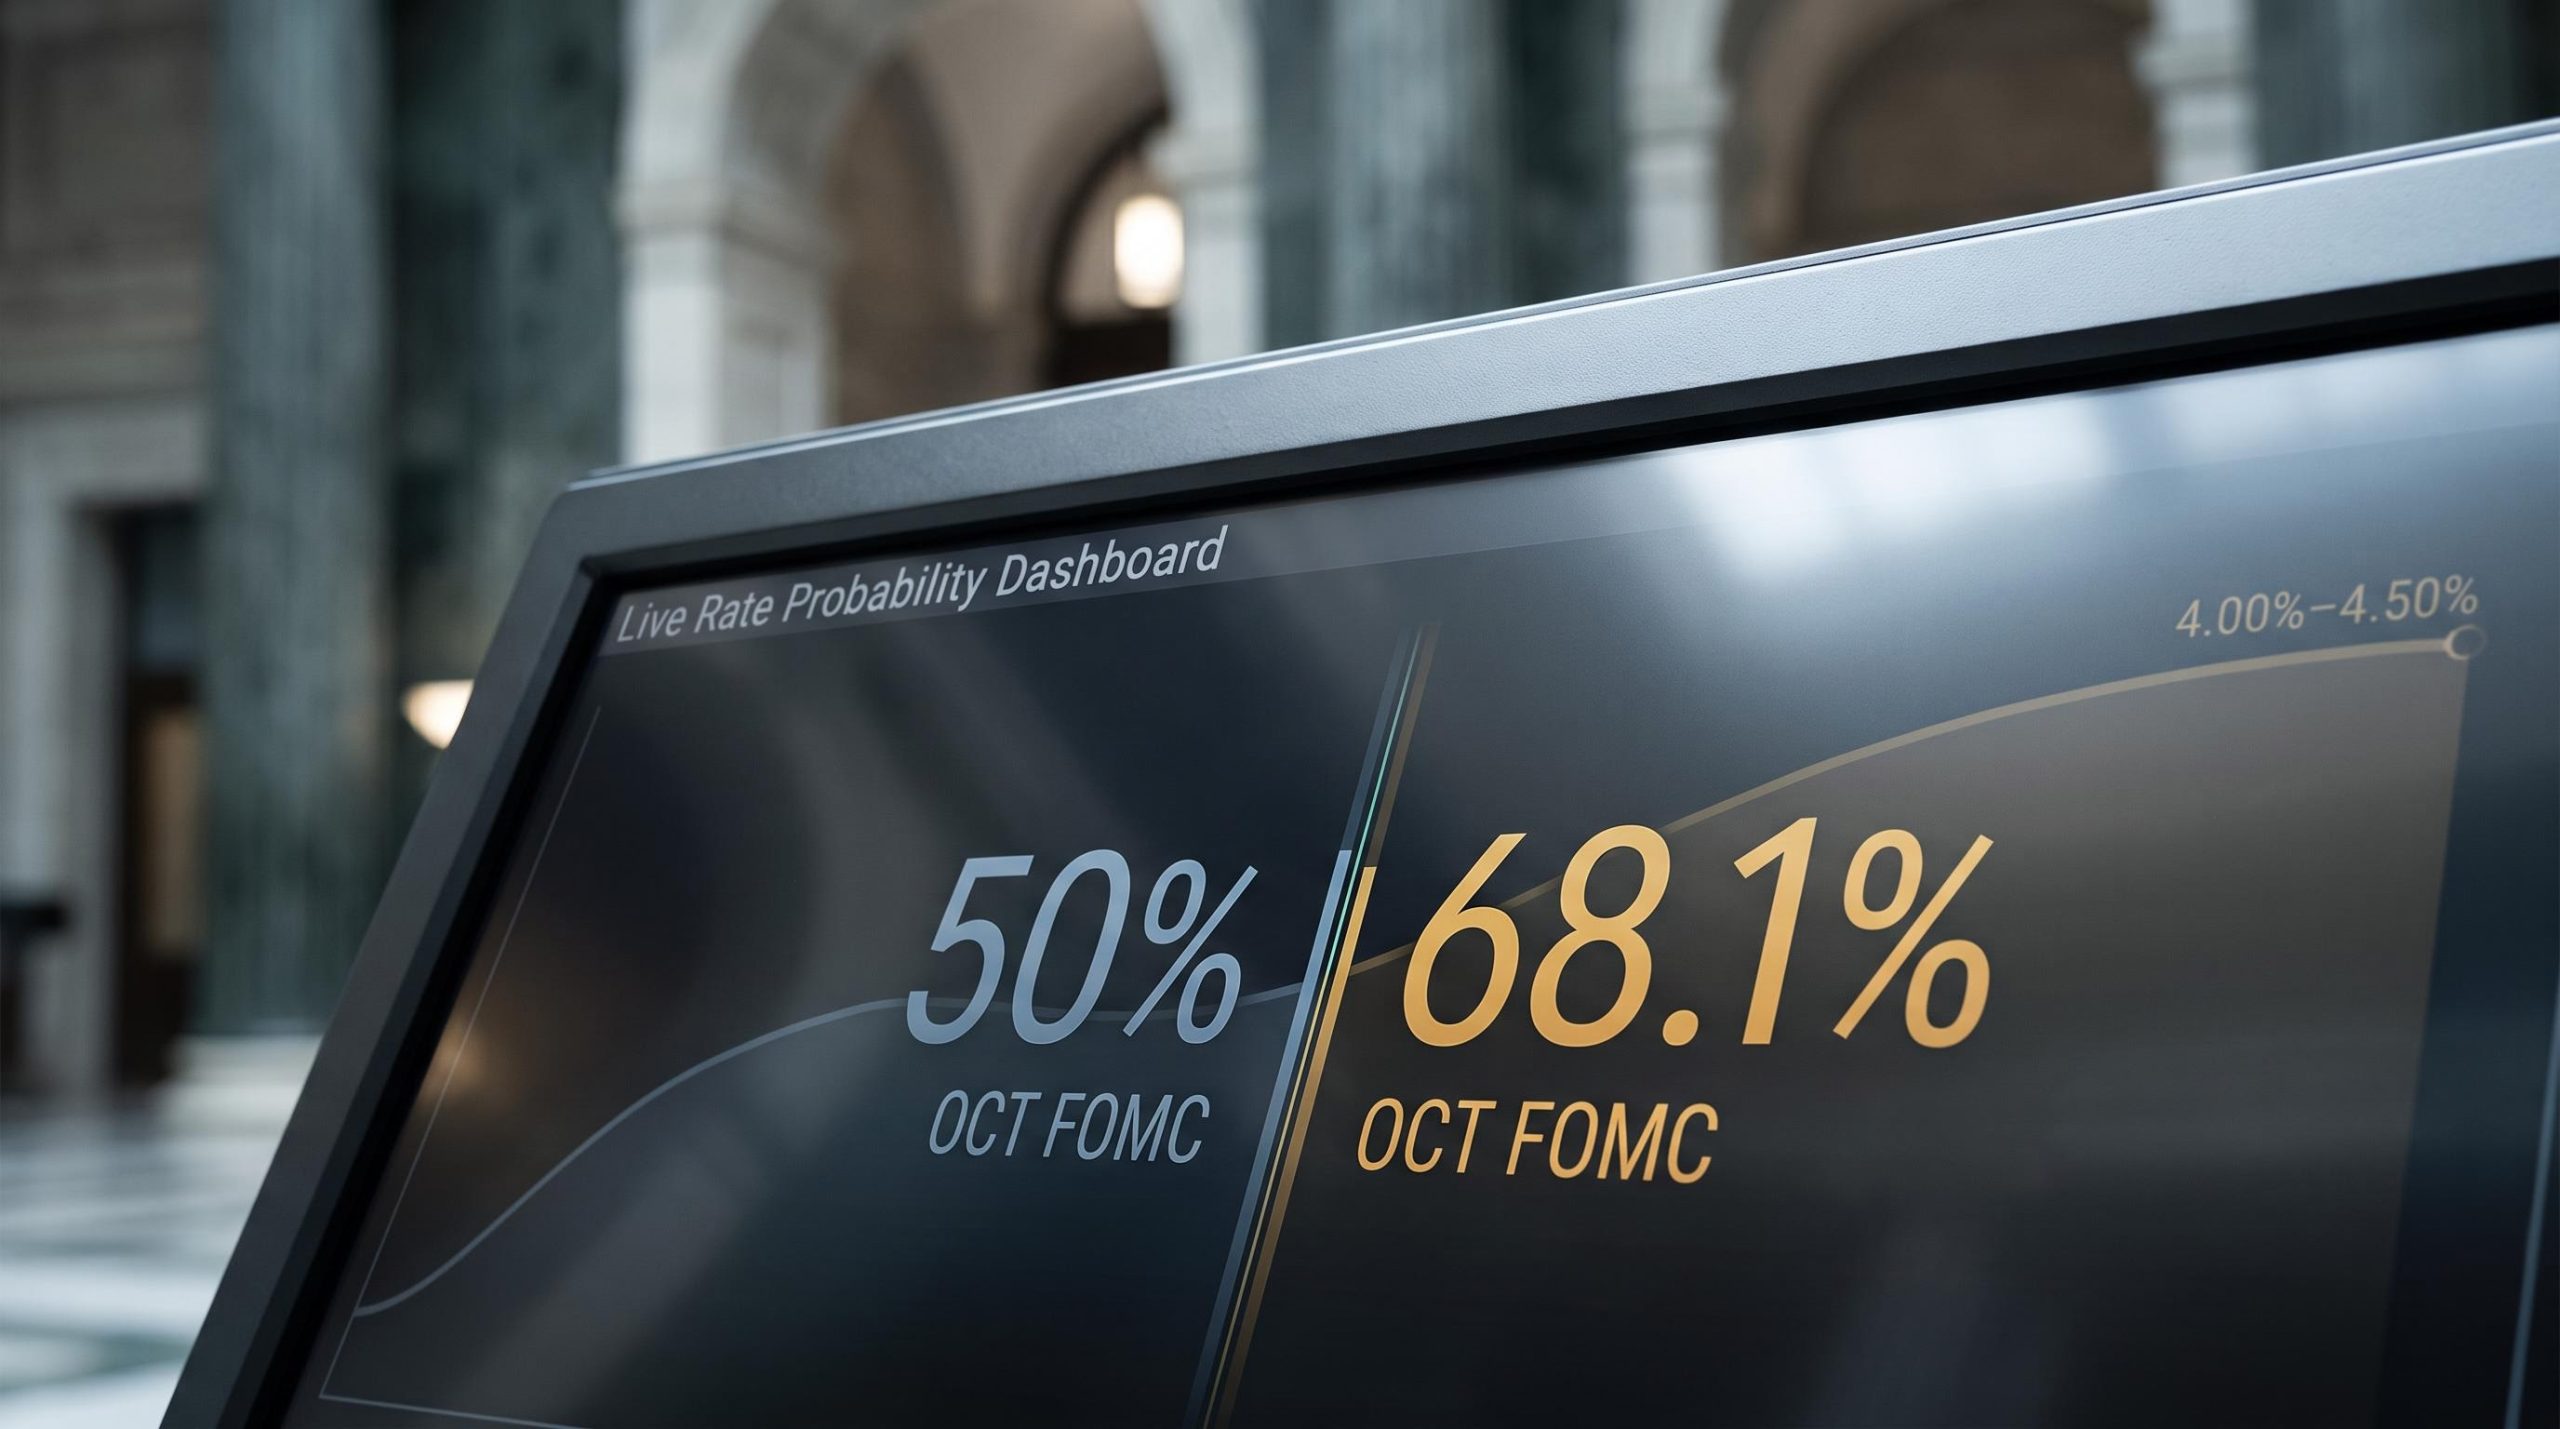
Earlier in the week, CME FedWatch put the odds of a 25-basis-point October hike at 68.1% as of 29 September 2026, per Reuters. Prediction markets Kalshi and Polymarket landed even higher, assigning roughly 69%-71% odds over the same window. Yet late-week reporting from the primary source showed the October probability softening to around 50%, down from roughly 70% at the start of the week.
That spread, 50% on one read and 68%-73% on another, is not noise. It tells you that incoming data has already started doing its work on market pricing, and the week is not even over.
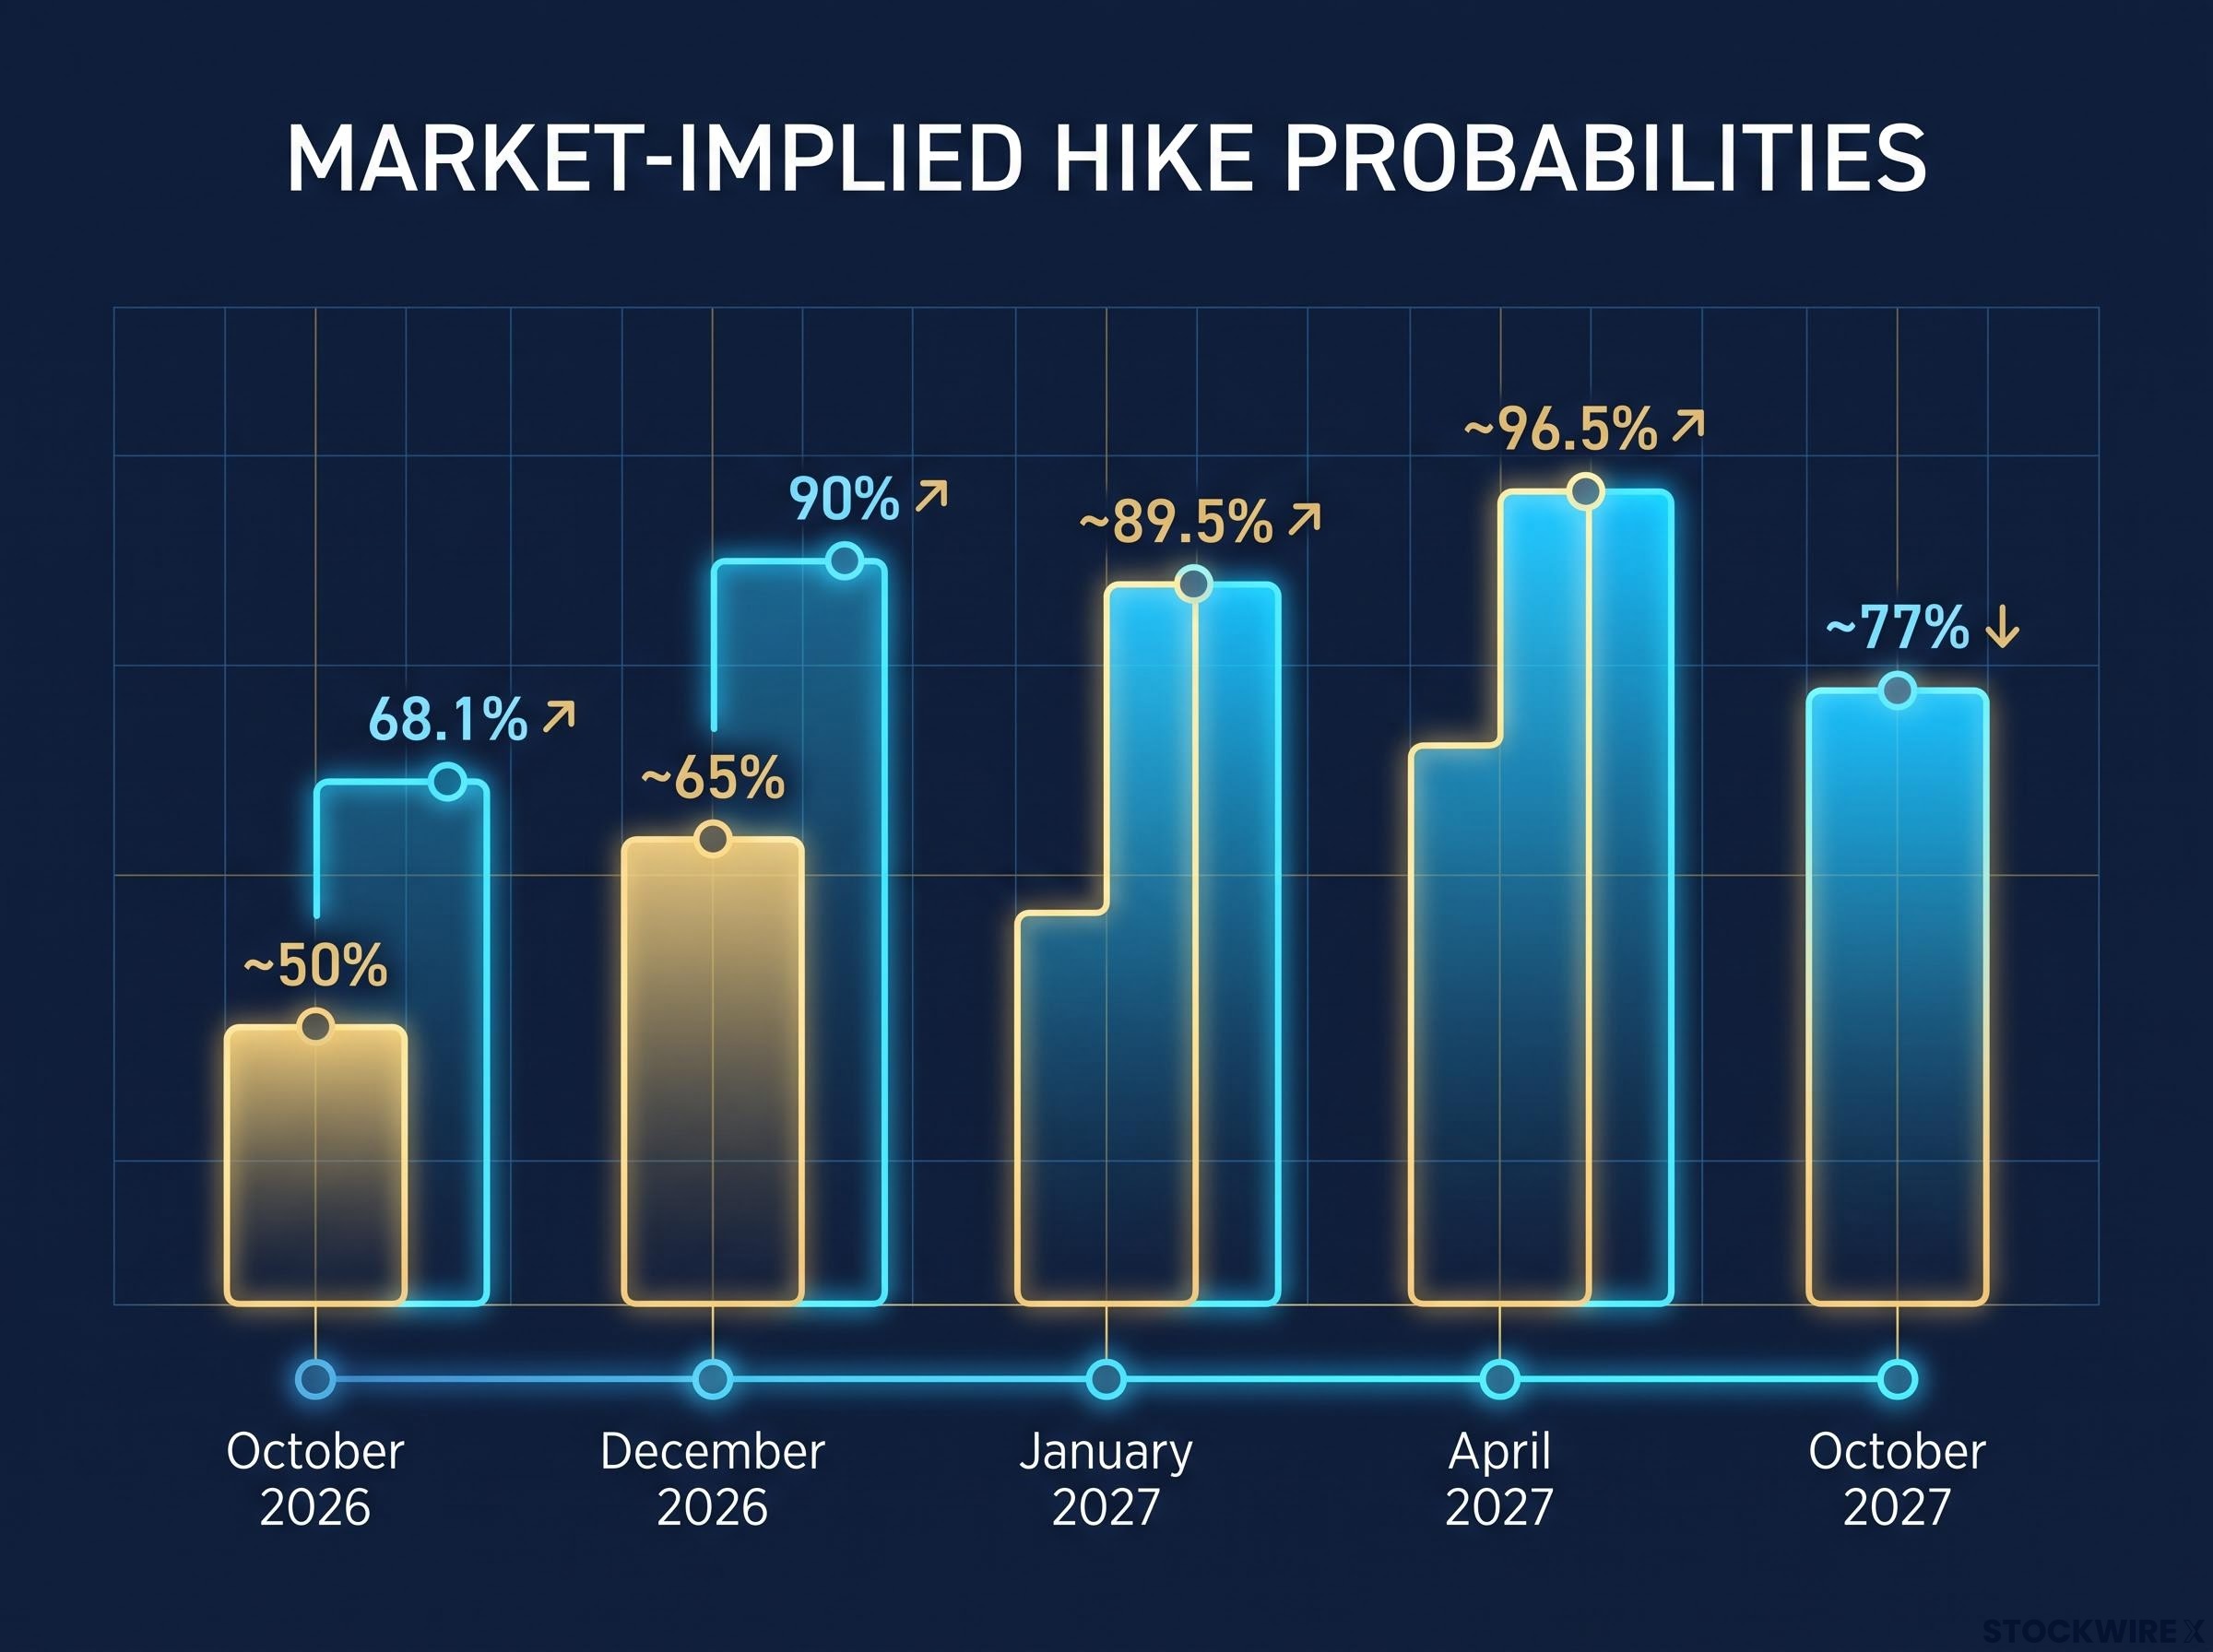
The further out the calendar goes, the more the market firms up. December 2026 odds ranged widely, from approximately 89%-90% in mid-September Reuters reporting down to 65%-66% in the late-week softening. Beyond that, the implied path barely wavers: January 2027 sits near 89.5%, April 2027 at roughly 96.5%, and a third 2027 hike by October priced at nearly 77%, though that October figure has also been drifting lower.
| FOMC Meeting | Hike Probability Range | Source / Timing |
|---|---|---|
| October 2026 | ~50% to 68.1% | CME FedWatch (29 Sep) vs late-week softening |
| December 2026 | ~65% to 90% | Reuters (mid-Sep) vs late-week source |
| January 2027 | ~89.5% | Market-implied pricing |
| April 2027 | ~96.5% | Market-implied pricing |
| October 2027 (3rd hike) | ~77% | Market-implied pricing, softening |
Goldman Sachs and BofA Global Research both project a terminal range of 4.00%-4.50%, implying the cycle is close to its end. Fed officials have reinforced that view directly.
The tension between dot plot vs market pricing has been a recurring source of positioning error in this cycle: the June 2026 SEP median masked a near-even committee split on hikes versus no change, making the median a signal of uncertainty rather than conviction.
New York Fed President John Williams said on 24 September 2026 that it is “reasonable” to expect another rate increase by year-end.
For your positioning, the distinction that matters is between data that confirms consensus and data that genuinely moves it. A repricing from 50% to 70% on October carries real portfolio implications. A drift from 68% to 72% does not.
When big ASX news breaks, our subscribers know first
Two data releases that moved the needle before the big week began
Two soft readings arrived before the headline reports, and placed side by side they give an early read on which way the pre-report wind is blowing. Neither alone proves much, but together they sketch a pattern worth noticing.
The first was the August JOLTS report from the Labor Department, which showed job openings falling well short of expectations. Openings dropped by 256,000 to 7.079 million, below the roughly 7.225 million economists had penciled in, and the lowest level since March.
- Openings fell 256,000 to 7.079 million (consensus: ~7.225 million)
- Openings rate declined to 4.3% from 4.4%
- Openings-to-unemployed ratio fell to 1.01 from 1.06
The ratio still sits just above one, and above pre-pandemic norms, which tells you labour demand is moderating rather than collapsing. Jobs remain available. They are simply less abundant than earlier in the cycle.
Consumer confidence at a 12-year low, and what it signals about household conditions
The second release struck a sharper note. The Conference Board’s consumer confidence index for September dropped 6.7 points to 81.9, its lowest reading since April 2014, a level not seen in more than 12 years.
What makes the drop notable is that both the present situation and expectations components fell at once, and the proportion of respondents reporting difficulty finding work trended higher, echoing the softer JOLTS figures. This weakness is occurring despite unemployment remaining relatively low, which suggests households are reacting to price levels and borrowing costs rather than to job loss itself.
There is a plausible split underneath that reading. Household sentiment may be deteriorating even as AI-driven corporate investment activity holds up, meaning the weakness could reflect a divergence between how households feel and how businesses are behaving, rather than an economy-wide slide.
That divergence is the whole point. The prior week’s S&P Global PMI showed US expansion running at its fastest pace since 2021, and the Atlanta Fed’s GDPNow model was tracking roughly 5% third-quarter growth. Soft data and hard data are starting to tell different stories, and which one the Fed weights more heavily is exactly what Friday’s jobs report will help resolve. Read only the headline Friday number without this context, and you miss the softening in demand that has been building all month.
Why the jobs report outranks PCE as this week’s Fed swing factor
The reason the jobs report carries more weight than PCE is not a matter of habit. It follows directly from how the Fed’s mandate is written.
Congress gave the Fed a dual mandate, meaning maximum employment and price stability carry equal statutory weight. Labour data is therefore not secondary to inflation data in the Fed’s framework; a meaningful shift in payroll growth or unemployment feeds straight into the central bank’s read on slack in the economy.
Congress gave the Fed a Federal Reserve dual mandate, and the statutory equality between maximum employment and price stability is not merely procedural; it means a labour market reading carries the same formal weight as a PCE print when officials are deciding whether to move.
That statutory equality is the first of three structural reasons the jobs report outranks PCE this week:
- Dual mandate standing: Employment sits on equal legal footing with inflation, so labour data can move the calculus as directly as any price reading.
- Absorptive capacity signal: Solid payroll growth tells the Fed the economy can withstand further tightening; a sharp slowdown signals prior hikes are already biting.
- Reconstructability of PCE: Much of the PCE data can be pieced together from earlier CPI and PPI releases, which drains its capacity to surprise.
Trace the two scenarios through and the asymmetry becomes clear. Consensus for the September report runs from roughly 84,000 to 90,000 nonfarm payrolls, with the unemployment rate expected at 4.1%-4.2%. Either figure is already a steep deceleration from the prior month’s 162,000 gain.
A print landing near or below that range confirms the softening trend and raises the bar for an October hike. A number that surprises to the upside removes the cautious case almost entirely, since it would show the labour market absorbing tightening without strain. Moneycontrol’s 27 September preview framed it plainly: investors will use the jobs number to reassess whether the Fed follows September’s move with another in October.
PCE, by contrast, is expected to hold at 3.7% year-over-year, with the monthly figure accelerating from 0.2% to 0.4%. Because so much of that data is already visible in earlier releases, PCE is far more likely to confirm the inflation trajectory than to overturn the Fed’s stance.
J.P. Morgan chief US economist Michael Feroli, in a note dated 25 September 2026, argued there is “a credible case” for passing on an October hike to allow time to observe the effects of previous tightening.
For you, the takeaway is one of allocation of attention. Over-reacting to a PCE print that mostly confirms the trend, while under-preparing for a jobs number that can genuinely shift the October call, is the error worth avoiding this week.
How the competing analyst camps read the same data differently
The same set of facts is producing two internally coherent arguments, and understanding both lets you stress-test your own view rather than adopting one camp’s conclusion by default.
Market skepticism of the dot plot runs deeper than a single meeting’s odds: the 10-year Treasury yield hit roughly 5.1-5.2% in late September 2026, a 19-year high, driven by persistent services inflation, AI infrastructure spending feeding sticky demand, and a neutral rate estimate from Deutsche Bank that sits well above the Fed’s own figure.
The hawkish case starts with resilient activity. Goldman Sachs forecasts the next 25-basis-point hike in October, while BofA Global Research projects two hikes, October and December, totalling 50 basis points and lifting the target range to 4.25%-4.50%. Both cite still-robust recent activity and persistent inflation as justification for continuing, and Williams’ “reasonable to expect another hike” comment lends the view official backing. An economist at Renaissance Macro Research, cited by Bloomberg, described the labour market as “stabilized” but warned that ongoing inflation could force the Fed to move faster than investors expect.
What the historical cycles say about pausing at the wrong time
The cautious camp reads the leading indicators differently, and leans on the Fed’s own track record to make its point.
In 2018, the Fed raised rates four times, then pivoted in early 2019 as market volatility spiked and sentiment weakened, eventually cutting later that year. That episode is cited as a warning against tightening into softening conditions. The 2006-2007 cycle offers the opposite failure: the Fed held after a long series of hikes, then delayed cuts as housing and confidence deteriorated, and the pause is widely judged to have come too late.
The 1994-1995 cycle is the counter-example the cautious camp points to as a relative success. The Fed tightened rapidly, then paused and cut in 1995 without triggering a recession, with softer sentiment helping signal that enough had been done.
These precedents are not settled science, but they tell you the Fed has a history of reading late-cycle signals too slowly. The current mix, softening sentiment against resilient activity, is precisely the ambiguous setting where past errors have occurred.
| Hawkish Camp | Cautious Camp | |
|---|---|---|
| Primary argument | Resilient activity and persistent inflation support continued tightening | Softening sentiment and labour demand raise overtightening risk |
| Key supporting data | S&P Global PMI fastest since 2021; GDPNow ~5%; hawkish dot plot | Confidence at 81.9; JOLTS ratio at 1.01 |
| Rate path projection | October hike (Goldman); Oct + Dec to 4.25%-4.50% (BofA) | One more hike (December), credible case to skip October (J.P. Morgan) |
Holding both camps in view lets you interpret Friday’s number contextually rather than mechanically, and calibrate exposure to whichever scenario the data most closely validates.
What the data this week needs to show to change the rate path
Rather than waiting passively for Friday, you can hold a clear set of conditions to watch. The October hike probability entering the data week ran somewhere between 50% and 68% depending on the source, and that range is the starting point for judging what counts as a material shift.
The week arrives in three sequenced signals, each with its own threshold:
- PCE inflation: Expected at 3.7% year-over-year. A major upside surprise would harden the hawkish case, but a print near consensus mostly confirms the trend and moves little.
- ISM Manufacturing PMI (Thursday): A strong reading consistent with the S&P Global PMI’s fastest expansion since 2021 tightens the case for October; a weak one aligns with the sentiment deterioration and feeds the cautious argument.
- September jobs report (Friday): Consensus of 84,000-90,000 payrolls and 4.1%-4.2% unemployment. This is the release most likely to move the October call.
The activity backdrop still leans toward continued tightening, which is why the jobs report carries the burden of proof for the cautious camp.
The Atlanta Fed’s GDPNow model was tracking approximately 5% third-quarter growth, up from around 4% over August and September, and the US Economic Surprise Index had rebounded sharply, signalling that incoming data has consistently beaten expectations.
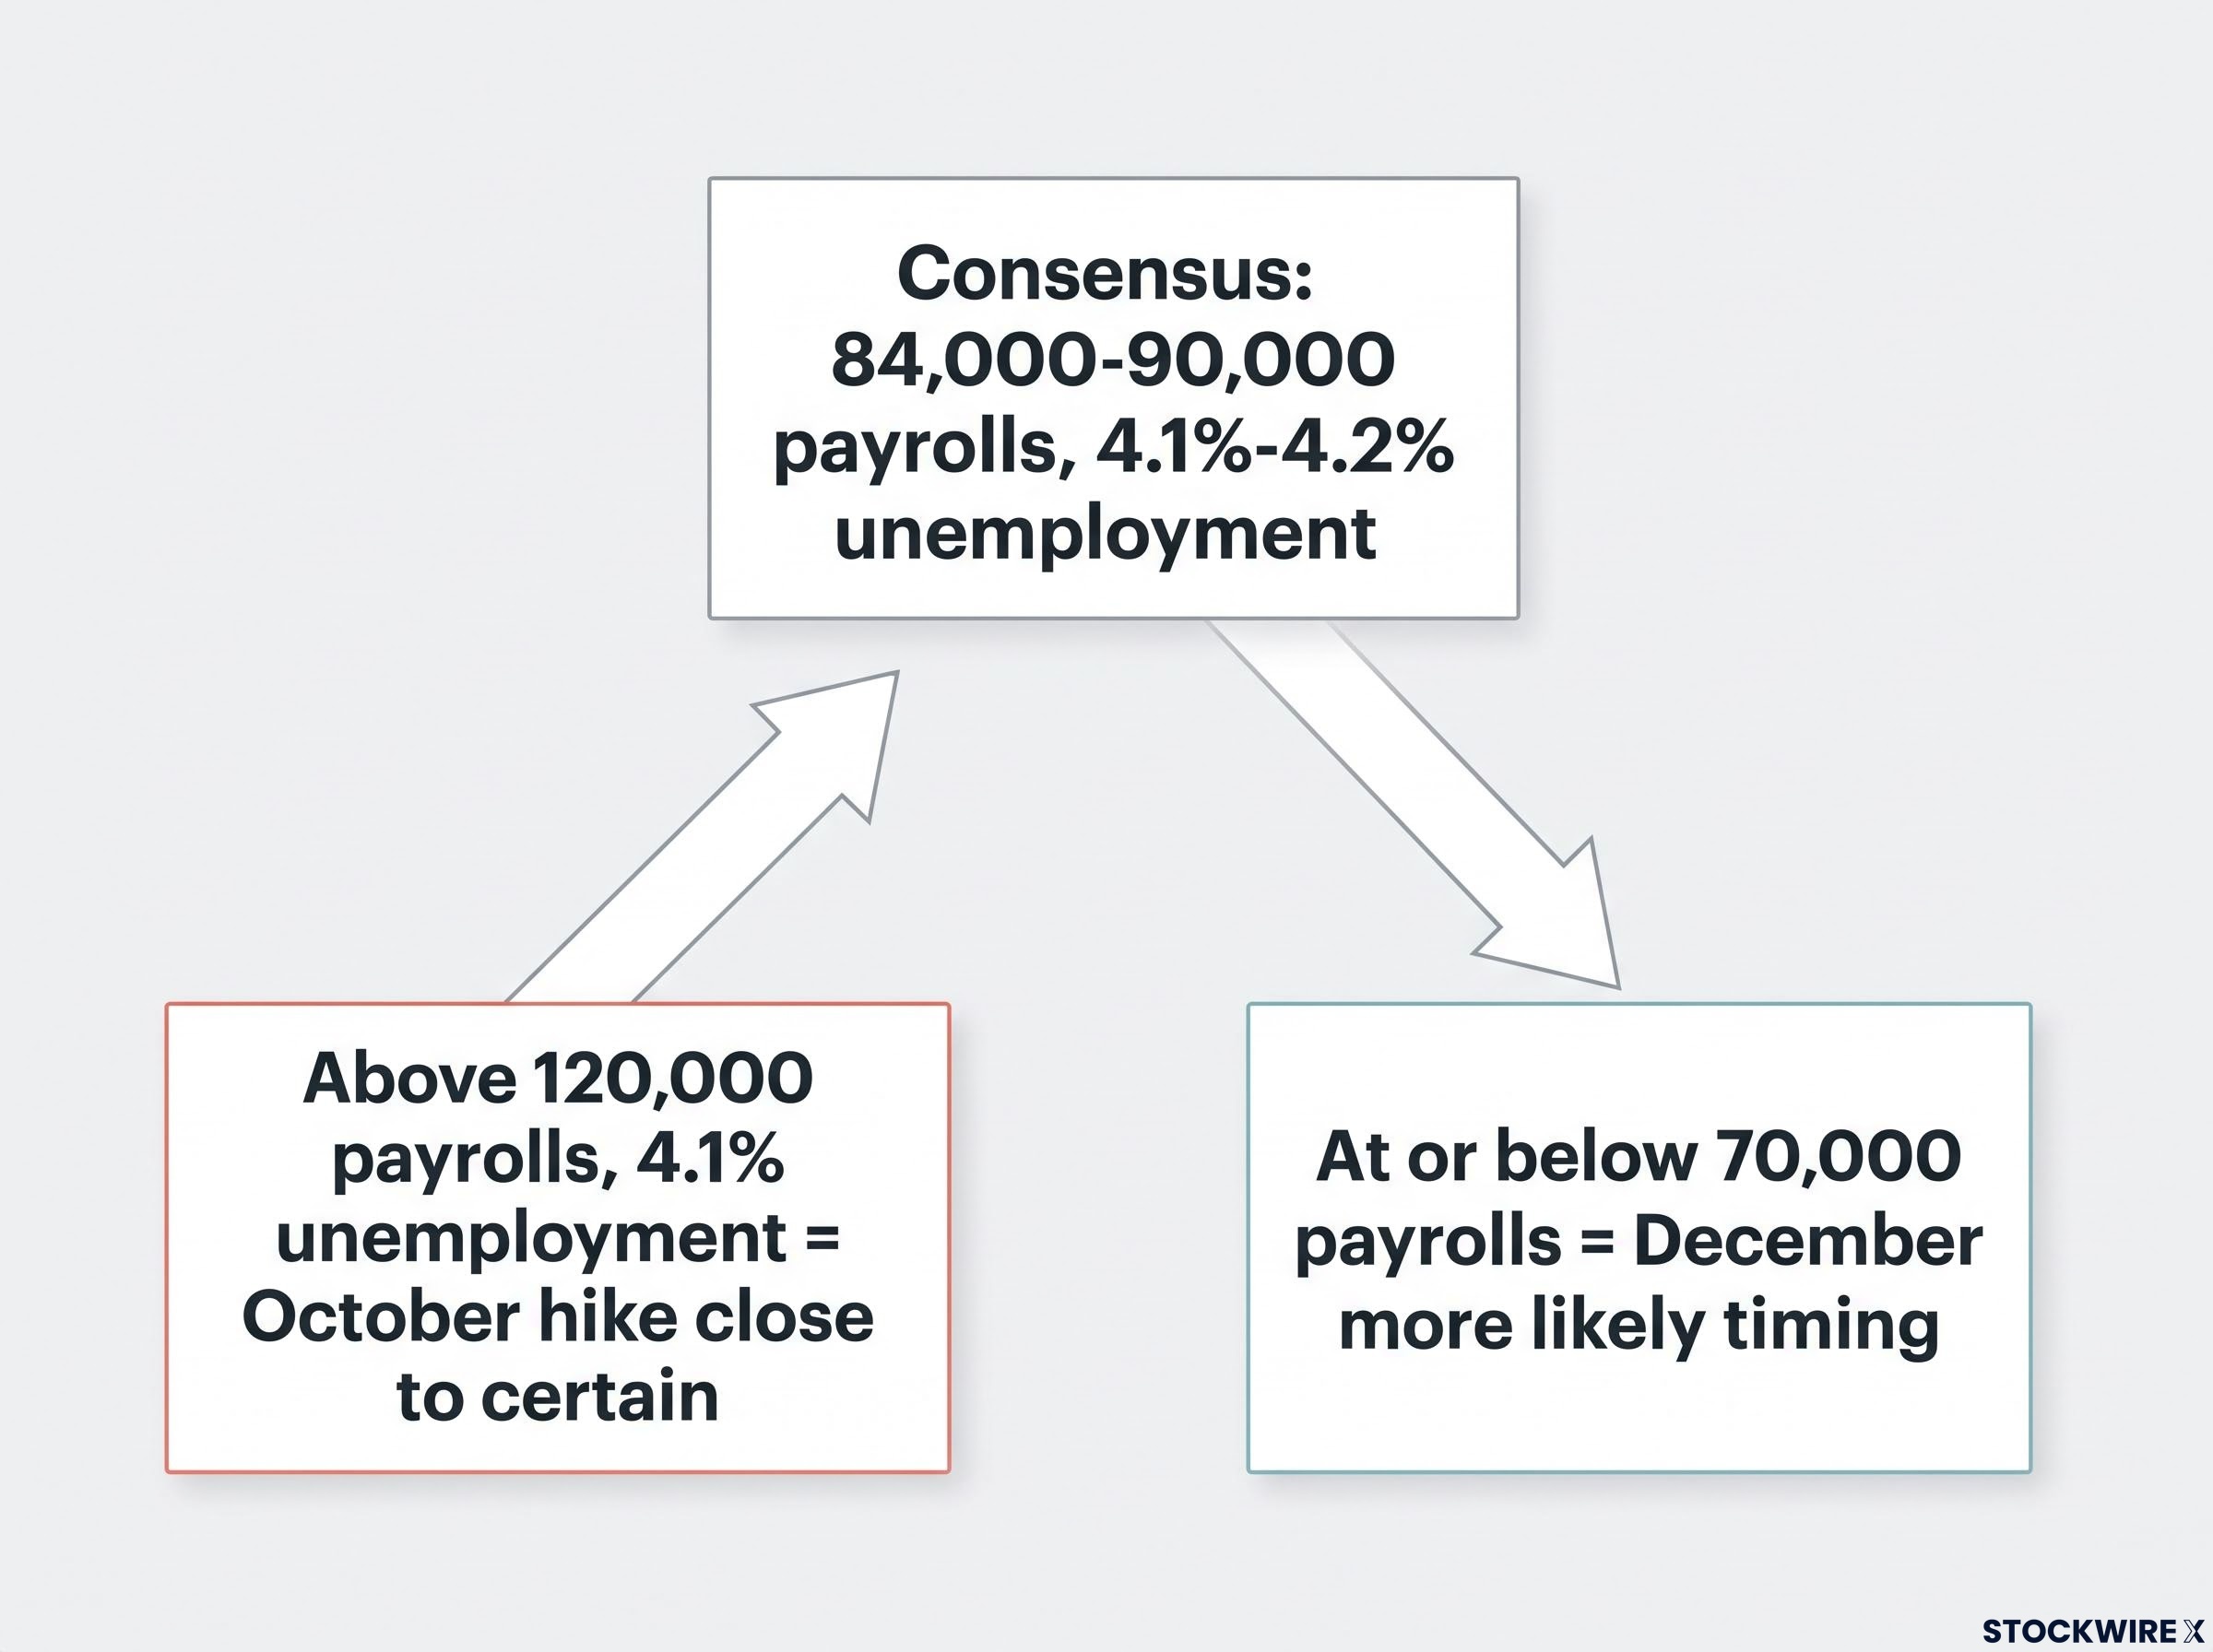
Here is the practical read. If Friday’s payrolls come in well above consensus, say above 120,000, with unemployment holding at 4.1%, an October hike becomes close to certain and the debate effectively closes. If payrolls land at or below 70,000 with unemployment ticking up, the cautious camp gains real ground and December becomes the more likely timing for the next move.
The question this week is not whether the Fed hikes again. It is whether the next move lands in October or December, and the answer is most likely to come from payrolls. Having these signposts set before the number prints lets you react analytically rather than emotionally, with a framework already in place for a range of outcomes.
Three variables that will define the Fed’s path from here through 2027
Beyond Friday, three variables will determine whether the market’s implied 2027 path holds or reprices. Keeping them in view gives you a repeatable lens instead of a reflex to every headline.
- Payroll trajectory: Not a single print, but the direction across the next two or three reports. A sustained slide below consensus would strengthen the case for a shorter cycle; continued resilience keeps the hawkish path intact.
- Inflation direction: Whether PCE and CPI show a durable deceleration or a re-acceleration. Sustained cooling supports an early plateau; a renewed pickup could force faster moves than the market currently prices.
- The sentiment-activity divergence: Whether the gap between weakening household confidence and resilient corporate investment resolves upward or downward. Its resolution decides which camp the data ultimately vindicates.
Payroll trajectory is the variable the market has been re-rating all summer: June 2026 payrolls printed at just 57,000, less than half the consensus forecast, and both May and April were revised sharply lower, establishing the deceleration pattern that makes September’s print a test of whether the trend continues or breaks.
The stakes are narrower than they might appear. With the funds rate at 3.75%-4.00% and Goldman Sachs and BofA projecting a terminal range of 4.00%-4.50%, only one or two moves remain by most estimates. The cycle is close to its endpoint.
The 2027 path is priced at near-certainty for the first two moves, January at 89.5% and April at 96.5%, which tells you those hikes are already embedded in asset prices. The variable that actually matters for positioning is whether the third 2027 hike, currently at 77%, survives contact with the incoming data.
The Fed’s dot plot and market pricing are now broadly aligned, which lowers the odds of a shock repricing unless one of these three variables moves sharply. The JOLTS ratio at 1.01 and confidence at 81.9 are the sentiment gauges to track across the coming months. Watch these three, and the rate path through the first half of 2027 becomes something you monitor rather than something that surprises you.
Making an informed call in a data-dense, late-cycle environment
This week’s data will not settle the entire 2026-2027 rate path, but it will almost certainly narrow the range of credible outcomes for October. The three forward-monitoring variables, payroll trajectory, inflation direction, and the sentiment-activity divergence, are the lens for the months ahead. The specific thresholds for Friday, above 120,000 payrolls firming an October hike, at or below 70,000 shifting the odds toward December, are what to carry into the print itself.
The grounding fact worth holding onto is that even the cautious camp expects the tightening to continue. J.P. Morgan’s Feroli still anticipates one more hike; the disagreement is about timing and pace, not direction. That is grounds for analytical clarity rather than complacency: you are watching a cycle narrow toward its endpoint, not one whose destination is genuinely in doubt.
This article is for informational purposes only and should not be considered financial advice. Investors should conduct their own research and consult with financial professionals before making investment decisions. Past performance does not guarantee future results. Financial projections are subject to market conditions and various risk factors.