Most investors are still waiting for inflation to go back to normal. The assumption underneath that patience is simple: prices spiked because of the pandemic, and once the disruption fully clears, the Federal Reserve will guide the numbers back to target. It is a comforting story, and it may be the wrong one.
For two decades, Western economies enjoyed a quiet gift. Cheap goods flowed in from China, tariffs were low, and shipping lanes were open. That world is coming apart. Tariffs, geopolitical friction, and fragile supply chains are now rebuilding price floors that globalisation spent twenty years tearing down.
This piece lays out a framework for telling the difference between the two possibilities that matter most to your portfolio. Is the current environment a temporary cyclical spike that policy will eventually cure, or is this structural inflation: a permanent upward shift in the baseline that monetary policy alone cannot dismantle? The evidence sits in four places, and it points in one direction more than the other.
The reversal of the globalised deflationary tailwind
To understand why prices behave differently now, start with how they behaved before. For most of the past twenty years, globalisation did something remarkable: it exported deflation directly into American shopping baskets.
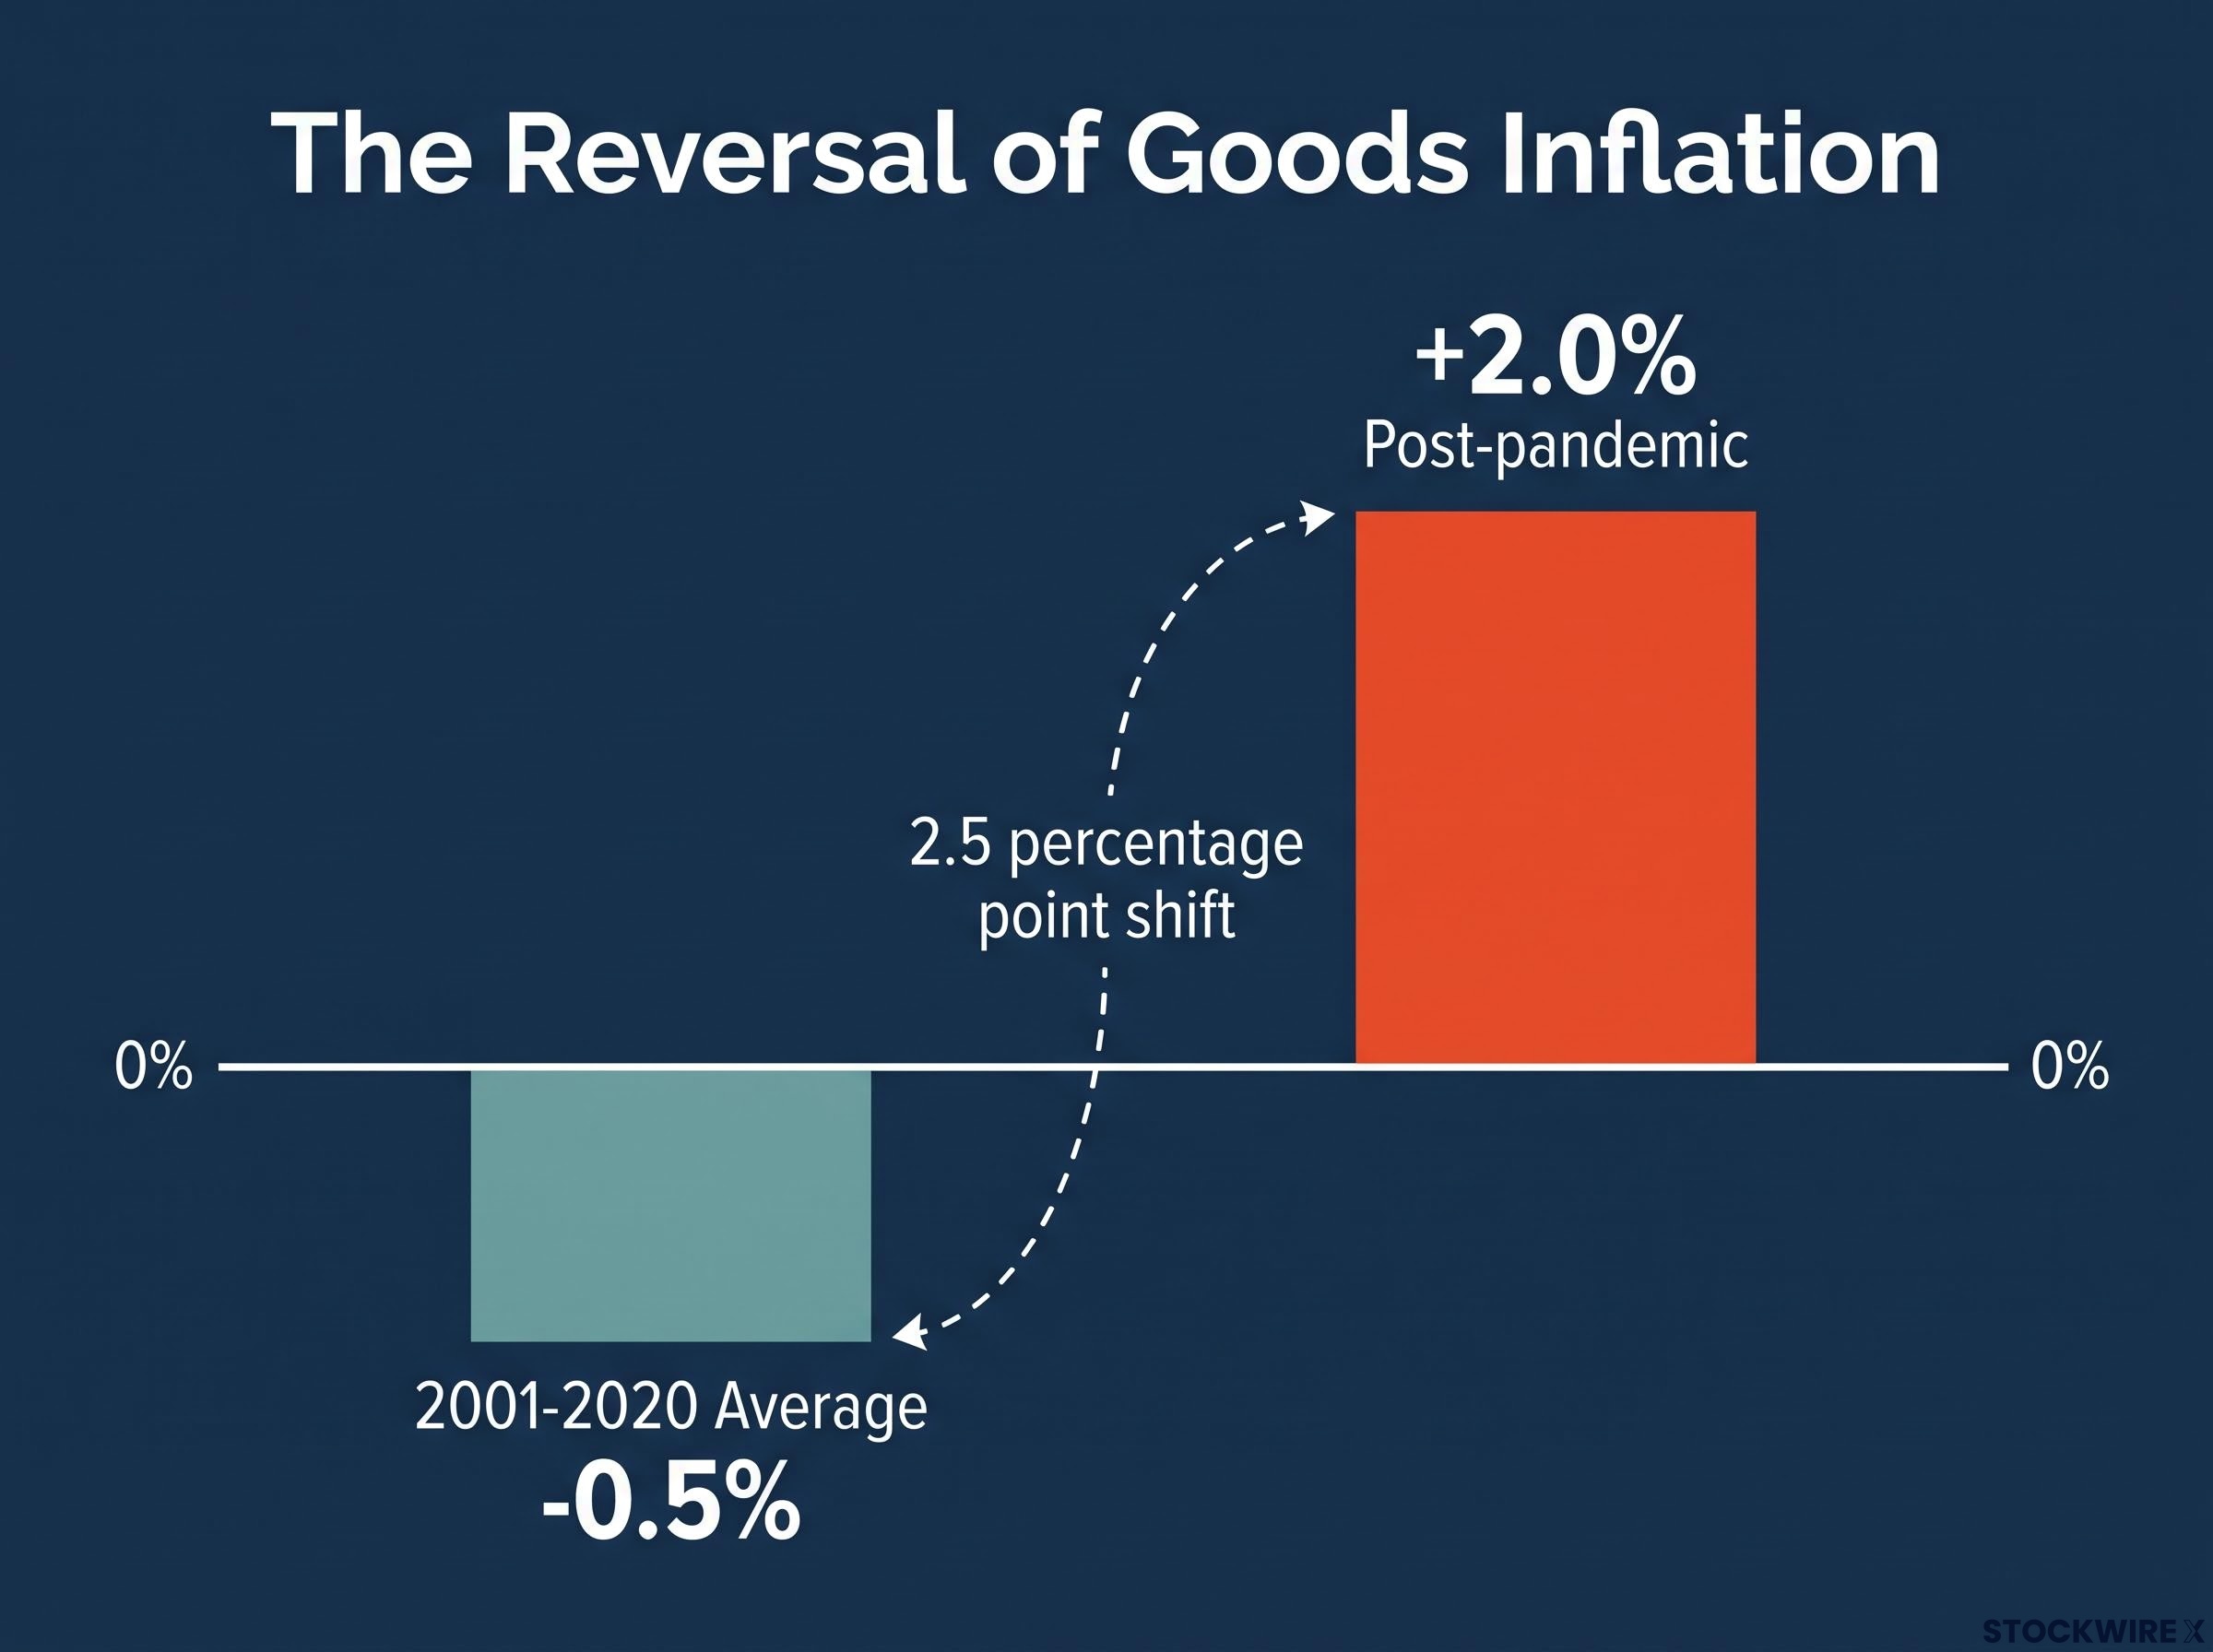
According to analysis from Jim Bianco of Bianco Research, goods inflation ran at an average of roughly negative 0.5% annually from 2001 to 2020, the period following China’s entry into the World Trade Organization. Falling prices on physical products were a constant background force, quietly offsetting rising costs elsewhere in the economy.
That force has reversed. Bianco estimates goods inflation has swung to around positive 2% in the post-pandemic period, a shift of roughly 2.5 percentage points. Wars, tariffs, and chronic supply chain disruption replaced the deflationary tailwind with a persistent headwind.
You need to sit with what this means. The cheap flat-screen televisions and affordable cars of the last twenty years were a historical anomaly, not an economic baseline you can lean on when building a portfolio for the decade ahead.
The clearest illustration is the car market. Chinese manufacturer BYD produces electric vehicles priced as low as $9,000, with standard models around $16,000 in US dollar terms. Letting those vehicles into the US market freely would be effectively incompatible with the survival of the domestic auto industry.
That tension is why tariffs are now bipartisan. Neither party is likely to re-engage meaningfully with China on trade, because the cost of cheap goods was paid somewhere specific.
Princeton economists Anne Case and Angus Deaton, in their 2019 book Deaths of Despair, documented elevated rates of substance abuse, alcoholism, and suicide across rust belt regions hit by industrial displacement. Manufacturing, unlike finance, law, or healthcare, had no regulatory barrier to protect it from global competition.
The political lesson has landed. Protectionism is now a price floor that neither party will remove, which means the old normal is not returning through policy.
When big ASX news breaks, our subscribers know first
Why the Federal Reserve timeline keeps shifting
If goods prices have structurally reset, the central bank’s own projections should be the place you look for confirmation or contradiction. What you find there is stubborn optimism sitting on top of steadily rising numbers.
The Fed’s institutional view treats current inflation as a prolonged cyclical episode, not a regime change. J.P. Morgan Asset Management notes that across its March, June, and September 2026 commentaries, the Fed’s projections still point toward inflation near 2% by 2028, with the longer-run target anchored at 2.0%. The message is that the path down is slower and bumpier, but the destination has not moved.
The limits of Fed control over real economic outcomes are structural, not incidental; the central bank directly sets only the overnight interbank rate, while the mortgage, business loan, and consumer credit rates that actually shape spending and investment travel through transmission channels the Fed influences but does not govern.
The September 2026 Summary of Economic Projections shows median PCE inflation descending from 3.7% in 2026 to 2.3% in 2027 and 2.1% in 2028. On paper, convergence looks orderly.
The problem sits in the revisions. Look at how the 2026 Core PCE forecast moved across a single year.
| Meeting | 2026 Core PCE | 2027 Core PCE | 2028 Core PCE |
|---|---|---|---|
| March 2026 SEP | 2.7% | 2.2% | 2.0% |
| June 2026 SEP | 3.3% | 2.5% | 2.1% |
| September 2026 SEP | 3.4% | 2.5% | 2.1% |
The near-term number climbed from 2.7% to 3.4% in six months. The 2028 destination barely budged.
According to Bianco Research, the Federal Open Market Committee has held a version of this “2% by the year after next” projection across roughly 40 consecutive quarters since 2021 without ever reaching it. The target keeps arriving two years away, and two years later it is still two years away.
Analysis of 150 years of price data shows that generational inflation regimes tend to persist for 15-20 years rather than mean-reverting within a single policy cycle, a pattern that sits uncomfortably against the Fed’s own 2028 convergence timeline.
When policymakers repeatedly nudge their near-term forecasts higher while leaving the long-run target untouched, you should read that as a signal to prepare for inflation to persist well beyond the official timeline. The dot plot is a forecast, not a promise, and its track record on the near term has been one of catching up to reality rather than predicting it.
The physical friction of energy and contested trade routes
Inflation is not only a story of spreadsheets and central bank models. It is also physical: fuel that has to be refined, tankers that have to cross contested water, and cargo that has to reach a port. That friction has a cost, and the cost is rising.
Start with diesel, which moves nearly everything else. Russia, historically the largest diesel exporter on the planet, has become a net importer after wartime refinery damage, according to Bianco Research. The United States now sits as the second-largest exporter, absorbing demand that used to be met elsewhere.
Diesel as a pricing transmission mechanism
Diesel matters because it is a transmission mechanism for broad goods inflation. Trucks, trains, ships, and farm equipment all run on it, so when diesel costs more, the price shows up in nearly every physical product further down the chain. A disruption to global diesel supply is not an isolated energy problem; it is a general price problem.
The diesel crack spread, the premium refiners charge over crude, is running at four to five times its historical norm according to S&P Global CERA, confirming that price pressure is being generated inside the refining layer itself rather than simply tracking headline oil benchmarks.
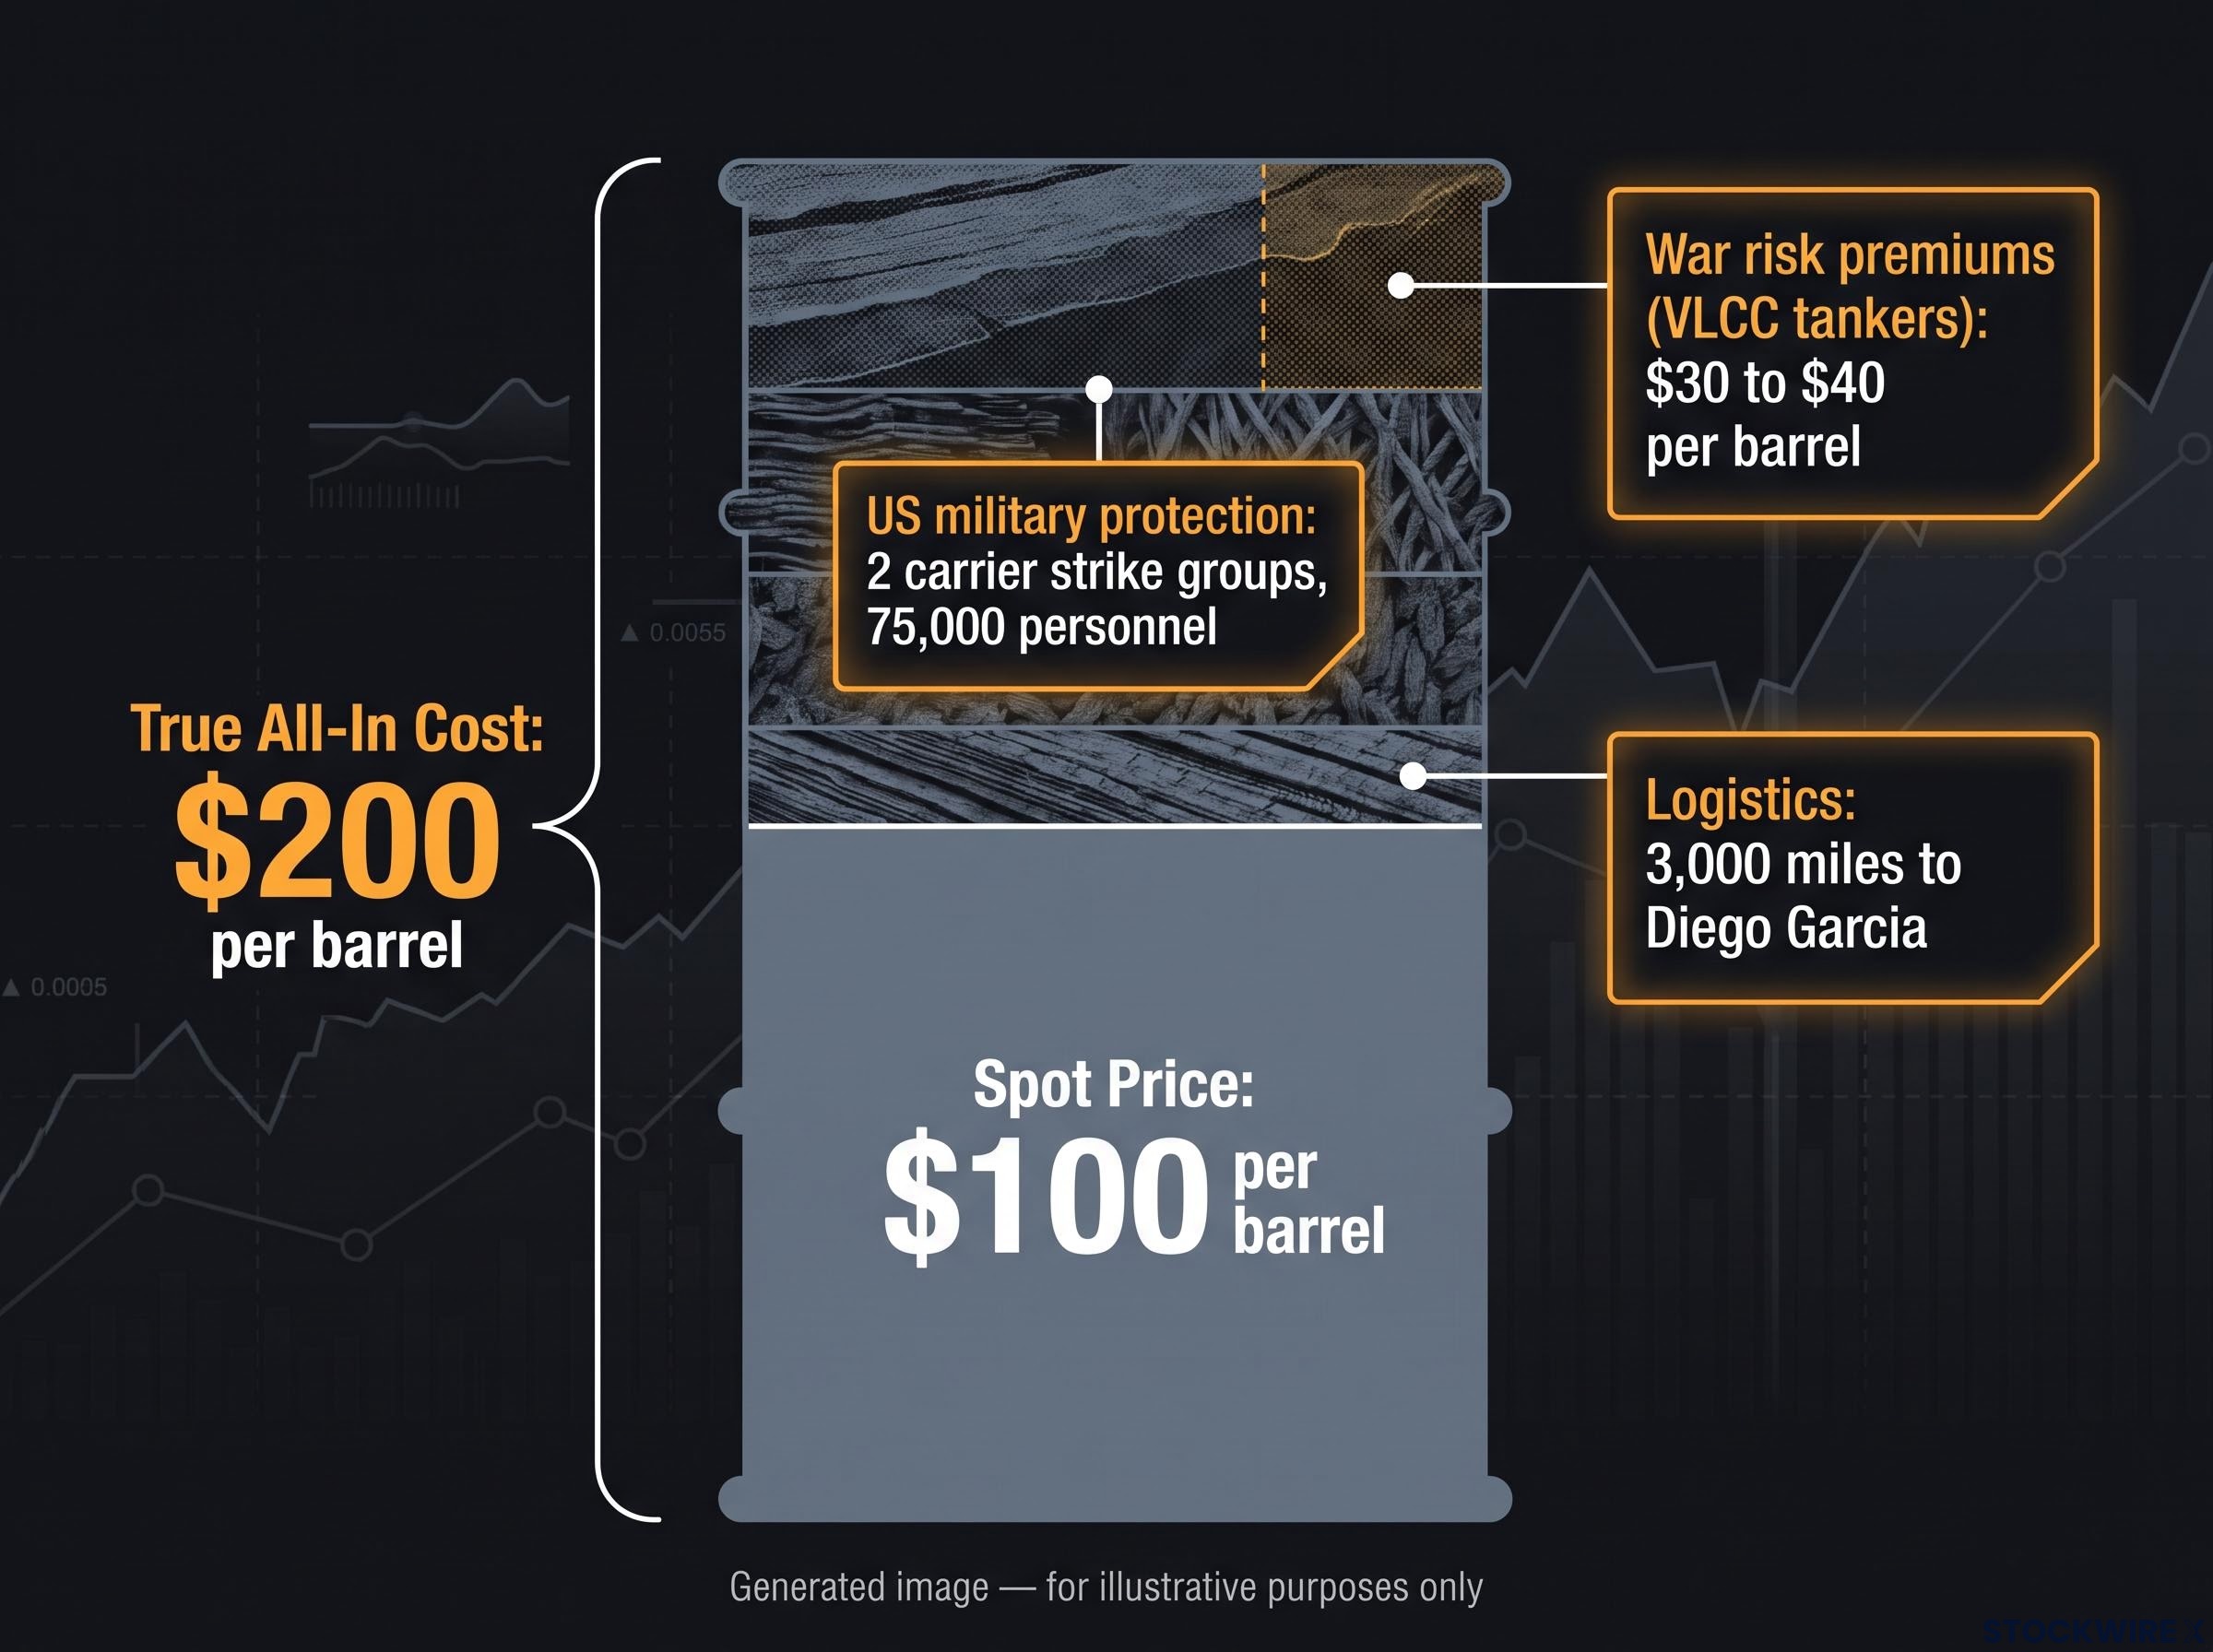
The friction extends to how oil itself moves. Tanker rental costs for very large crude carriers have escalated from roughly $1 per barrel before the war to somewhere between $30 and $40 per barrel today, driven largely by war risk premiums.
Then there is the cost that never appears on a commodity screen. Using a framework credited to analyst Rory Johnston, Bianco estimates that oil at roughly $100 per barrel carries an effective all-in cost closer to $200 per barrel once you account for the hidden machinery keeping shipping lanes open.
That gap between the spot price and the true cost is bridged by:
- War risk premiums baked into VLCC tanker rates of $30 to $40 per barrel
- US military protection running to two carrier strike groups and roughly 75,000 personnel
- Supply chain logistics stretching approximately 3,000 miles to Diego Garcia
You have to factor this friction directly into your inflation expectations. The hidden costs of military protection and rerouted shipping do not disappear; they eventually surface in the prices you pay and in the margins of the companies you own.
Reading the bond market timeline for capital allocation
Theory is one thing. What the bond market is actually pricing is another, and fixed income is where the structural versus cyclical debate becomes real money.
The clearest single reading comes from Treasury Inflation-Protected Securities, or TIPS, which are government bonds whose value adjusts with inflation. The gap between their yield and ordinary Treasury yields, known as the breakeven rate, tells you roughly what the market expects inflation to average.
According to Bianco Research, the nearer-term 5-year breakeven is running close to 1 percentage point above pre-pandemic levels, consistent with the Fed’s own above-target projections through 2027. The longer-dated signal is calmer: the 5-year/5-year forward breakeven, which strips out short-term oil noise by measuring expected inflation between years five and ten, suggests a return to pre-pandemic normalisation somewhere around 2031 to 2036.
Two caveats matter. Bianco notes that TIPS-based forecasts have historically performed no better than chance against actual outcomes, so read them as sentiment rather than prophecy.
The historical clock is more useful. Typical inflation cycles last 8 to 12 years, averaging 10 years. This cycle began around 2021, which places its likely end near 2031, longer than the Fed’s 2028 convergence date.
If that ten-year pattern holds, you are only halfway through this inflationary regime. That is not an abstract point; it means aligning your fixed income strategy to survive elevated yields well into the early 2030s rather than betting on an imminent return to cheap money.
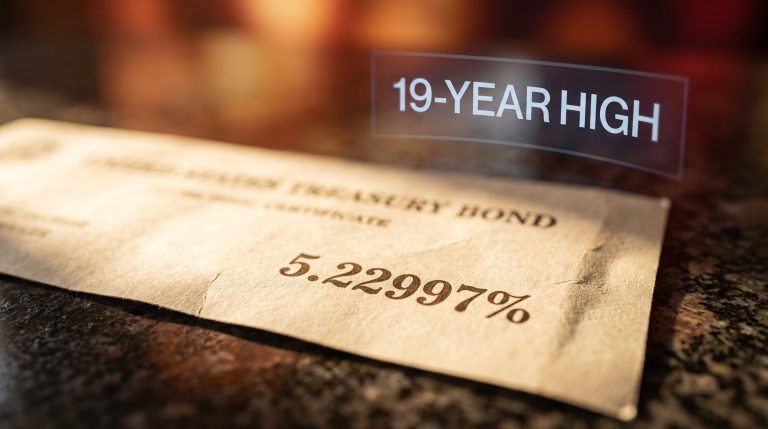
The yield picture reinforces the warning. When oil last sat near $100 in April, the 10-year Treasury yield was around 4.40% to 4.50%. By late September 2026, with oil at similar levels, the 10-year had pushed past 5.20%.
That disconnect tells you something important: energy prices alone are not driving yields. Persistent inflation, strong growth, and deficit concerns are pushing them independently, which means even a full resolution of Middle East tensions is unlikely to drag yields back to the low 4% range.
Two scenarios could still break the structural thesis:
- Severe demand destruction, where restrictive policy slows the economy so sharply that inflation collapses through a deflationary bust rather than an orderly glide down.
- AI-driven services disinflation in the 2030s, a plausible offset that Bianco identifies as a reason longer-dated breakevens point lower, though it belongs to the next decade rather than this one.
Navigating a landscape of permanent price floors
The through-line across all four signals is consistent. The loss of cheap Chinese goods reset the baseline, the Fed’s own revisions keep chasing reality upward, contested shipping lanes have loaded a permanent premium into energy, and the bond market is pricing yields that oil alone cannot explain.
The common thread is that a world fragmenting out of globalisation builds price floors, and price floors are not something monetary policy can tear down on its own. The Fed can slow demand, but it cannot rebuild the deflationary supply chains that made the last two decades so cheap.
For your framework, that shifts the priority. In an environment of permanent price floors, the companies worth owning are those with genuine pricing power, the ability to pass rising costs forward without losing customers, rather than those that thrived only because their inputs kept getting cheaper.
For investors wanting to translate the structural inflation framework into specific portfolio positions, our dedicated guide to inflation hedge portfolio construction details the layered allocation across dividend equities, real assets, and TIPS that compounds above a persistent 2-3% price floor.
This article is for informational purposes only and should not be considered financial advice. Investors should conduct their own research and consult with financial professionals before making investment decisions. Past performance does not guarantee future results, and financial projections are subject to market conditions and various risk factors.