The Federal Reserve raised rates by 25 basis points on 16 September 2026, and the dollar barely moved. For investors conditioned to expect a policy announcement to jolt currency markets, that non-reaction is itself the signal worth understanding.
The September FOMC decision landed exactly where markets expected, which is precisely why it produced so little immediate turbulence. But the absence of a spot-price reaction does not mean nothing changed underneath it.
What matters now is what the overnight index swap curve and speculative positioning data are pricing into the weeks and months ahead. After reading this, you will understand why tracking the OIS curve rather than the rate announcement itself is the more useful habit for reading USD direction, and what the current forward pricing actually implies.
Why a rate hike that surprises no one moves nothing
Currency markets do not reprice around decisions. They reprice around surprises measured against what was already expected.
By the time the FOMC statement dropped on 16 September 2026, the swap and futures markets had already embedded a 25 basis point move. The dollar’s level going into the meeting already reflected the expected rate differential against the euro, the yen, and other major currencies. There was nothing left to price.
The decision itself checked every box for a fully-anticipated event. The Committee voted 12-0 to lift the target range for the federal funds rate to 3.75-4.00%, with the interest rate on reserve balances set at 3.90% and the primary credit rate at 4.00%, both effective 17 September 2026.
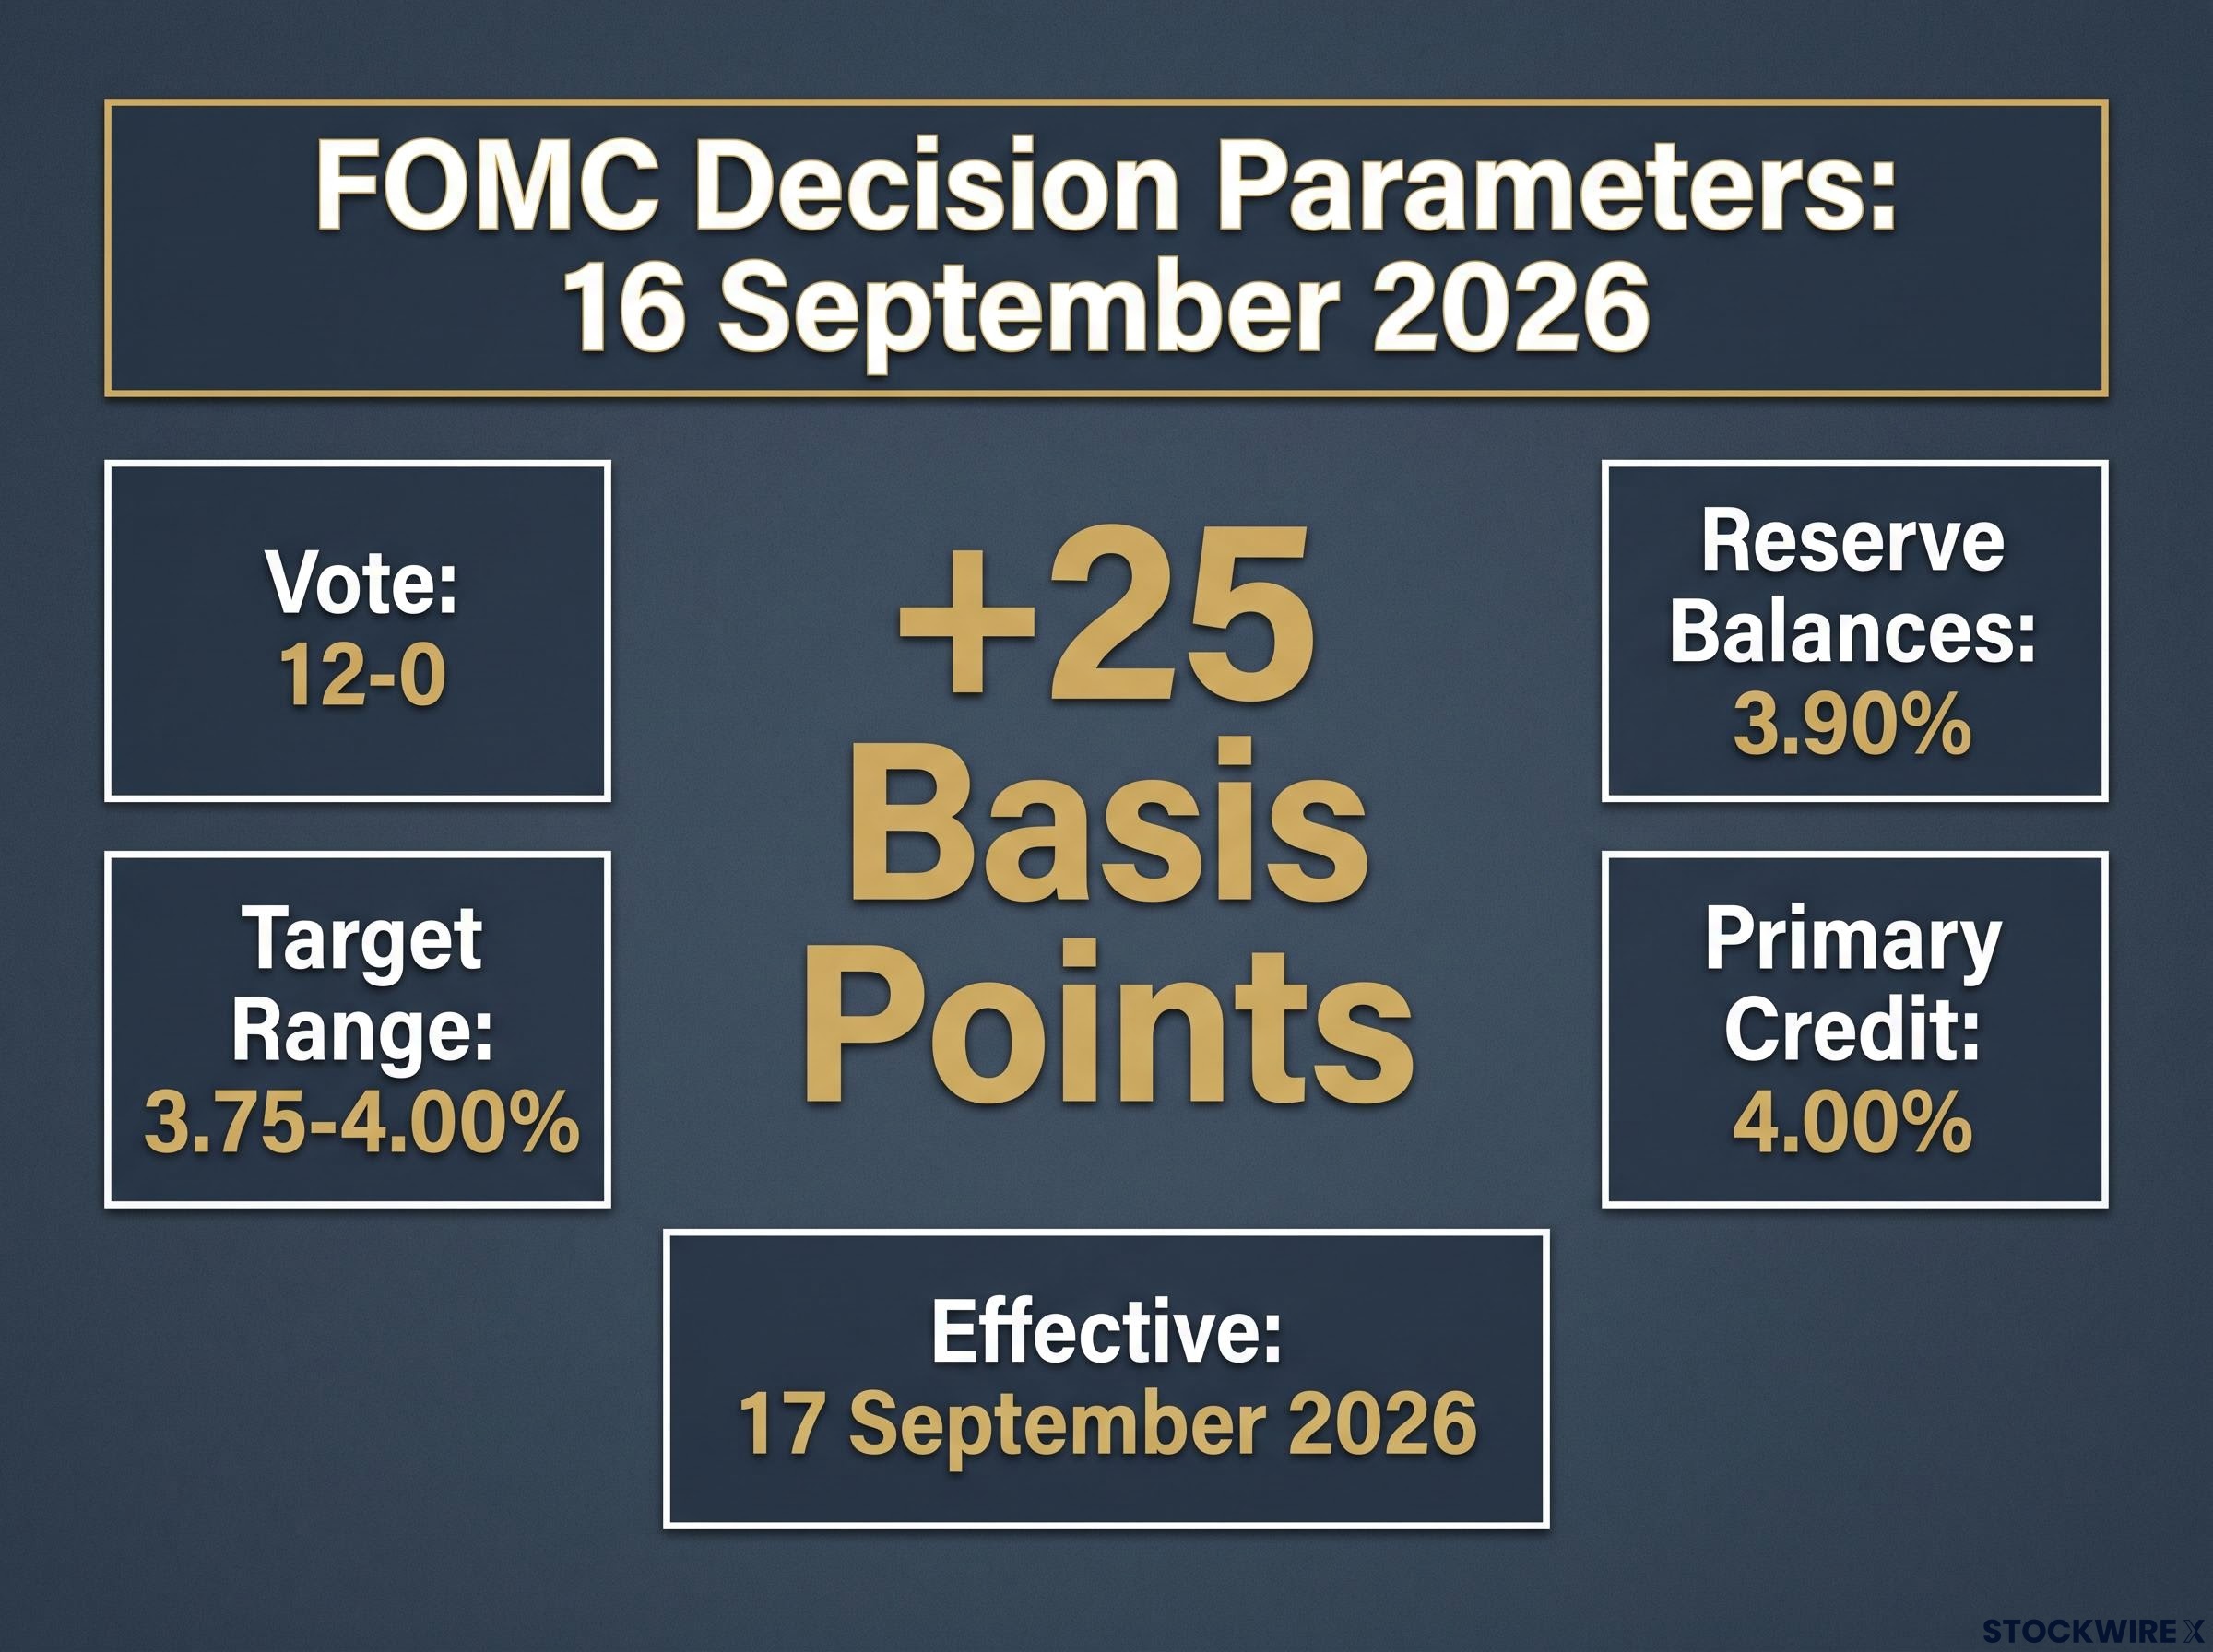
“The Committee decided to raise the target range for the federal funds rate by 1/4 percentage point to 3-3/4 to 4 percent.” Federal Open Market Committee statement, 16 September 2026
A unanimous vote on a widely-telegraphed quarter-point move is about as close to a non-event as monetary policy gets. That tells you the real information content of the meeting was never going to be in the rate number. It was in the forward guidance language, which arrived incremental rather than hawkish.
For the dollar to have jumped, something specific would have needed to break from the script. Consider the four conditions that would have forced a sharp repricing:
- A larger move than expected, such as 50 basis points instead of 25, forcing markets to reset their assumptions about the pace of tightening.
- A projected terminal rate meaningfully above what the swap curve and futures had already implied.
- More aggressive balance-sheet guidance that widened expected rate differentials against other majors.
- Incoming data that forced a rapid repricing of the curve in either direction.
None of those materialised. This is the mechanism worth internalising: a calm post-FOMC market is not evidence that USD direction is range-bound. It is evidence that the move was already in the price. The signal always sits in what was discounted before the announcement, not in what the headline delivered.
When big ASX news breaks, our subscribers know first
What the OIS curve is and why it outranks the announcement
If the rate announcement is the lagging signal, what is the leading one? For institutional FX desks, the answer is the overnight index swap curve.
An overnight index swap (OIS) is a contract in which two parties exchange a fixed interest rate for the average overnight rate realised over a set period. Priced across different horizons, these contracts form a curve, and that curve is a real-time, market-derived reading of where traders collectively expect the Fed’s policy rate to sit over the coming months and years.
That “real-time” quality is what sets it apart from the Fed’s own Summary of Economic Projections, the so-called dot plot. The dot plot captures the individual forecasts of 18 Fed officials, updated once a quarter. The OIS curve reprices continuously, absorbing every inflation print, jobs number, and speech the moment it lands.
The two signals are currently sending readings that look different but are not contradictory. The median SEP projection points to roughly 4.1% by end-2026 and again by end-2027, with 16 of 18 participants expecting at least one more 25 basis point hike this year. The OIS curve, according to Rabobank’s RaboResearch FX strategy team, implies more than three additional Fed hikes through the end of the following year.
The broader context behind the September decision is a Fed communication regime that has been deliberately redesigned under Chair Warsh, with forward guidance formally abandoned and the dot plot’s institutional role under review, a shift that makes the OIS curve a more critical input than at any point in the prior cycle.
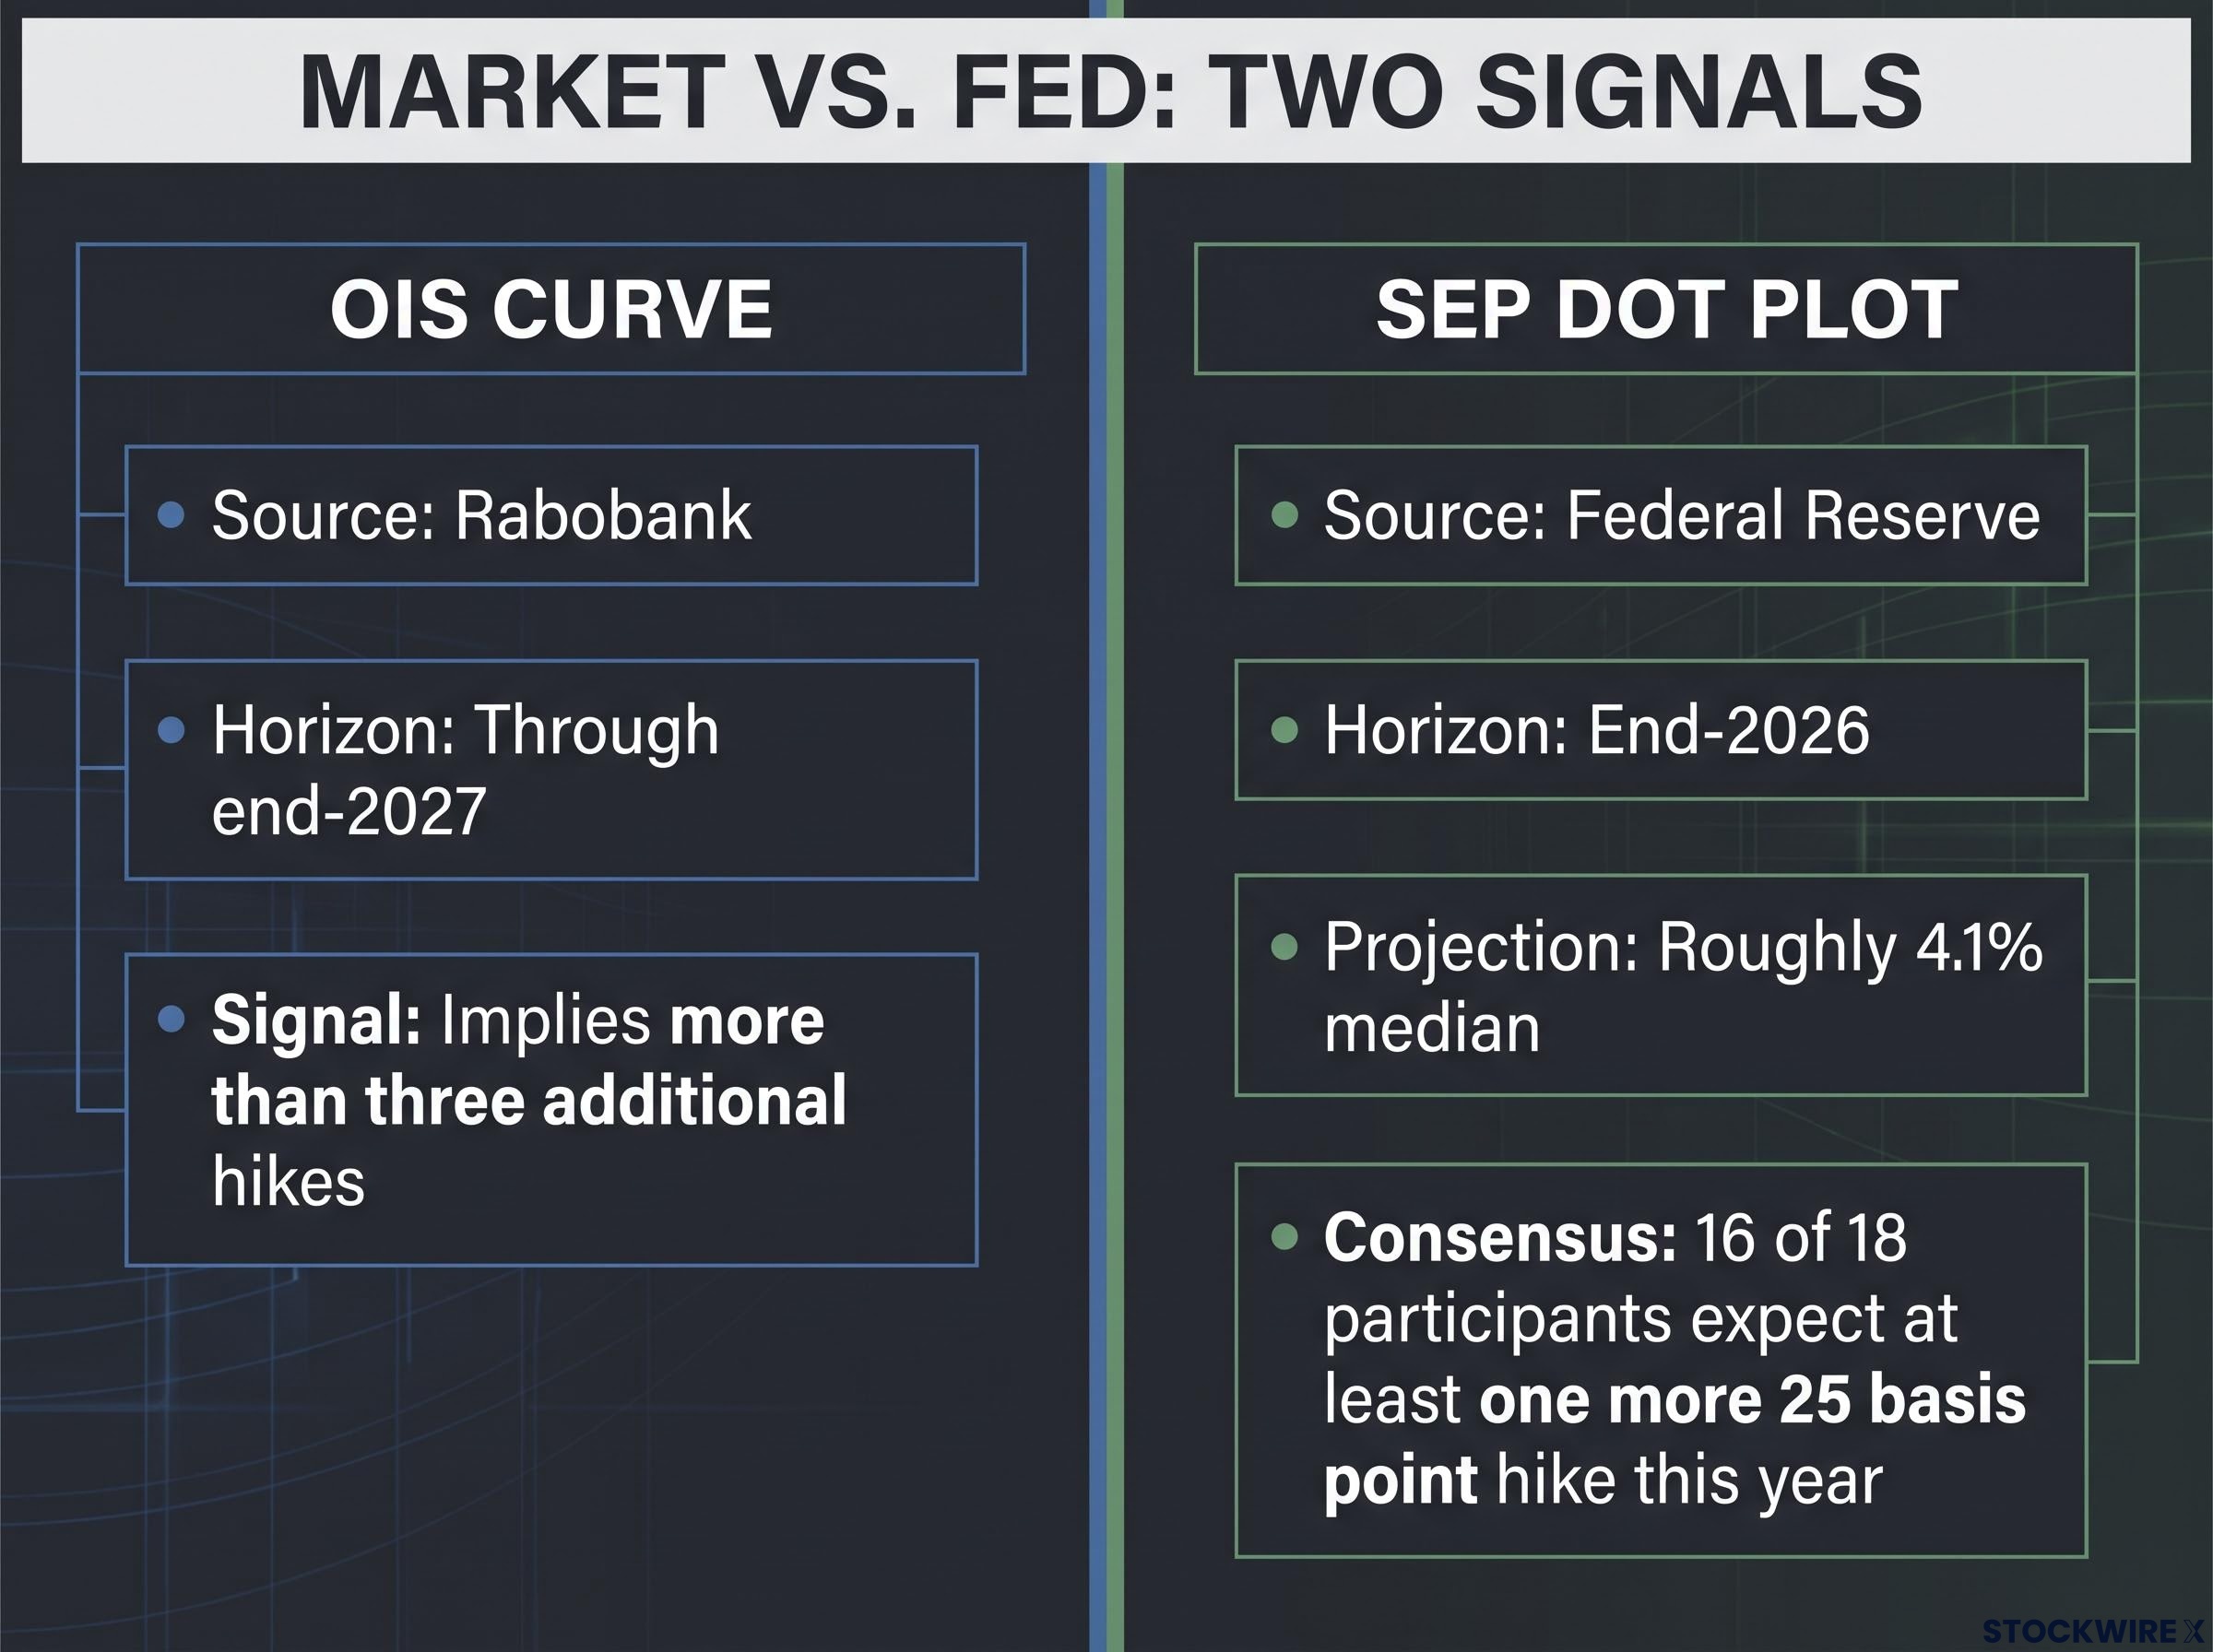
| Signal type | Source | Horizon | Current USD implication |
|---|---|---|---|
| OIS curve | Rabobank | Through end-2027 | More than three additional hikes implied; supportive |
| SEP dot plot | Federal Reserve | End-2026 | One additional hike near-term; supportive |
| CFTC speculative positioning | Rabobank | Late September 2026 | Net long stable, not extreme; constructive |
The practical takeaway is direct: whether the OIS curve is repricing higher or lower in the weeks after a meeting gives you a far more actionable read on USD direction than which way the dollar ticked on announcement day.
How to read the gap between OIS pricing and SEP projections
The tension between more than three implied hikes and a near-term consensus of one is not a genuine conflict. The SEP figure describes the near horizon, through end-2026. The OIS-implied path stretches through end-2027 and embeds additional moves in the outer part of the curve. They are measuring different windows.
What matters more than either point estimate is the direction each one travels next. If incoming inflation or labour data push either signal to reprice higher, USD support strengthens. If they reprice lower, the bullish case weakens. Watch the revision, not the level.
What the forward path actually signals for the dollar
Apply that lens to positioning, and the picture becomes constructive without being decisive.
CFTC speculative data, as detailed by Rabobank, shows both sides of the trade nudging up in late September. Long USD contracts rose by roughly 2,000, and short contracts rose by roughly 2,000 as well, leaving net long exposure broadly unchanged.
The CFTC Commitments of Traders report is the primary source for the speculative positioning data that analysts including Rabobank reference when tracking net long and short currency futures exposure, published weekly and disaggregated by trader category to distinguish commercial hedgers from non-commercial speculators.
Stability on both sides is telling. It signals a market that believes the tightening path continues, but is not yet willing to crowd aggressively into directional bets. Institutional money has not abandoned the USD bull thesis, but neither has it committed hard enough to build meaningful reversal risk.
The logic connecting that positioning to the rate path runs through carry. A Fed holding near 4.00-4.25% while the European Central Bank and Bank of England plateau or ease keeps US rate differentials wide, and wide differentials support the dollar in carry strategies where investors borrow in low-yielding currencies to hold higher-yielding ones.
Carry trade dynamics across USD pairs do not respond symmetrically to rate differentials: funding currencies with low volatility profiles, such as the Canadian dollar in the current cycle, can absorb sizeable differential advantages without the mechanical carry compression that would ordinarily follow a Fed near its peak.
“September Rate Hike: Not a One and Done” The Conference Board, September 2026
That framing captures the prevailing institutional read. JPMorgan notes that Fed officials signalled one more hike in 2026 after the September move, and Schwab characterises the decision as the Fed’s first hike since 2023, arriving in a more mature phase of the cycle where further moves are incremental and data-dependent.
Three historical cycles where the OIS curve and the dollar parted ways
The signals are useful, but history warns against treating them as guarantees.
In the mid-2010s liftoff, swap markets priced a gradual path and speculative positioning turned heavily long USD. When the actual trajectory proved shallower than expected, over-extended longs blunted the dollar’s momentum and the trend flattened into a range.
The 2018 late-cycle tightening showed a different override. Rate support initially lifted the dollar alongside rising yields, but as global growth fears mounted, markets began pricing fewer hikes and the growth-slowdown narrative overwhelmed the rate signal.
The 2021-2023 post-COVID cycle sharpened the core lesson. Through that period, the direction in which OIS curves repriced their terminal rate, rather than the level itself, drove currency moves, with sharp corrections whenever inflation surprised lower or communication softened.
Treat these as pattern-recognition tools, not forecasts. Your task as new data arrives is to identify which precedent the current environment most resembles.
Five conditions that could break the rate-dollar relationship
None of the following has materialised as of late September 2026, which is exactly why positioning is stable rather than defensive. But all five are live, and each functions as a threshold: if the trigger fires, here is the mechanism by which USD support erodes.
Dollar-yield divergence episodes, where the USD weakens despite recovering Treasury yields, have appeared twice in the weeks surrounding the September meeting, driven partly by the Treasury’s expanded buyback programme compressing long-end yields independently of Fed rate decisions.
- Recession or sharp US growth slowdown. If tighter policy tips the economy toward contraction, markets would rapidly reprice the rate path lower, undercutting the differential support that holds the dollar up. Watch for the OIS curve to shift lower across the front end.
- Disinflation or downside inflation surprise. A faster-than-expected drop in inflation would remove the case for further hikes and raise the odds of earlier cuts, compressing the yield gap behind USD carry. Watch the curve pull forward its first implied cut.
- ECB and BoE policy convergence. If other major central banks keep tightening or resist easing while the Fed nears its peak, rate differentials narrow and the dollar’s relative appeal in carry and reserve allocation fades. Watch for the US-implied path to flatten relative to peers.
- Crowded positioning reversal. Current longs sit stable but not extreme, per Rabobank. Should positioning skew heavily toward a strong-dollar narrative, the trade becomes vulnerable to sharp reversals on any disappointment. Watch for net longs climbing toward crowding thresholds.
- Fed communication shift. A pivot toward emphasising downside growth risk or a symmetrical inflation framing could lead markets to reinterpret the same rate path as less bullish for USD. Watch the curve reprice lower even without a data change.
Here is the connective thread. If any of these begins to bite, the first place it surfaces is the OIS curve repricing lower, well before it shows up in spot positioning or price. The curve is your early-warning monitor, not the headline.
Reading the dollar through the next phase of the cycle
Pull the four layers together and a monitoring framework emerges. The announcement-day non-reaction confirmed the hike was fully priced. The OIS curve through end-2027 implies further tightening beyond the near-term SEP consensus of one more hike. Speculative positioning is constructive but not crowded. And five structural conditions could reverse the rate-dollar link if they materialise.
That points to a specific discipline. Watch the direction of the OIS curve rather than the announcement date. Watch whether positioning drifts toward crowding thresholds. Track which of the five risk conditions shows up first in the data.
The direction in which OIS curves reprice over the coming quarters matters more for USD direction than the terminal rate level sitting in today’s projections.
The September hike itself was never the signal. The signal is whether the tightening path the curve currently embeds holds up as new data arrives over the next two quarters. Monitor the right inputs, and you will be better calibrated to the dollar’s next meaningful move than any investor still watching announcement-day price ticks.
For investors who want a parallel framework for distinguishing noise from genuine regime shifts in risk assets, our dedicated guide to reading the VIX futures curve explains how contango and backwardation shapes track stress duration, using the same early-warning logic that applies to OIS curve monitoring.
This article is for informational purposes only and should not be considered financial advice. Investors should conduct their own research and consult with financial professionals before making investment decisions. Past performance does not guarantee future results. Financial projections are subject to market conditions and various risk factors.