
Everyone spent the summer of 2026 waiting for the refinancing boom that never came. Analysts sketched it out in detail: bond yields would fall, the 30-year mortgage would drift back toward 5 percent, and millions of locked-in homeowners would finally get to tap their equity again.
Instead, the opposite happened. As of 24 September 2026, the average 30-year conforming mortgage rate sits at 7.37 percent, according to Mortgage News Daily’s daily rate index, pushed there by a violent selloff in global bond markets.
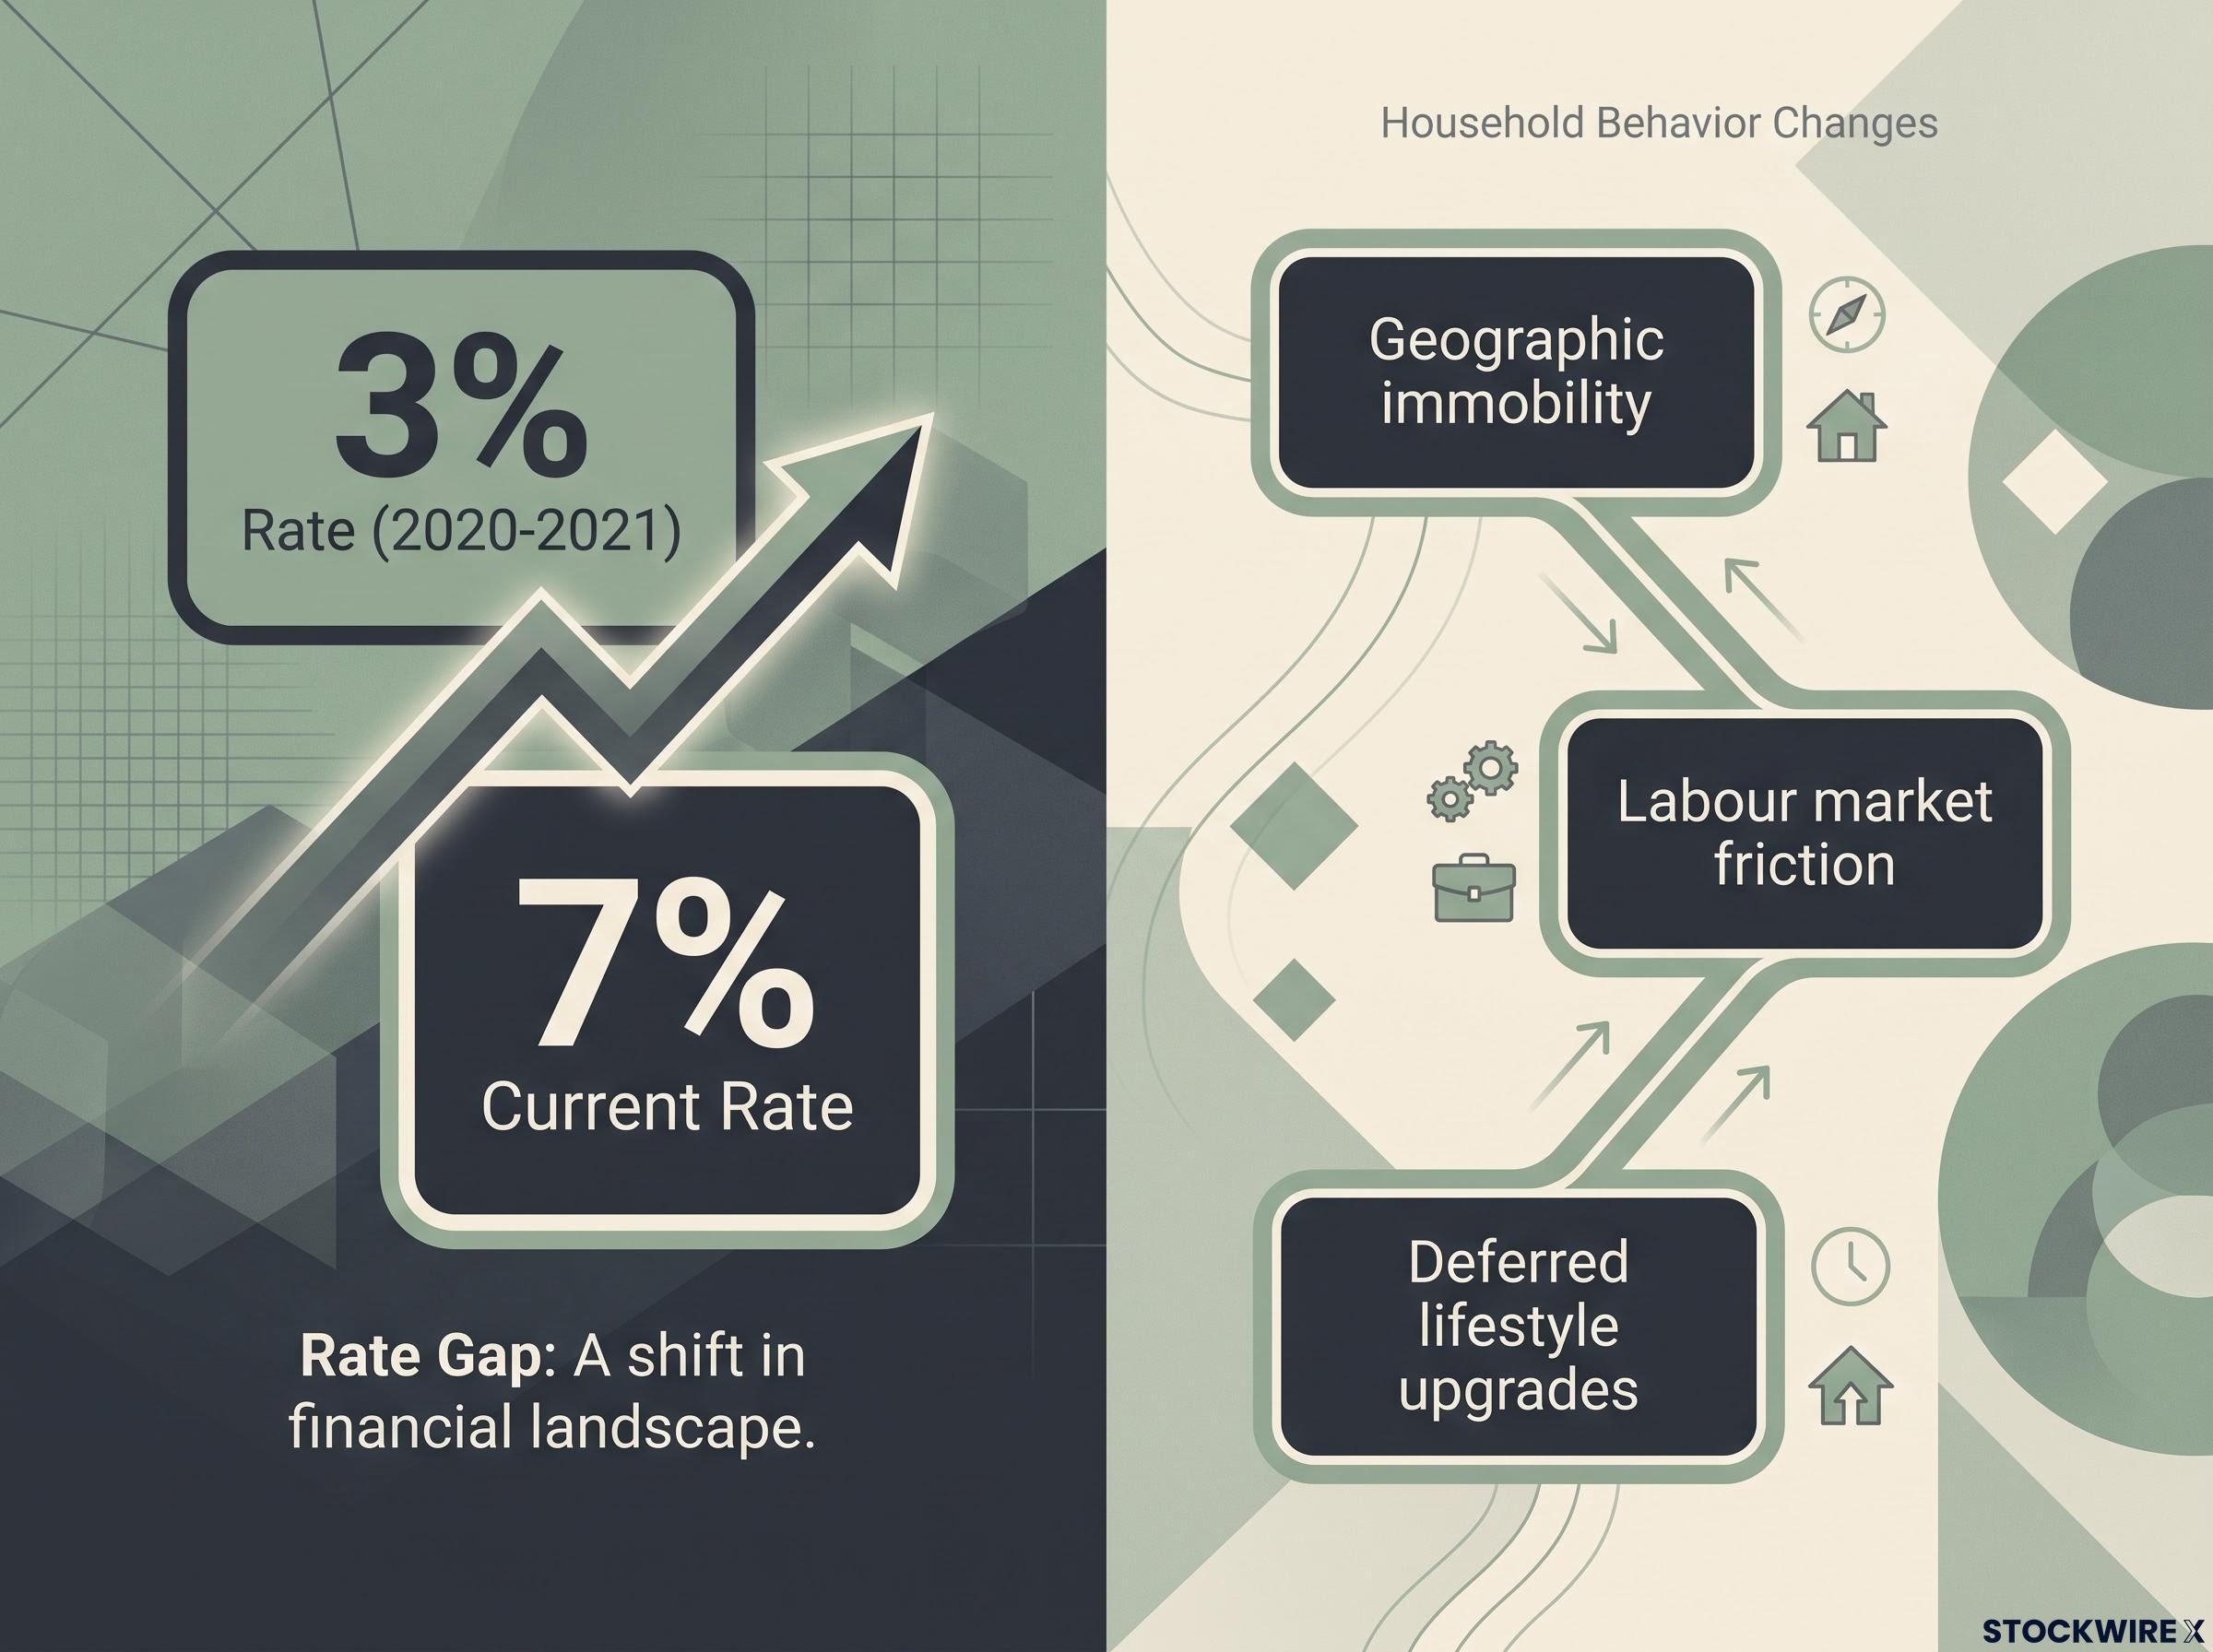
The immediate casualty is the home equity channel. Millions of households who locked in rates near 3 percent during 2020 and 2021 are now completely shut out of refinancing, because doing so would mean surrendering a cheap loan for one costing more than double the interest. No renovation cash-outs. No debt consolidation. No borrowing against the house for a big discretionary purchase.
Understanding how global bond yields dictate your housing options is now essential household planning, not abstract macroeconomics. Here is the framework for what killed the refinancing boom, and what that means for your money through 2027.
The return of the 7 percent mortgage and the global bond selloff
The 30-year conforming rate did not drift back above 7 percent. It jumped. The reading on 23 September 2026 was 7.26 percent, and a single session later it stood at 7.37 percent, wiping out the analyst forecasts that had assumed a bond rally was coming.
Mortgage News Daily’s daily rate index tracks conforming 30-year fixed rates using real-time lender pricing data, making it the benchmark tracker most widely cited by housing economists and loan officers monitoring daily market movements.
This is not a domestic story. Long-duration government debt is selling off across the developed world, and US mortgages are caught in the current.
Ten-year US Treasury notes have pushed above 5 percent, trading near the 5.10 to 5.15 percent range, with the 30-year Treasury yield reaching roughly 5.38 percent. Japanese 10-year government bond yields have climbed toward approximately 308 basis points, a steep move that signals the stress is global rather than a quirk of US policy.
Here is how the picture looks across major benchmarks.
| Benchmark | Approximate Yield | Significance |
|---|---|---|
| US 10-Year Treasury | ~5.10-5.15% | Primary benchmark for 30-year mortgage pricing |
| US 30-Year Treasury | ~5.38% | Reflects long-duration repricing |
| Japanese 10-Year JGB | ~308 bps | Signals global scale of fixed income stress |
The speed of the move matters more than the level. When long-duration yields reprice this sharply and this globally, it tells you borrowing costs are shifting structurally upward, not wobbling temporarily.
The Q4 read Jeff Weniger, Chief Investment Strategist at Corgi Invest, has described bond market turbulence as the central focus for market participants heading into the fourth quarter of 2026, having added long-duration bond positions across two consecutive sessions of selling.
For your household budget, the lesson is uncomfortable but clear. Betting on a quick return to cheap money is looking increasingly risky, and you are better off calibrating for a prolonged high-rate reality.
When big ASX news breaks, our subscribers know first
Understanding how mortgages are actually priced
The rate on your screen looks like a single number, but it is built from two moving parts, and knowing both changes how you read the market.
The first surprise for most borrowers: 30-year mortgages are not benchmarked to 30-year Treasury bonds. They track the 10-year Treasury note instead.
The mortgage rate pricing mechanics connecting Treasury yields to consumer loan costs are more precise than most borrowers realise: a half-point rise in the 10-year yield adds roughly $134 per month on a $400,000 loan, and tracking the FRED DGS10 data series gives you a leading signal that updates faster than any weekly mortgage rate survey.
The reason is prepayment. The average 30-year mortgage is paid off long before its full term, through selling, refinancing, or moving, which makes its effective life closer to a decade than three. Less than 10 percent of 30-year mortgages are actually held to maturity, and lenders typically bundle and sell these loans rather than keep them, so the 10-year yield is the honest duration reference.
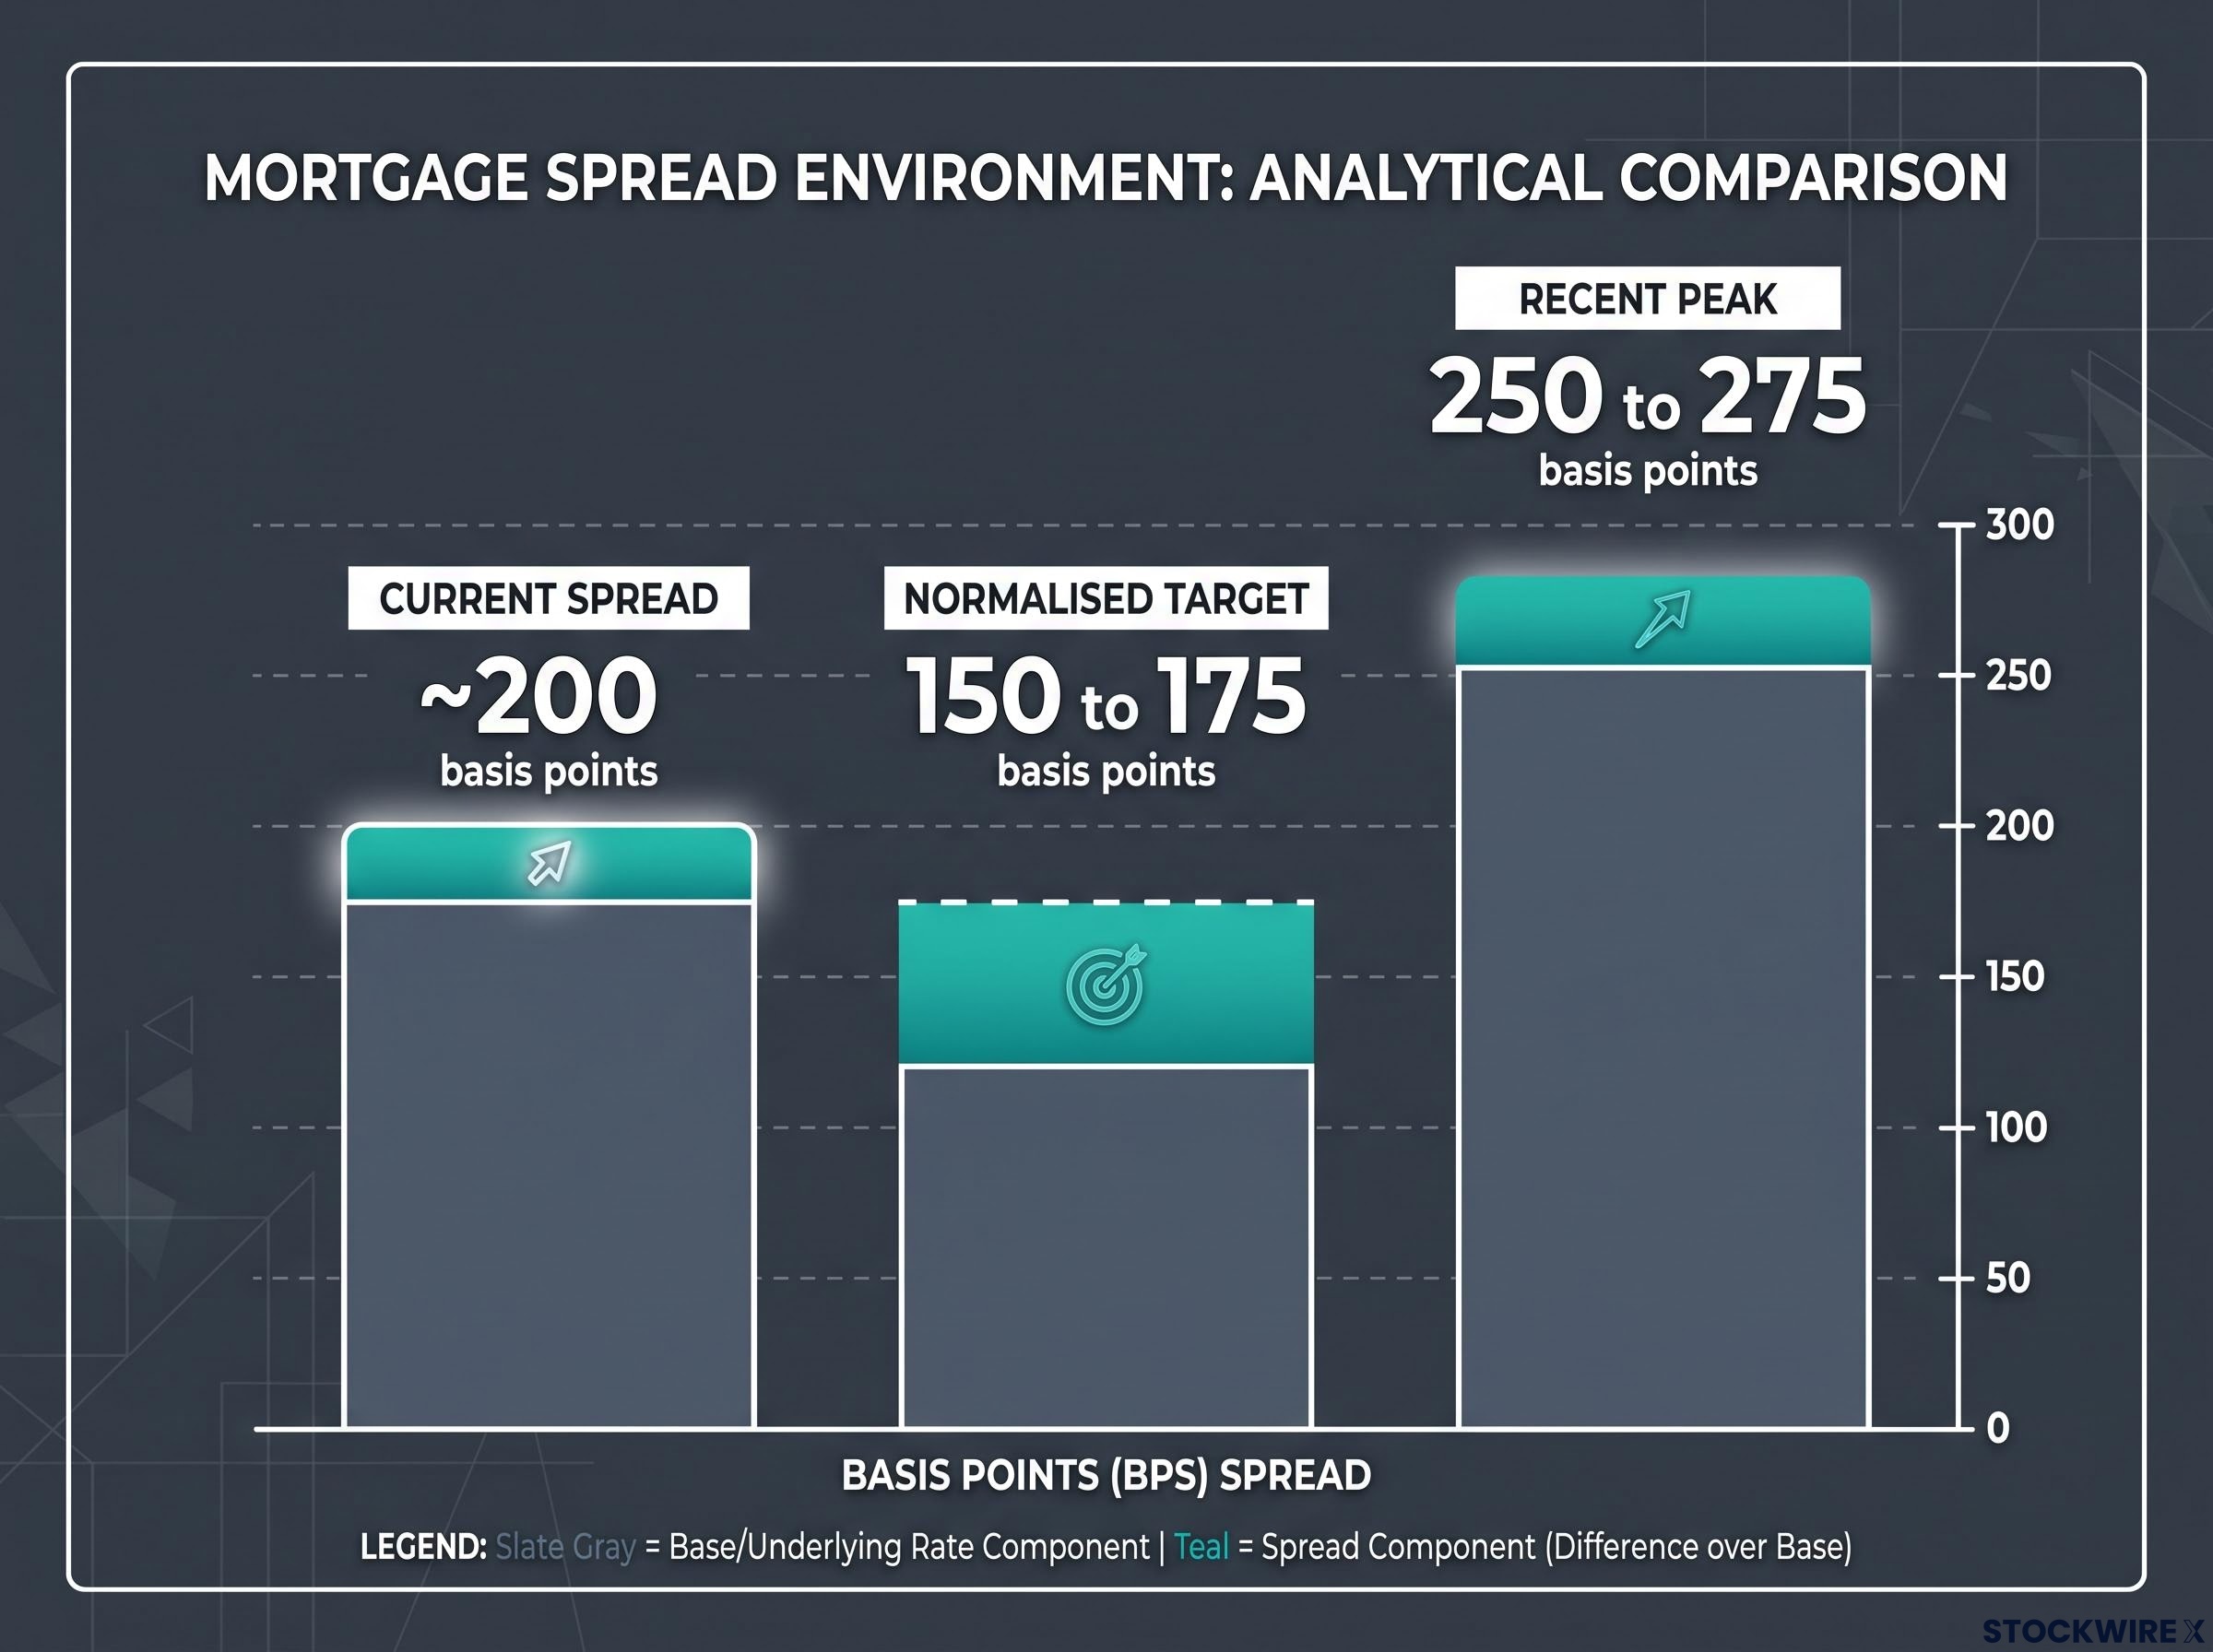
The second part is the spread, the extra yield stacked on top of the Treasury benchmark. Right now that spread sits at approximately 200 basis points over the 10-year note, well above the normalised target of 150 to 175 basis points but below the recent peak of 250 to 275 basis points.
Knowing your rate is inflated by a wide spread, not just the base yield, is genuinely useful. It means rates could eventually ease even if the broader economy runs hot, provided market volatility settles and the spread compresses.
The role of the Fed and quantitative tightening
Three forces are keeping that spread abnormally wide.
- Prepayment and extension risk on mortgage-backed securities (MBS): these are bundles of home loans sold to investors. When rates are volatile, prepayment behaviour becomes unpredictable, so investors demand a larger risk premium to hold them. Urban Institute commentary has repeatedly flagged elevated option-adjusted spreads on agency MBS as a core driver.
- Federal Reserve quantitative tightening (QT): the Fed built a huge stockpile of MBS during earlier stimulus, and since 2022 has let those holdings run off without reinvestment. Fannie Mae’s research group argues that removing this price-insensitive buyer has structurally weakened demand and widened spreads.
- Reduced bank demand: post-2023 regional bank stress and tighter capital rules have made banks warier of holding long-duration MBS, further thinning demand.
The Fed MBS portfolio, sitting at approximately $1.93 trillion with a weighted average life of roughly 8.8 years, is itself one reason the wide spread persists: removing the Fed as a price-insensitive buyer has structurally weakened demand for agency mortgage-backed securities, and active sales are not viable because they would crystallise hundreds of billions in unrealised losses.
The anatomy of the 200 basis point spread
The gap between the 10-year Treasury and your consumer mortgage rate is where the disagreement among economists lives.
The gradual-normalisation camp, including Fannie Mae and Freddie Mac, expects spreads to narrow slowly as rate volatility falls and MBS supply becomes more predictable, drifting back toward the 150 to 175 basis point range but staying somewhat wider than the 2010s.
The persistent-wideness camp, associated with some Urban Institute researchers, argues that a smaller Fed footprint and more volatile inflation will keep spreads structurally elevated for years. In their view, even falling yields will not translate into proportionate relief for borrowers.
The golden handcuffs trapping the 2020-2021 cohort
The mechanics explain why rates are high. The human cost shows up the moment a locked-in homeowner tries to move.
Consider trading a 3 percent mortgage for a 7 percent one on the exact same house. The property has not changed, but the monthly payment climbs sharply, meaning many homeowners face a large increase in cost just to end up in the same or a smaller home.
The true lifetime cost of a rate increase is rarely felt until the numbers are laid side by side: on a $300,000 loan, moving from a 3.9 percent rate to a 7.0 percent rate adds more than $200,000 in total interest over the loan term, a figure that dwarfs most households’ annual discretionary budgets.
That penalty is why so many households simply stay put. A large cohort locked in rates at or below 3.5 percent during 2020 and 2021, and for them, moving means voluntarily doubling their interest cost.
If you hold one of these sub-4 percent mortgages, your low rate has quietly become a valuable but illiquid asset, one that increasingly dictates your career and lifestyle choices rather than sitting quietly in the background.
The lock-in reshapes household behaviour in three distinct ways.
- Geographic immobility: homeowners become reluctant to relocate, because a move surrenders the favourable rate. Data from Zillow and Redfin show existing-home listings sitting far below typical levels for this stage of the cycle.
- Labour market friction: Federal Reserve research suggests locked-in owners may turn down distant job offers or favour remote work to avoid moving, modestly reducing how freely workers reallocate across regions.
- Deferred lifestyle upgrades: the family that would normally trade up for more space stays where it is, freezing a chain of transactions that would otherwise unlock inventory.
History offers a sobering parallel. In the early 1980s, mortgage rates above 15 percent locked owners in place for years, and the logjam only cleared once rates fell meaningfully relative to existing coupons. Severe rate-lock can persist for a long time, which is precisely why inventory stays painfully tight and pricing power shifts toward home builders offering new construction.
What the refinancing logjam means for consumer wallets through 2027
The trapped-homeowner story is not just a housing problem. It reaches directly into how much money households have available to spend.
For years, refinancing and cash-out borrowing served as a channel to pull equity out of a home cheaply, funding renovations, car purchases, and debt consolidation. With refis frozen at current rates, that channel has effectively been severed.
The practical consequence for you is straightforward. The era of treating your home as a cheap source of borrowing is over, at least for now, and large purchases will need to come from wage growth and savings rather than home equity.
The battle between wage growth and borrowing costs
Two competing frameworks explain how much this actually hurts.
The manageable-drag camp points to the labour market. The Atlanta Fed Wage Growth Tracker shows wages running ahead of inflation, headline unemployment holding steady near the 4 percent range, and S&P Global’s composite PMI sitting near 56, indicating strong underlying activity. In this view, income drives spending, and existing homeowners with cheap locked-in loans have low debt-service costs, so the refi freeze is a sector-specific headwind rather than a broad retrenchment.
The structural-drag camp counters that the loss of cheap home equity is hard to replace. Households now face expensive credit card and personal loan rates if they want to fund big-ticket items, and even strong wages struggle to offset both higher borrowing costs and a psychological reluctance to take on visible high-rate debt.
There is also a regional dimension. Moody’s Analytics warns that suppressed housing turnover drags down all the spending that travels with it, furnishings, moving services, renovations, creating concentrated headwinds in economies heavily dependent on real estate activity.
The realistic outlook, with 2027 as the assessment horizon, is a multi-year drag concentrated in interest-sensitive sectors rather than a broad collapse.
This article is for informational purposes only and should not be considered financial advice. Investors should conduct their own research and consult with financial professionals before making investment decisions. Past performance does not guarantee future results, and these statements are speculative and subject to change based on market developments.
Navigating a multi-year period of constrained mobility
The path from a global bond selloff to your kitchen renovation is shorter than it looks. Rising long-duration yields worldwide push US Treasury benchmarks higher, a wide 200 basis point spread stacks on top, and the result is a 7-plus percent mortgage that locks millions in place and drains the home equity channel dry.
The historical record is unambiguous on one point: waiting for a rapid snap back to 3 percent rates is not a strategy the past supports. Rate-lock episodes tend to persist for years, clearing only when rates fall meaningfully relative to existing coupons.
The sensible planning assumption for the medium term is that 7 percent rates and wide spreads are a persistent reality through 2027, not a temporary detour.
For readers weighing what to do with surplus cash now that refinancing is off the table, our dedicated guide to the invest-versus-prepay decision covers how your tax bracket, liquidity needs, and behavioural risk profile change the right answer at current 7 percent rates.
That reframes how to approach the big decisions. Evaluate a job move, a growing family, or a needed upgrade on the basis of genuine necessity and life stage, rather than holding your life in a holding pattern while waiting for optimal borrowing conditions that may take years to arrive.