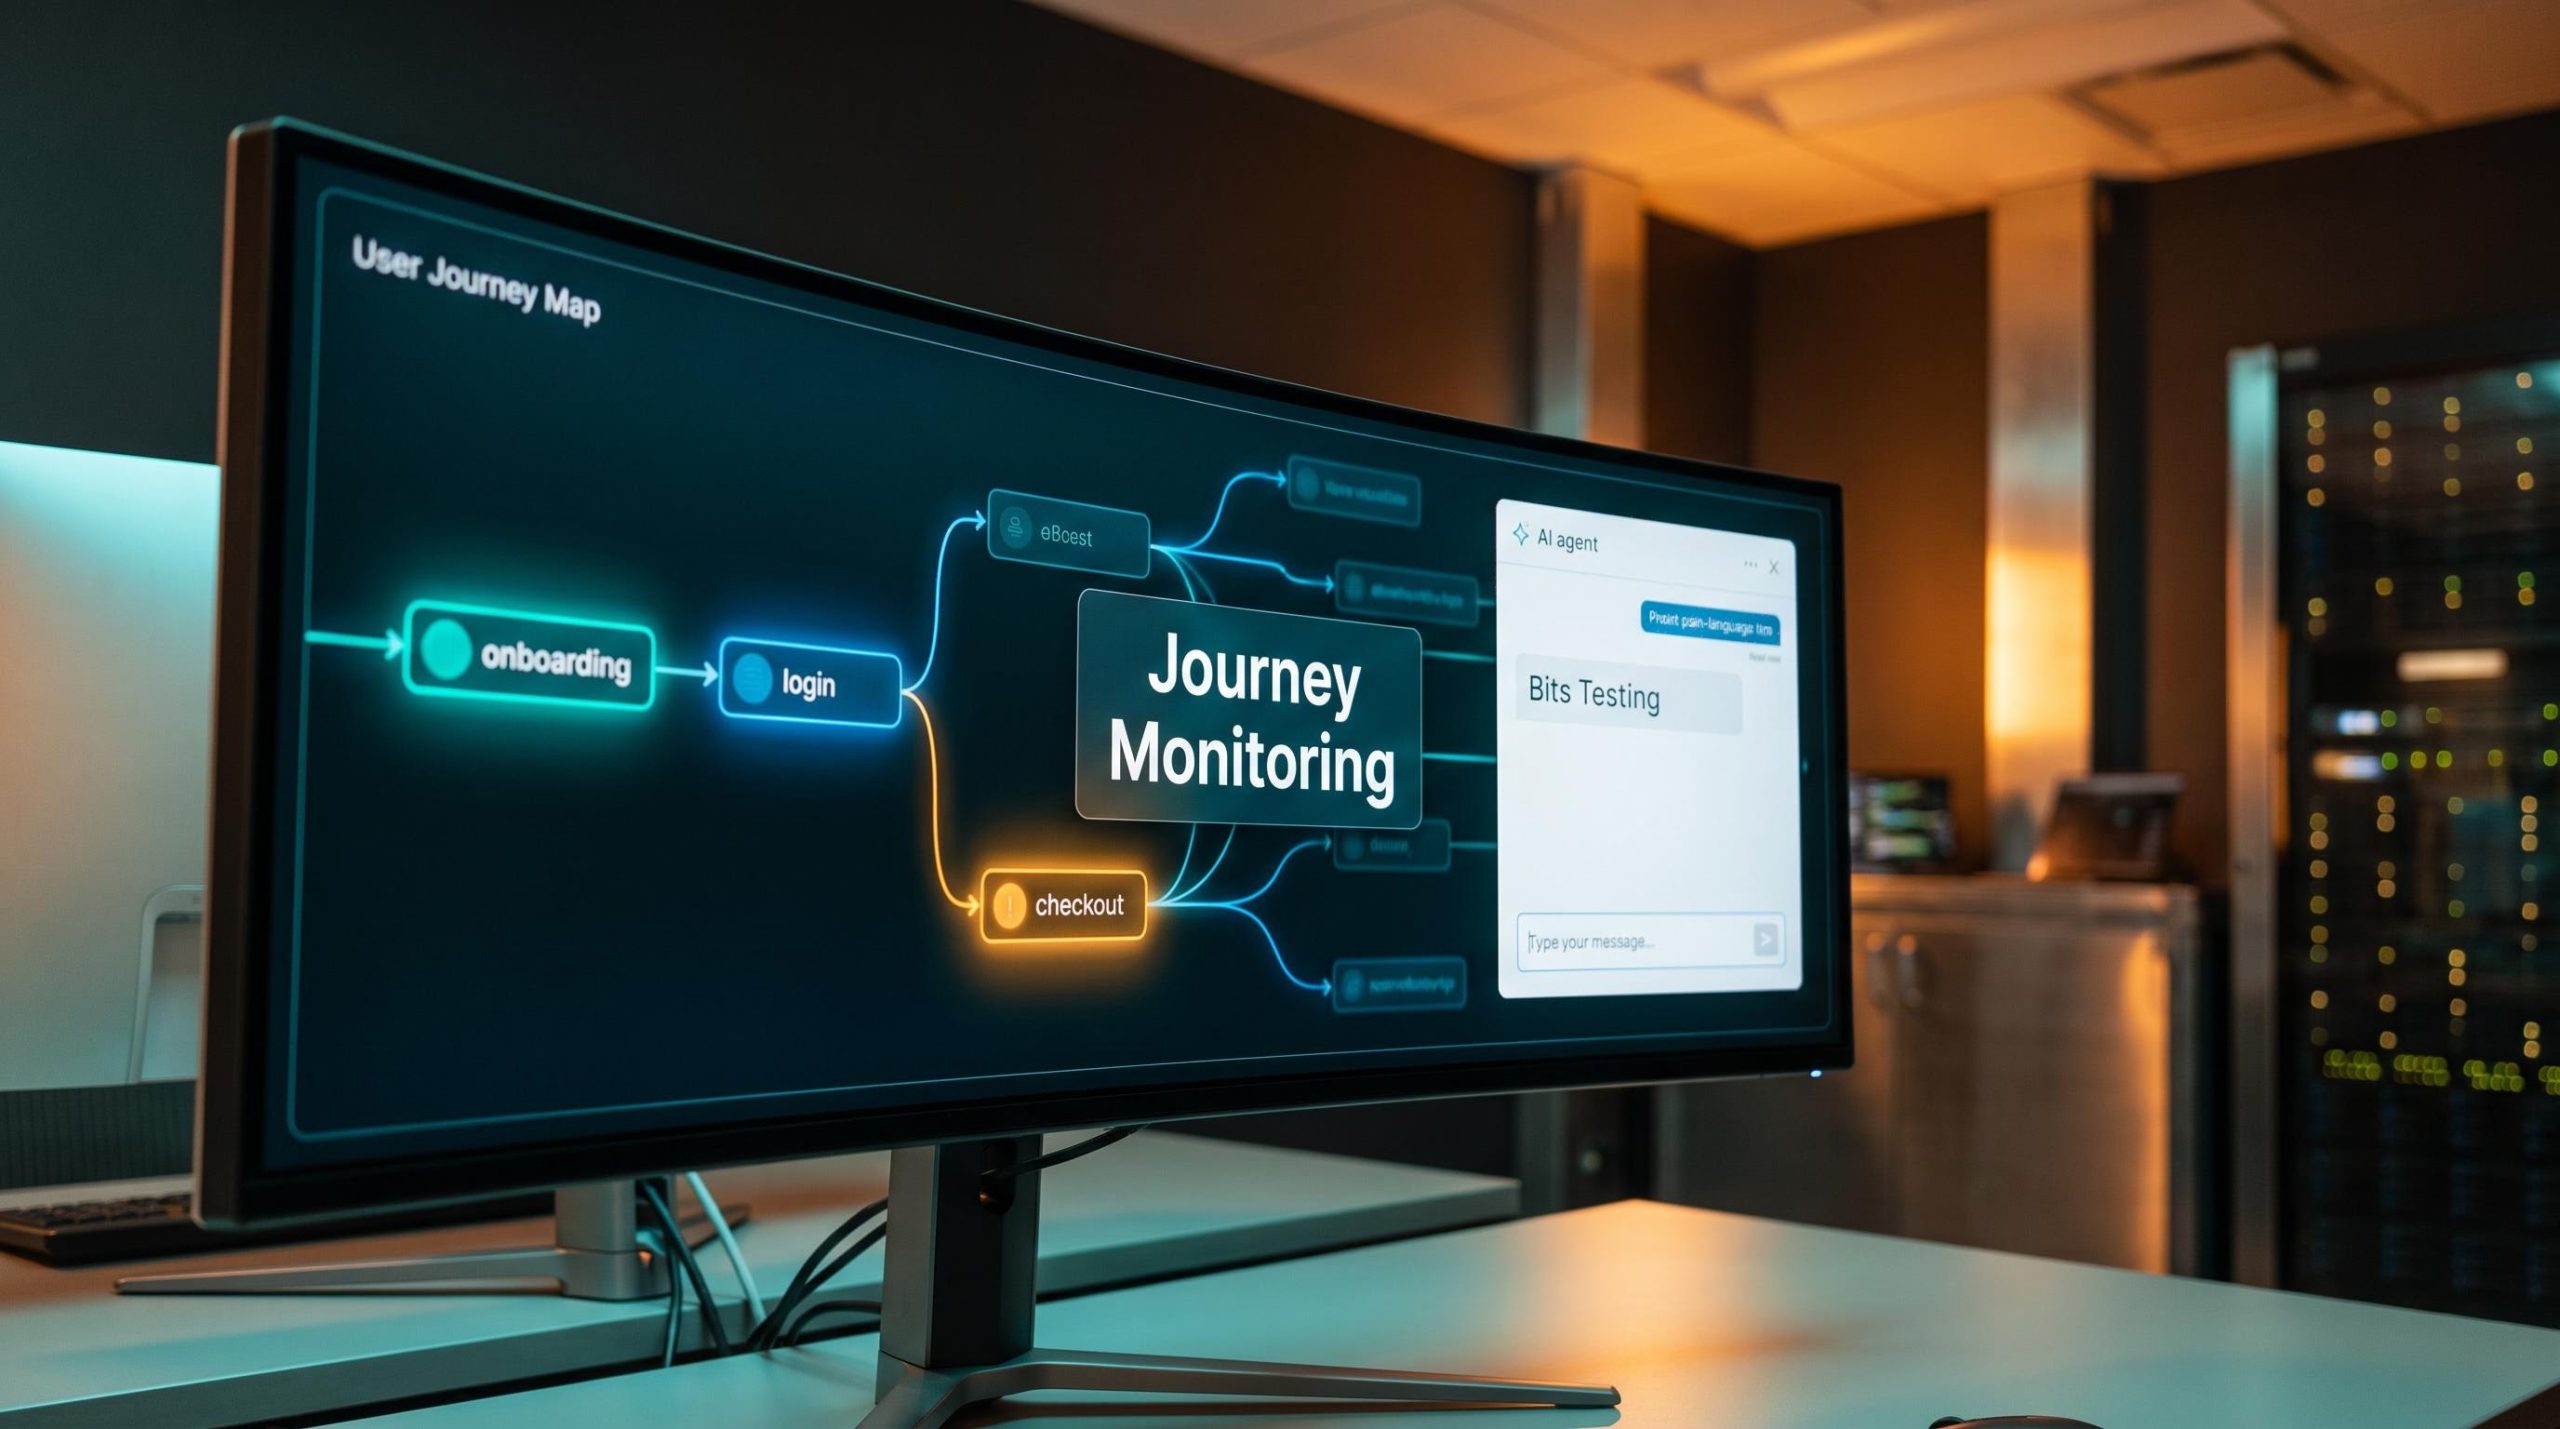
Engineering teams ship updates every day, sometimes many times a day. Yet most have no single signal telling them whether a checkout, login, or onboarding flow still works end-to-end for the people actually using it.
Datadog is naming that gap directly. At its DASH 2026 conference on 24 September 2026, the company introduced two new capabilities, Journey Monitoring and Bits Testing, as additions to its Digital Experience Monitoring (DEM) suite. Both are currently in Preview.
The timing is not incidental. Continuous delivery means the window between a breaking change and a customer-facing failure keeps shrinking, and traditional scripted tests tend to break precisely when release velocity is highest.
What follows here breaks into three parts: what each tool actually does, how they attack different sides of the same problem, and what the shift toward AI-driven goal-based testing means for teams still running manual or scripted synthetic suites. Treat this as practical orientation, not a product pitch.
Two tools, one blind spot: what Datadog actually announced at DASH 2026
Datadog announced both tools at DASH 2026, with coverage and official materials dated 23-24 September 2026. The two are separate capabilities, but they are not separate ideas.
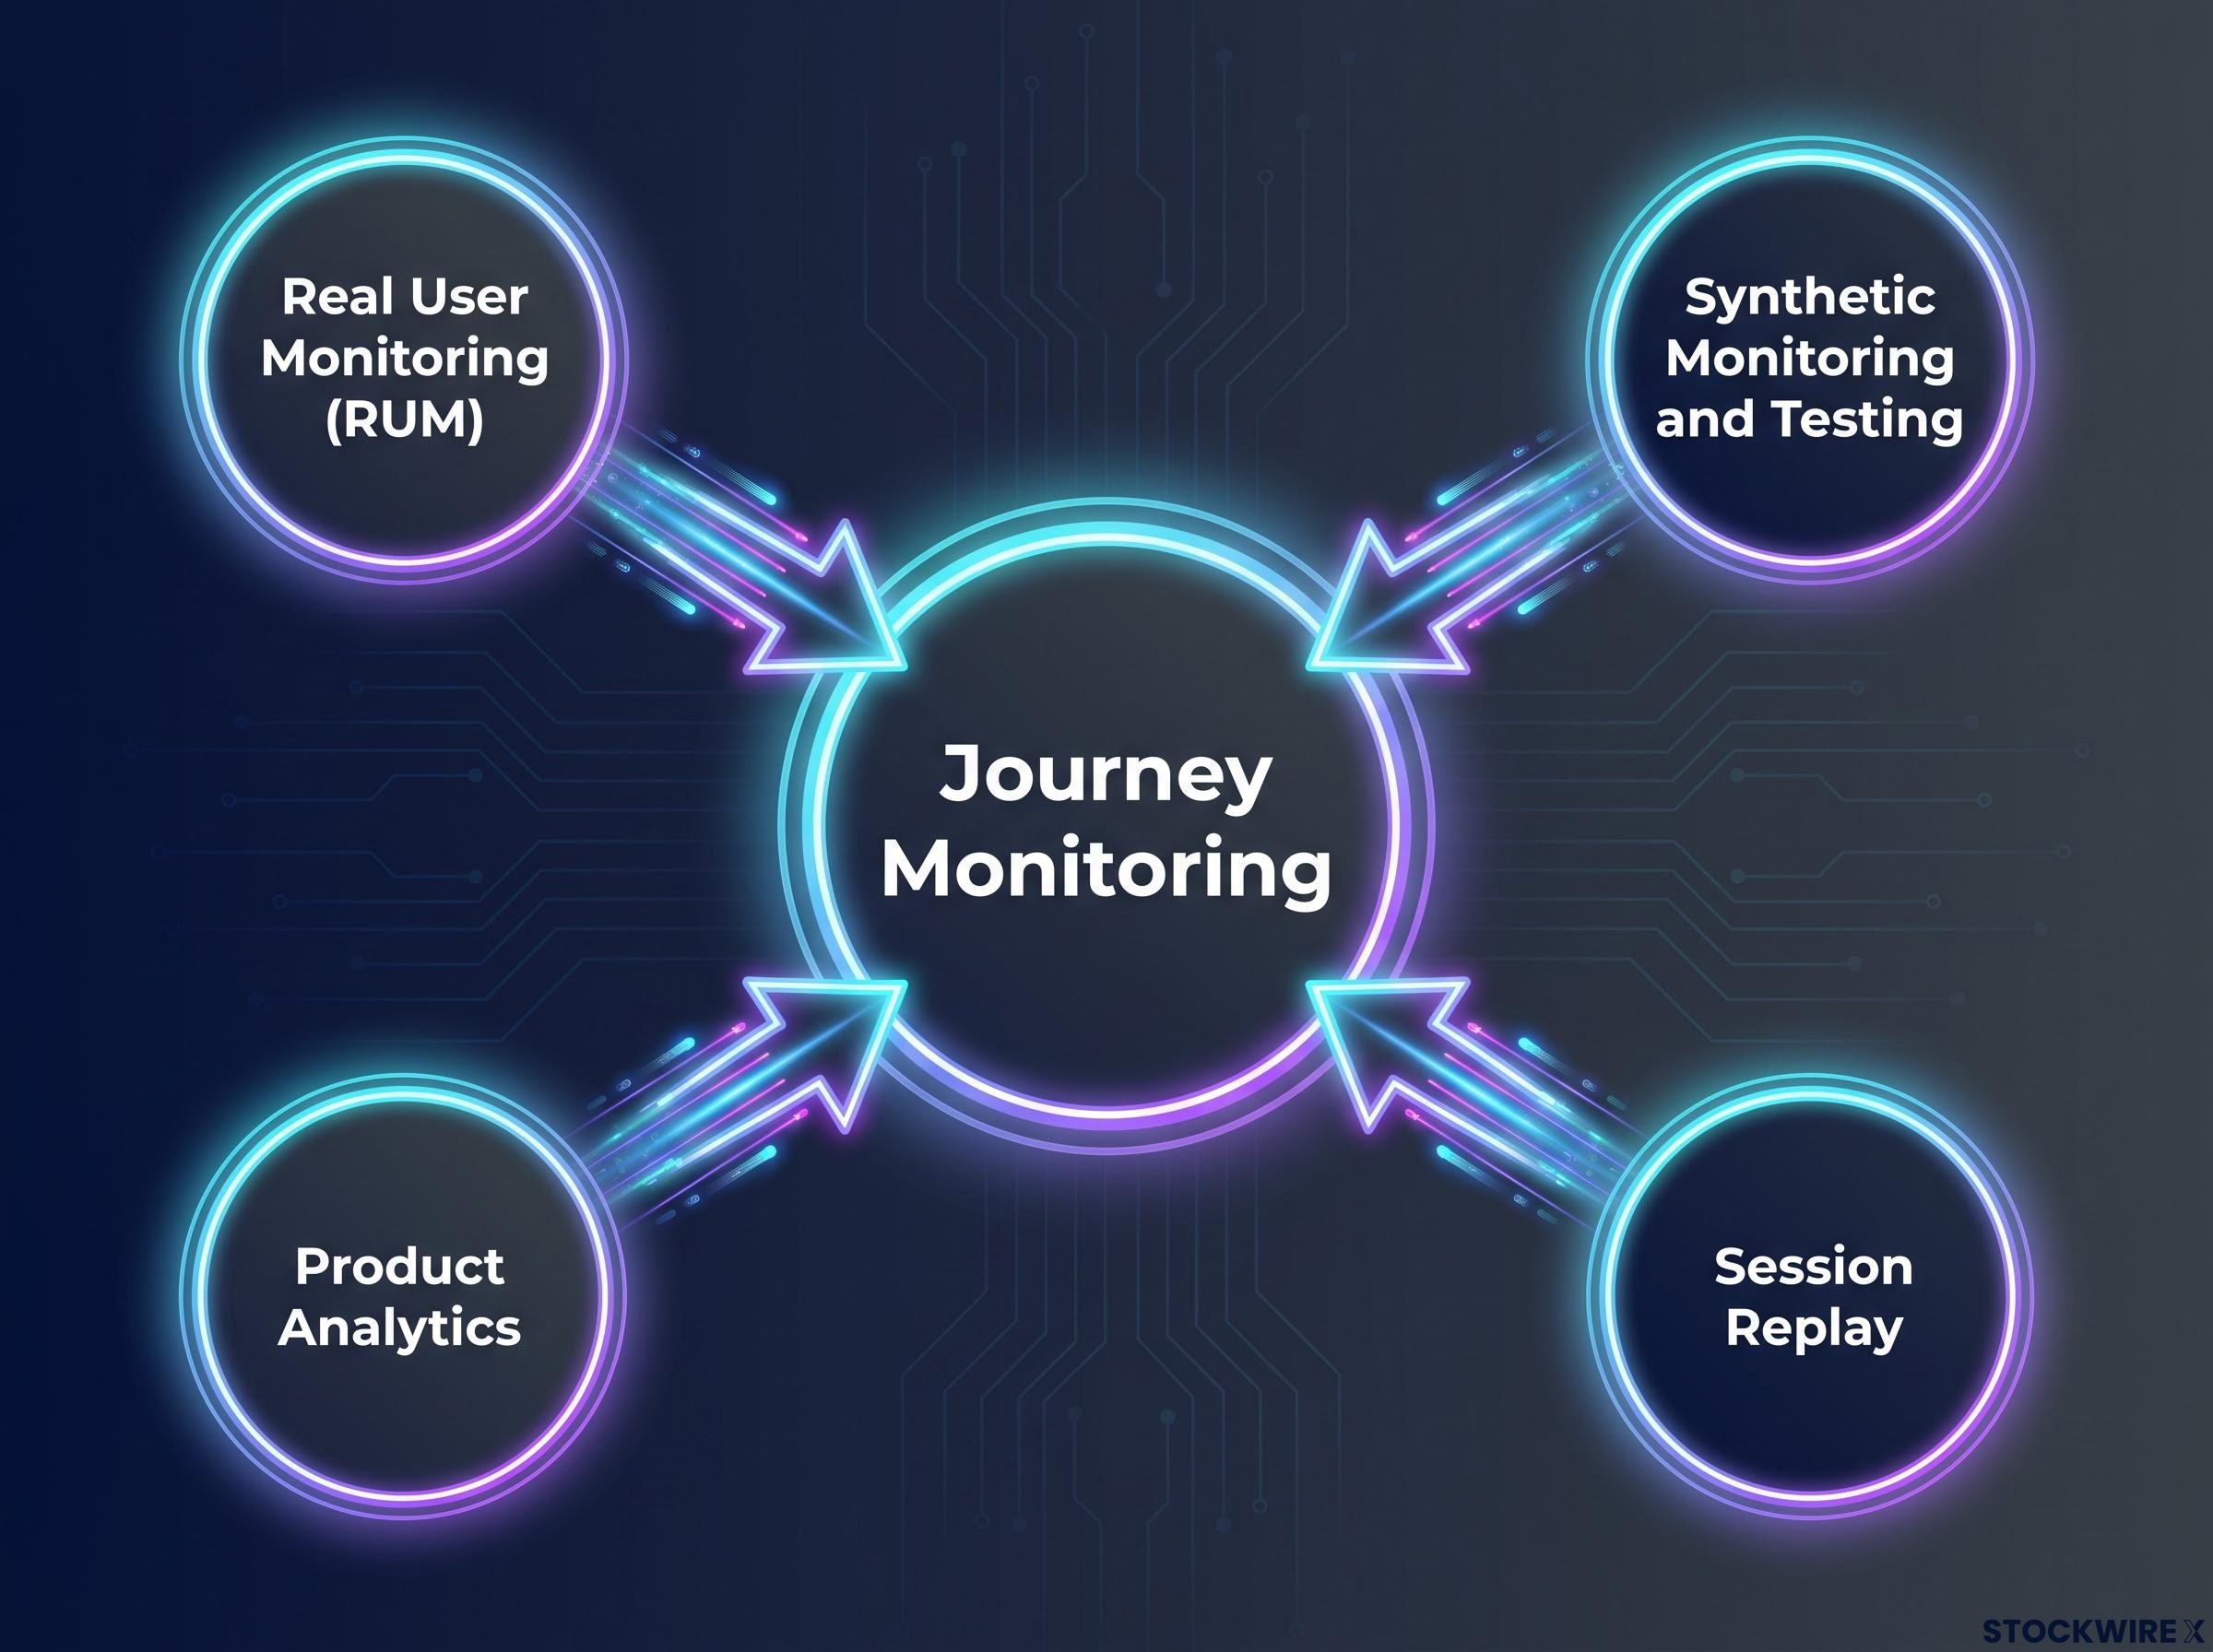
Journey Monitoring is a centralised observability hub. It consolidates data from four sources, Real User Monitoring (RUM), Synthetic Monitoring and Testing, Product Analytics, and Session Replay, into a single view of user journey health covering traffic, conversion rates, uptime, and errors.
Bits Testing works the other way round. It is an AI agent that autonomously discovers business-critical user journeys and generates self-healing synthetic tests from either a URL or a plain-language prompt, with no code authoring required. From a single prompt it produces browser, API, network path, and goal-based test types.
Both require existing DEM subscriptions. Journey Monitoring needs at least one of RUM without Limits, Product Analytics, or Synthetic Browser or Mobile Tests. Bits Testing is embedded within Synthetic Monitoring and Testing. Neither is sold standalone.
Here is the useful part for anyone evaluating fit. Datadog positioned these two tools together, not as unrelated features that happened to ship on the same day. That framing tells you the company sees observability and test coverage as two faces of the same reliability problem, and that treating them as separate concerns is itself the gap worth naming. Both were also flagged in Datadog’s Q2 2026 earnings call as AI-powered differentiators alongside Bits Code.
What each tool does at a glance
| Tool | Core Function | Integration Requirement | Test Types Supported | Status |
|---|---|---|---|---|
| Journey Monitoring | Unifies journey health data into one view | Needs RUM without Limits, Product Analytics, or Synthetic Browser/Mobile Tests | Not applicable (observability, not testing) | Preview |
| Bits Testing | AI agent that discovers journeys and generates self-healing tests | Embedded within Synthetic Monitoring and Testing | Browser, API, network path, goal-based | Preview |
When big ASX news breaks, our subscribers know first
Why scripted tests keep breaking, and what goal-based testing does differently
To understand why Bits Testing exists, start with the failure mode it targets.
Traditional synthetic tests are tied to specific UI steps and element selectors. When an application changes through a redesign, an A/B test, or a feature rollout, those scripts break. The journeys they were meant to validate quietly go unchecked, and teams do not always know it has happened.
“Scripted tests quickly become brittle as applications change,” according to Datadog’s Bits Testing documentation, leading to coverage gaps and ongoing manual maintenance.
That brittleness is the whole point of contrast with goal-based testing. A step-based test verifies that each recorded action occurred. A goal-based test verifies that the intended business outcome was achieved. Take checkout: a step-based test confirms that a button was clicked in a certain sequence; a goal-based test confirms that the purchase completed, regardless of how the interface changed underneath it.
The self-healing mechanism is what makes this practical. Because the Bits Testing agent rediscovers navigation paths at runtime rather than replaying pre-recorded steps, it can regenerate tests when the application changes, without manual intervention. Datadog also positions goal-based testing as suited to AI-powered features whose outputs vary between runs, since outcome validation tolerates non-deterministic behaviour where step-replay does not.
| Attribute | Step-Based Testing | Goal-Based Testing |
|---|---|---|
| What it records | Exact UI interaction sequence | The end outcome to be verified |
| What breaks it | Changed UI elements or selectors | Little; it rediscovers valid paths |
| Response to app changes | Requires manual repair | Agent regenerates test paths |
| What it verifies | That steps occurred | That the business outcome succeeded |
Here is the read for you. If your synthetic suite still contains scripts untouched since your last major UI overhaul, that suite is more likely providing false assurance than genuine coverage. Removing exactly that risk is what Bits Testing is designed to do.
Journey Monitoring as the observability side of the same problem
Bits Testing tries to stop broken journeys from surviving deployment. Journey Monitoring handles what comes after: whether real users are actually completing those journeys in production, not just whether synthetic tests pass.
It does this by continuously analysing live user traffic to identify high-priority flows and flag at-risk areas before problems escalate to customer support. Journey maps visualise interdependencies, so a fault in one flow such as login can be traced as it cascades into related flows such as checkout. SLO breach badges surface the trouble spots before deeper investigation.
The unifying move is the metric view. Journey Monitoring pulls together four data sources:
- RUM: real user session and traffic behaviour
- Synthetic Monitoring and Testing: proactive availability checks
- Product Analytics: conversion and flow completion data
- Session Replay: the qualitative record of what users experienced
Together these give one interface for traffic volume, conversion rates, uptime, and errors, replacing the multi-dashboard correlation teams do by hand today.
The interpretive point is worth stating plainly. A team whose individual service dashboards all show green while conversion rates quietly fall has exactly the problem Journey Monitoring is built to surface. Recognising that distinction is what separates useful DEM from dashboard sprawl.
Where Datadog sits in a crowded DEM market
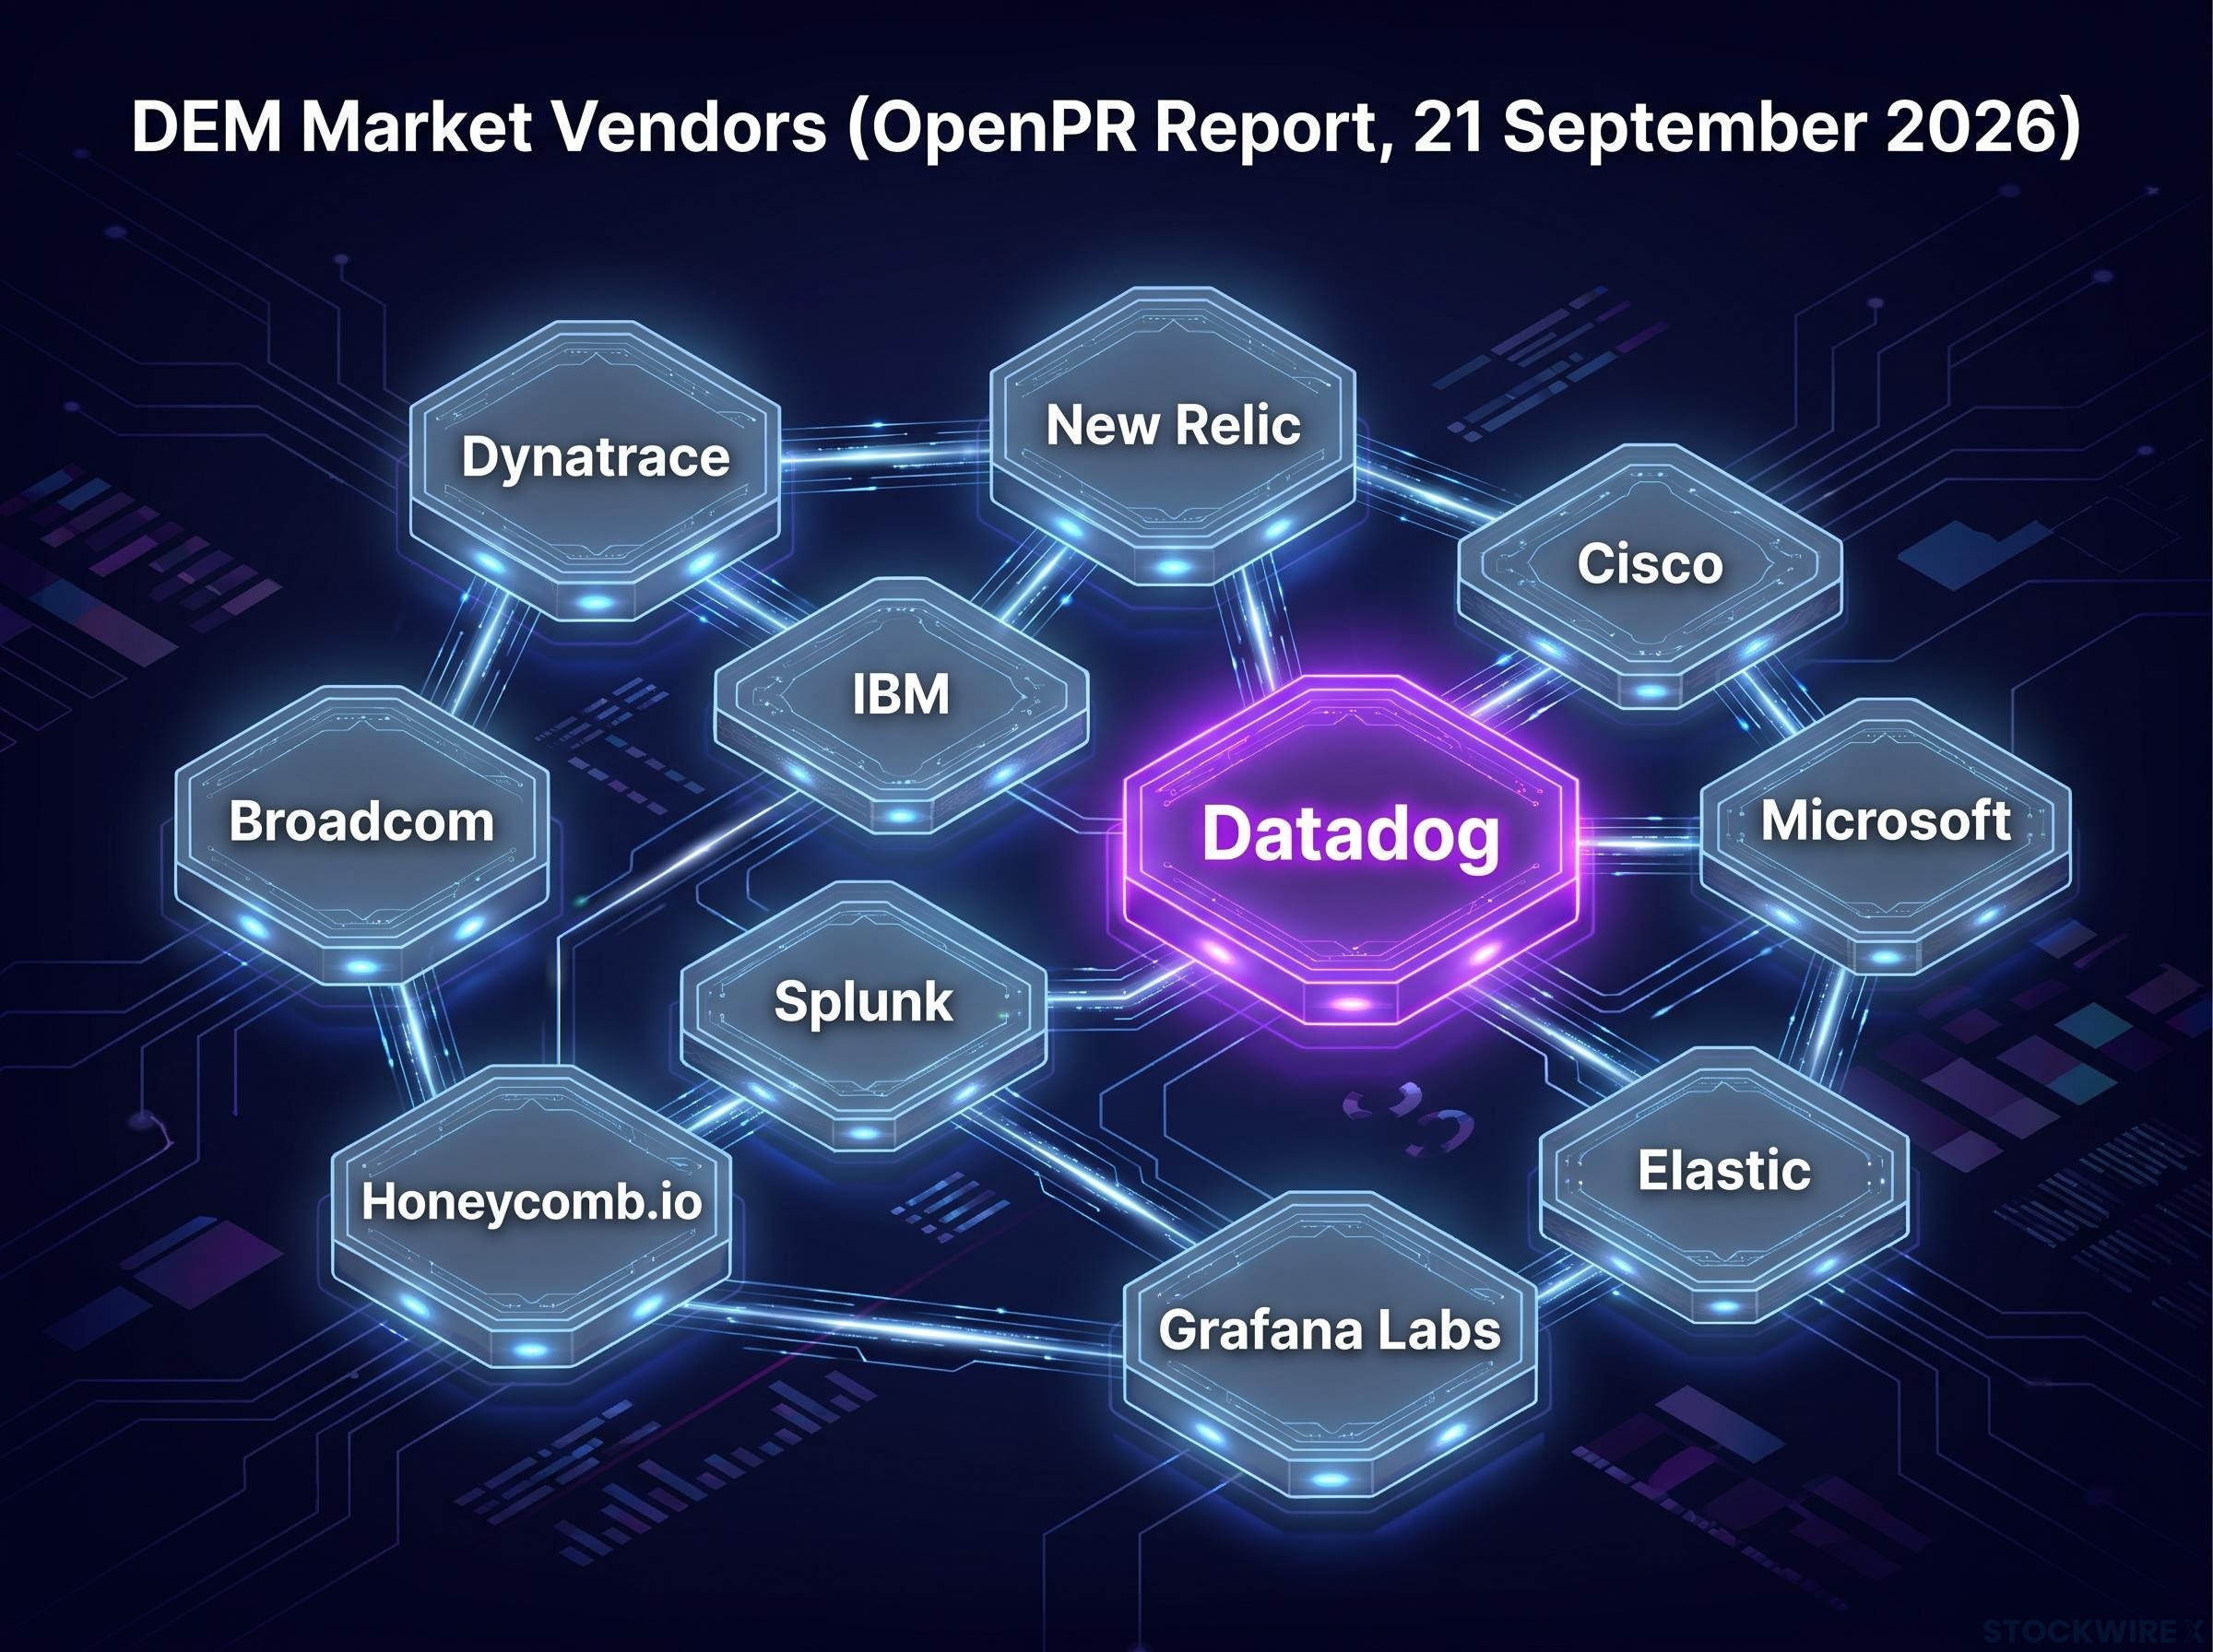
Datadog is not alone here. An OpenPR market report dated 21 September 2026 lists a dense field of vendors including Dynatrace, New Relic, Cisco, IBM, Broadcom, Microsoft, Splunk, Elastic, Honeycomb.io, and Grafana Labs.
Datadog is not alone here. An OpenPR market report dated 21 September 2026 lists a dense field of vendors including Dynatrace, New Relic, Cisco, IBM, Broadcom, Microsoft, Splunk, Elastic, Honeycomb.io, and Grafana Labs, and the 2025 Gartner Magic Quadrant for Digital Experience Monitoring names Dynatrace among the category leaders, reflecting how competitive the field had already become before Datadog’s DASH 2026 announcements.
What differentiates Datadog is placement rather than novelty. Journey Monitoring and Bits Testing live inside existing RUM and Synthetic subscriptions, and Datadog’s modular SKU-based pricing embeds DEM within subscriptions teams may already hold. For an organisation already inside the Datadog ecosystem, that integration is the pitch. For one outside it, these tools arrive attached to a broader platform commitment.
Platform consolidation in enterprise tech accelerated sharply in early 2026, with capital migrating away from point-solution vendors toward integrated infrastructure providers, a pattern that contextualises why Datadog is bundling AI-driven reliability tools into existing DEM subscriptions rather than launching them as standalone products.
What early access means, and what teams should watch before general availability
Preview status is easy to skim past. It should not be.
Both tools are Preview capabilities, not production-grade guarantees. Journey Monitoring still requires eligible RUM, Product Analytics, or Synthetic subscriptions, and Bits Testing is accessed through the Preview programme inside Synthetic Monitoring and Testing.
The limitations are real and specific. AI-driven testing depends on telemetry quality; incomplete or biased traces can produce tests that reinforce existing blind spots rather than reveal them. Poorly specified goals can lead an agent to validate the wrong outcome, which creates false assurance dressed up as coverage.
Self-healing mechanisms need transparent records of what changed in a test and why. Without that audit trail, a test could be silently updated to pass after a genuine issue arises, quietly undermining trust in both the QA results and the observability stack.
Human oversight remains necessary throughout. Autonomous agents that both generate and repair tests can encode incorrect assumptions if nobody reviews them.
Industry-wide pressure on AI agent oversight intensified in late August 2026 when over 100 technology companies including Alphabet, Microsoft, and Anthropic signed a joint letter warning that AI-enabled attack capabilities were advancing faster than defensive tooling, a dynamic that applies directly to any platform deploying autonomous agents in production monitoring and test infrastructure.
Before enrolling, ask:
- Is your observability data complete enough to support reliable journey discovery?
- Are your Bits Testing goals specified precisely enough to avoid validating the wrong outcome?
- Do you hold the RUM or Synthetic subscriptions that make Journey Monitoring accessible?
- Can you see a transparent record of what the agent discovered and modified?
The honest read for you is this. Preview means ready for evaluation, not ready for hands-off reliance. Treat the period as a structured pilot with explicit review of what the agent finds and changes.
What these tools signal about where observability and testing are heading
Step back from the two features and a broader direction comes into focus.
Digital experience monitoring, application performance monitoring, and synthetic testing are collapsing into unified platforms across major vendors. Datadog folding Journey Monitoring and Bits Testing into its existing RUM and Synthetic stack is one specific instance of that wider shift, not a standalone event.
AI agents are part of the reason. As DevOps.com coverage describes, the Bits Testing Agent sits alongside a Datadog Agent Console that provides a unified view of activity across AI coding agents. When agents operate across coding, testing, and runtime observability at once, platforms face pressure to integrate all three layers so those agents work from one signal set rather than siloed data.
Three forces are driving the convergence:
The convergence Datadog is pursuing in observability and testing mirrors a dynamic visible across enterprise technology more broadly, where AI-driven platform consolidation is separating vendors with deep telemetry and integrated agent layers from point-solution providers whose moats depend on staying ahead of rapidly closing capability gaps.
- Real-time linkage between user experience and underlying service health
- AI agents operating across coding, testing, and observability layers simultaneously
- Competitive pressure toward platform completeness
The uncertainty is genuine, though. A GuruStartups 2025 report, “Software Testing 3.0,” describes the potential for AI agents to build “self-driving test pipelines” while stressing that telemetry quality and human oversight remain essential conditions. The category is early, and the gap between a controlled demo and reliable production coverage at scale is not yet closed.
Here is what it means for you. This integration reflects a bet that software reliability will increasingly come from automated discovery and repair rather than human-maintained script libraries. Whether that bet fits how your team wants to run quality is a view worth forming now.
What to do if you are already a Datadog customer and want to evaluate these tools
If you already run Datadog RUM or Synthetics, there is a clear path to try both tools without overcommitting.
Journey Monitoring eligibility requires a paid or trial subscription to RUM without Limits, Product Analytics, Synthetic Browser Tests, or Synthetic Mobile Tests. Bits Testing access comes through the Preview programme inside Synthetic Monitoring and Testing. Neither is separately priced; both sit within existing DEM tiers as of 24 September 2026.
The sensible approach is a narrow, structured pilot rather than a full rollout:
- Confirm your subscription eligibility for the relevant DEM products.
- Select one high-priority journey, checkout or login, and define a specific business outcome as the goal.
- Review the agent’s test discoveries and modification history before relying on any results.
Bits Testing starts from a URL or a natural-language prompt, so no code authoring is needed to begin. Journey Monitoring will surface conversion drops, map journey interdependencies, and fold in SLO breach badges within its unified view.
The practical read: teams that start with a single, well-understood critical journey rather than their whole application will generate the clearest signal about whether the agent’s discovery and self-healing actually match how their software behaves.
This article is for informational purposes only and should not be considered financial advice. Investors should conduct their own research and consult with financial professionals before making investment decisions.
Two Preview tools, one structural bet on AI-driven reliability
Strip away the feature list and one claim remains. Datadog is betting that the future of digital experience reliability lies in platforms that discover, test, monitor, and repair user journeys autonomously, rather than teams maintaining hand-crafted scripts and separate dashboards.
The two tools attack the same problem from opposite ends. Journey Monitoring surfaces journey failures in production; Bits Testing tries to stop them surviving deployment undetected. Both were flagged in the Q2 2026 earnings call as central to Datadog’s AI narrative, not peripheral additions.
Datadog’s Q2 2026 earnings call framing of Journey Monitoring and Bits Testing as AI-powered differentiators sits within a broader market context where enterprise software selectivity has become the defining investor question of 2026, with record dispersion between companies successfully embedding AI as a revenue layer and those whose existing pricing moats are eroding.
The honest state of play tempers that ambition. Both remain in Preview, the AI-driven self-healing category is still maturing, and the distance between a well-run pilot and dependable production coverage at scale has not yet been fully closed.
That leaves the decision with you. Whether these tools deliver depends less on the technology than on whether teams adopt them with enough structure and oversight to tell genuine reliability apart from a more sophisticated version of the false confidence brittle scripts already produce.