
You bought gold to hedge inflation. You bought long Treasuries to protect against a stock market crash. You bought Bitcoin because someone told you it was digital gold, a hedge against everything else. Then one session arrived where all three fell at once, and you were left holding three losing positions instead of one working hedge.
That is the problem worth understanding, because it is not rare, and it is not a sign that markets are broken. On the session behind this piece, gold miners tracked by GDX dropped more than 4%, the long-Treasury fund TLT fell roughly 1.62%, and the spot Bitcoin fund IBIT slid more than 3%. Three different kinds of protection, all failing in the same window.
Each of these assets is sold to you as a different insurance policy: an inflation hedge, a risk-off haven, a dollar alternative. Yet they have a documented habit of failing together, for reasons most retail investors have never had explained to them.
This gives you a usable mental model for why safe haven assets falling in unison happens, what it signals when it does, and how to hold these positions with expectations that match reality. After reading this, you will know whether your portfolio is built for the conditions that actually exist, not the ones you assumed when you bought each piece.
What you are actually seeing when all three fall together
The instinct when your hedges all turn red is to conclude that diversification has stopped working. That instinct is wrong, and correcting it is the first useful thing this article can do for you.
Simultaneous declines across gold, long Treasuries, and Bitcoin are not a fluke. They are a recognisable market-structure event with specific, well-documented causes. When you see them, the problem is almost never with any single hedge. It is with what is driving the market that day, and that distinction determines whether you should act or simply wait.
Here is what the single session behind this piece actually looked like across the instruments most retail investors hold.
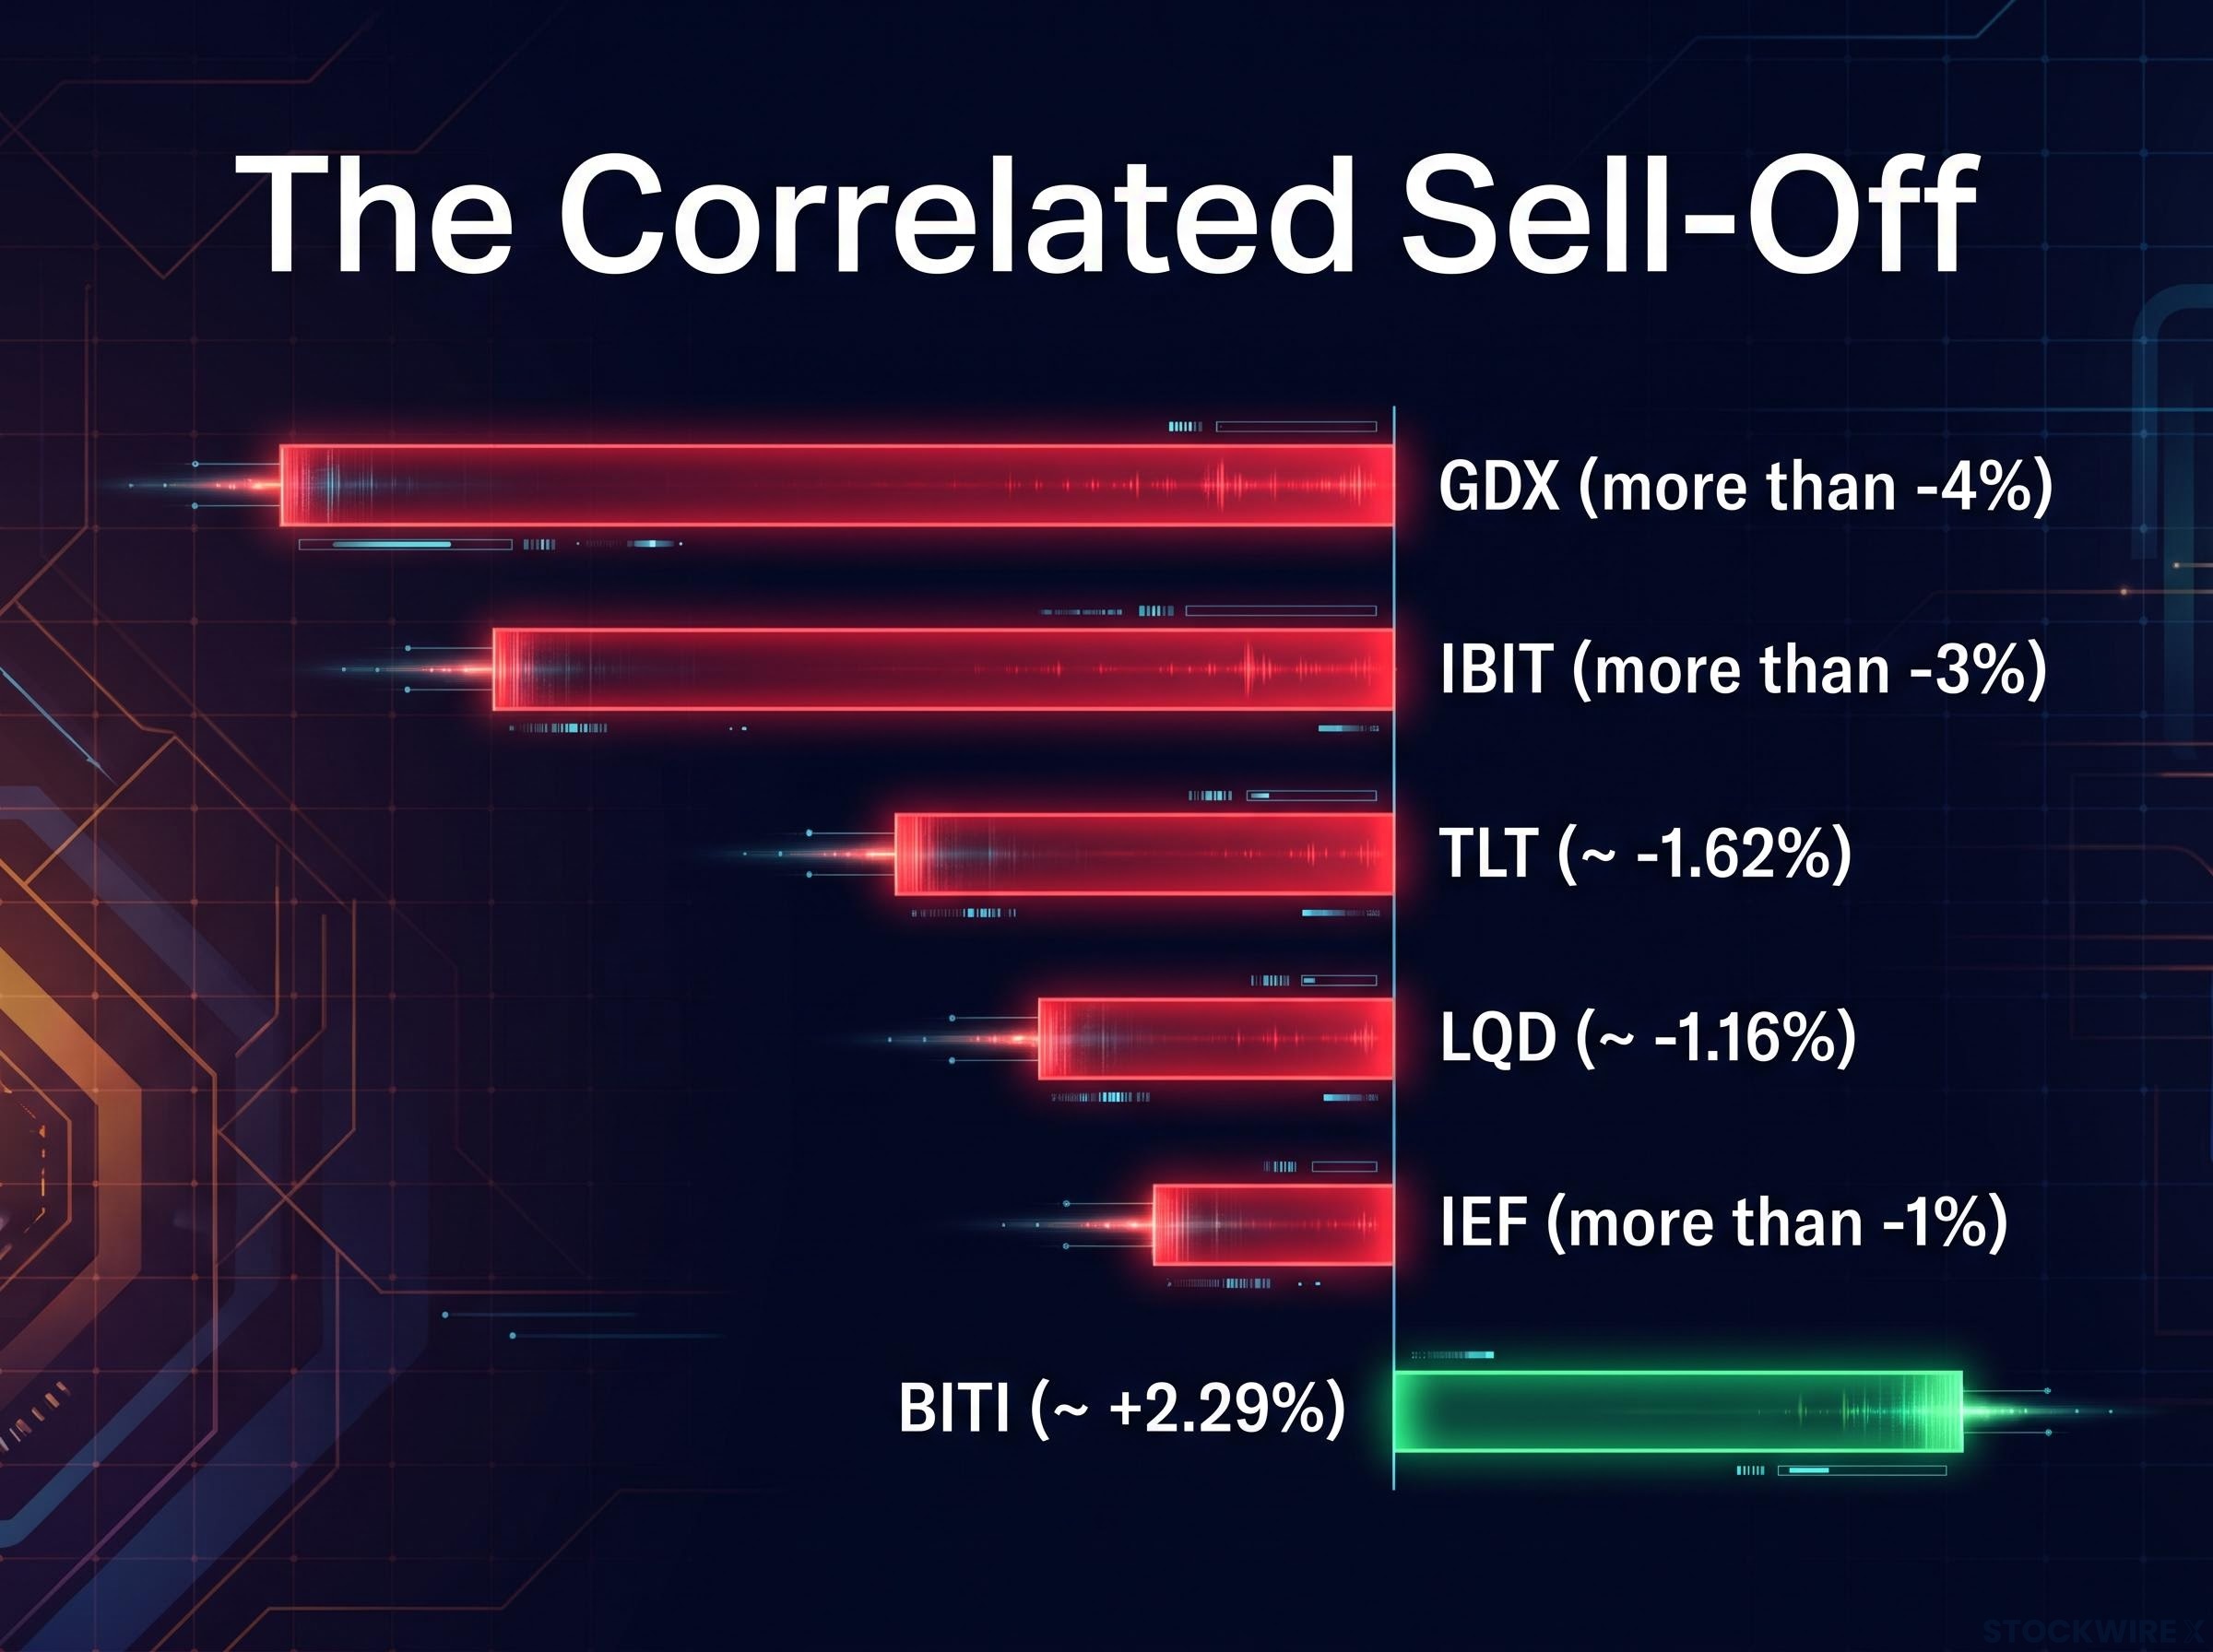
| Asset | Ticker | Direction | Move |
|---|---|---|---|
| Gold miners | GDX | Down | more than 4% |
| Long Treasuries | TLT | Down | approximately 1.62% |
| Intermediate Treasuries | IEF | Down | more than 1% |
| Investment-grade credit | LQD | Down | approximately 1.16% |
| Spot Bitcoin | IBIT | Down | more than 3% |
| Inverse Bitcoin | BITI | Up | approximately 2.29% |
Notice the only instrument that rose: the inverse Bitcoin fund, which is built to profit when Bitcoin falls. Everything designed to hold value in a crisis went the same direction at once.
Two names for what just happened
There are two dominant mechanisms behind this pattern, and it helps to know their names before you understand their mechanics.
The first is the dash for cash. When investors need dollars in a hurry, they sell whatever is liquid enough to sell quickly, regardless of whether that asset is meant to be a hedge. Gold, Treasuries, and Bitcoin funds all qualify.
The second is forced deleveraging. Margin calls and fund redemptions force portfolios to liquidate across every asset class at once, not because those assets are suddenly less valuable, but because the seller has no choice.
This is not new behaviour. In March 2020, Federal Reserve and Bank for International Settlements reporting documented investors dumping Treasuries and gold simultaneously as institutions scrambled for cash. The 2022 rate shock produced a second version of the same lesson. The pattern recurs, which is precisely why it is worth learning to read rather than fear.
When big ASX news breaks, our subscribers know first
The mechanics behind the correlated sell-off
Knowing the names is not enough. To decide whether to hold or act, you need to see how these declines connect, because they are not three separate accidents happening at once. They are usually one underlying force expressed through three channels.
Start with real yields. A real yield is the interest rate on a bond after subtracting expected inflation, and it is the single most important variable for long-duration assets. When real yields rise sharply, long Treasuries fall in price because their fixed payments are now worth less against higher available rates.
The U.S. 10-year real yield reached a real yield cycle peak of roughly 2.55%-2.60% in mid-September 2026, with Bruegel data attributing approximately 80% of the nominal rate surge to the real component rather than inflation fear, confirming the move as a discount-rate shock rather than an ordinary bond selloff.
Gold reprices in the same move. Gold pays no interest, so when safe bonds start offering a higher real return, the opportunity cost of holding a metal that yields nothing goes up, and gold becomes less attractive. Institutional research from Goldman Sachs and JPMorgan has repeatedly linked gold drawdowns to episodes of rising real yields and a stronger dollar since 2013.
Bitcoin sits at the end of that same chain. It has increasingly traded as a high-beta risk asset, meaning it moves more sharply than the broad market in both directions, so when discount rates climb, it reprices alongside speculative equities rather than acting as a refuge.
Why ETF structure makes it worse
The second channel is the risk-parity unwind, and this is where the plumbing matters. Risk-parity strategies hold stocks and long Treasuries together on the assumption they move in opposite directions. When volatility spikes and those correlations turn positive, meaning both fall at once, these funds are forced to cut exposure across the board.
Bridgewater Associates has discussed publicly how this mechanism turned March 2020 and the 2022 rate shock into mechanical selling events. When these strategies rebalance, they can dump long Treasuries and gold futures in the same session, purely to reduce overall risk.
Then there is the exchange-traded fund wrapper itself, which adds a structural liquidity layer that physical holders never face. When outflows from a fund like IBIT accelerate, the ETF manager must sell the underlying asset into whatever conditions exist, and if those conditions are already illiquid, the selling amplifies the price decline beyond what fundamentals alone would justify.
The 2025-2026 Bitcoin cycle is the live example. Coingecko documented a record month of ETF outflows in July 2026, feeding a peak-to-trough decline of more than 52% from the October 2025 high of roughly $126,000 to a June 2026 trough near $59,100. This is a distinction that matters for you specifically as a US retail investor: holding TLT or a gold ETF is not the same as holding a Treasury directly or a bar of physical gold, because the fund adds a selling mechanism during stress that the physical asset does not have.
Crypto Fear and Greed Index: 8 During the June 2026 Bitcoin trough, the widely watched sentiment gauge fell to a reading of 8, among the most extreme fear levels in the asset’s history, a signal of the dollar-funding stress that ETF outflows amplified.
Put the three channels together and the picture is not three problems. It is one environment.
- Rising real yields: long Treasuries fall, gold loses its relative appeal, Bitcoin reprices as a risk asset.
- Risk-parity unwind: leveraged multi-asset funds sell Treasuries and gold together when correlations turn positive.
- Dollar liquidity squeeze: a strengthening dollar and rising funding costs drive outflows from gold and Bitcoin at once.
Your portfolio is most exposed not when markets simply drift lower, but when all three of these conditions arrive together. That specific combination is what turns your hedges into liabilities.
The three assets are not equal in how often they fail
Here is where the opening problem finally resolves. The reason you ended up with three losing positions is not that all three are equally unreliable. It is that you treated them as equals when they are not.
Gold and long Treasuries are imperfect hedges, but they are structurally grounded ones. Their failures are regime-specific and interpretable. Long Treasuries reliably do their job during risk-off equity stress, when growth fears dominate; gold tends to hold or gain during inflation and currency stress. When they fall, you can usually name why.
Bitcoin is a different animal. Its drawdown history is dominated by speculative flows, ETF dynamics, and correlation with risk assets, not by any steady counter-cyclical response to macro stress. Research cited through NYDIG and bank strategists argues that Bitcoin’s behaviour across cycles is driven by speculation rather than a stable inflation hedge.
The numbers make the case bluntly. Bitcoin fell more than 52% from its October 2025 peak, a drawdown that lasted roughly 268 days, putting it in the same territory as its 2018 and 2022 bear markets, per IG UK and Coingecko. As of 23 September 2026, Bitcoin traded near $86,000, still down about 23.3% over the prior year and roughly 35-40% below its peak.
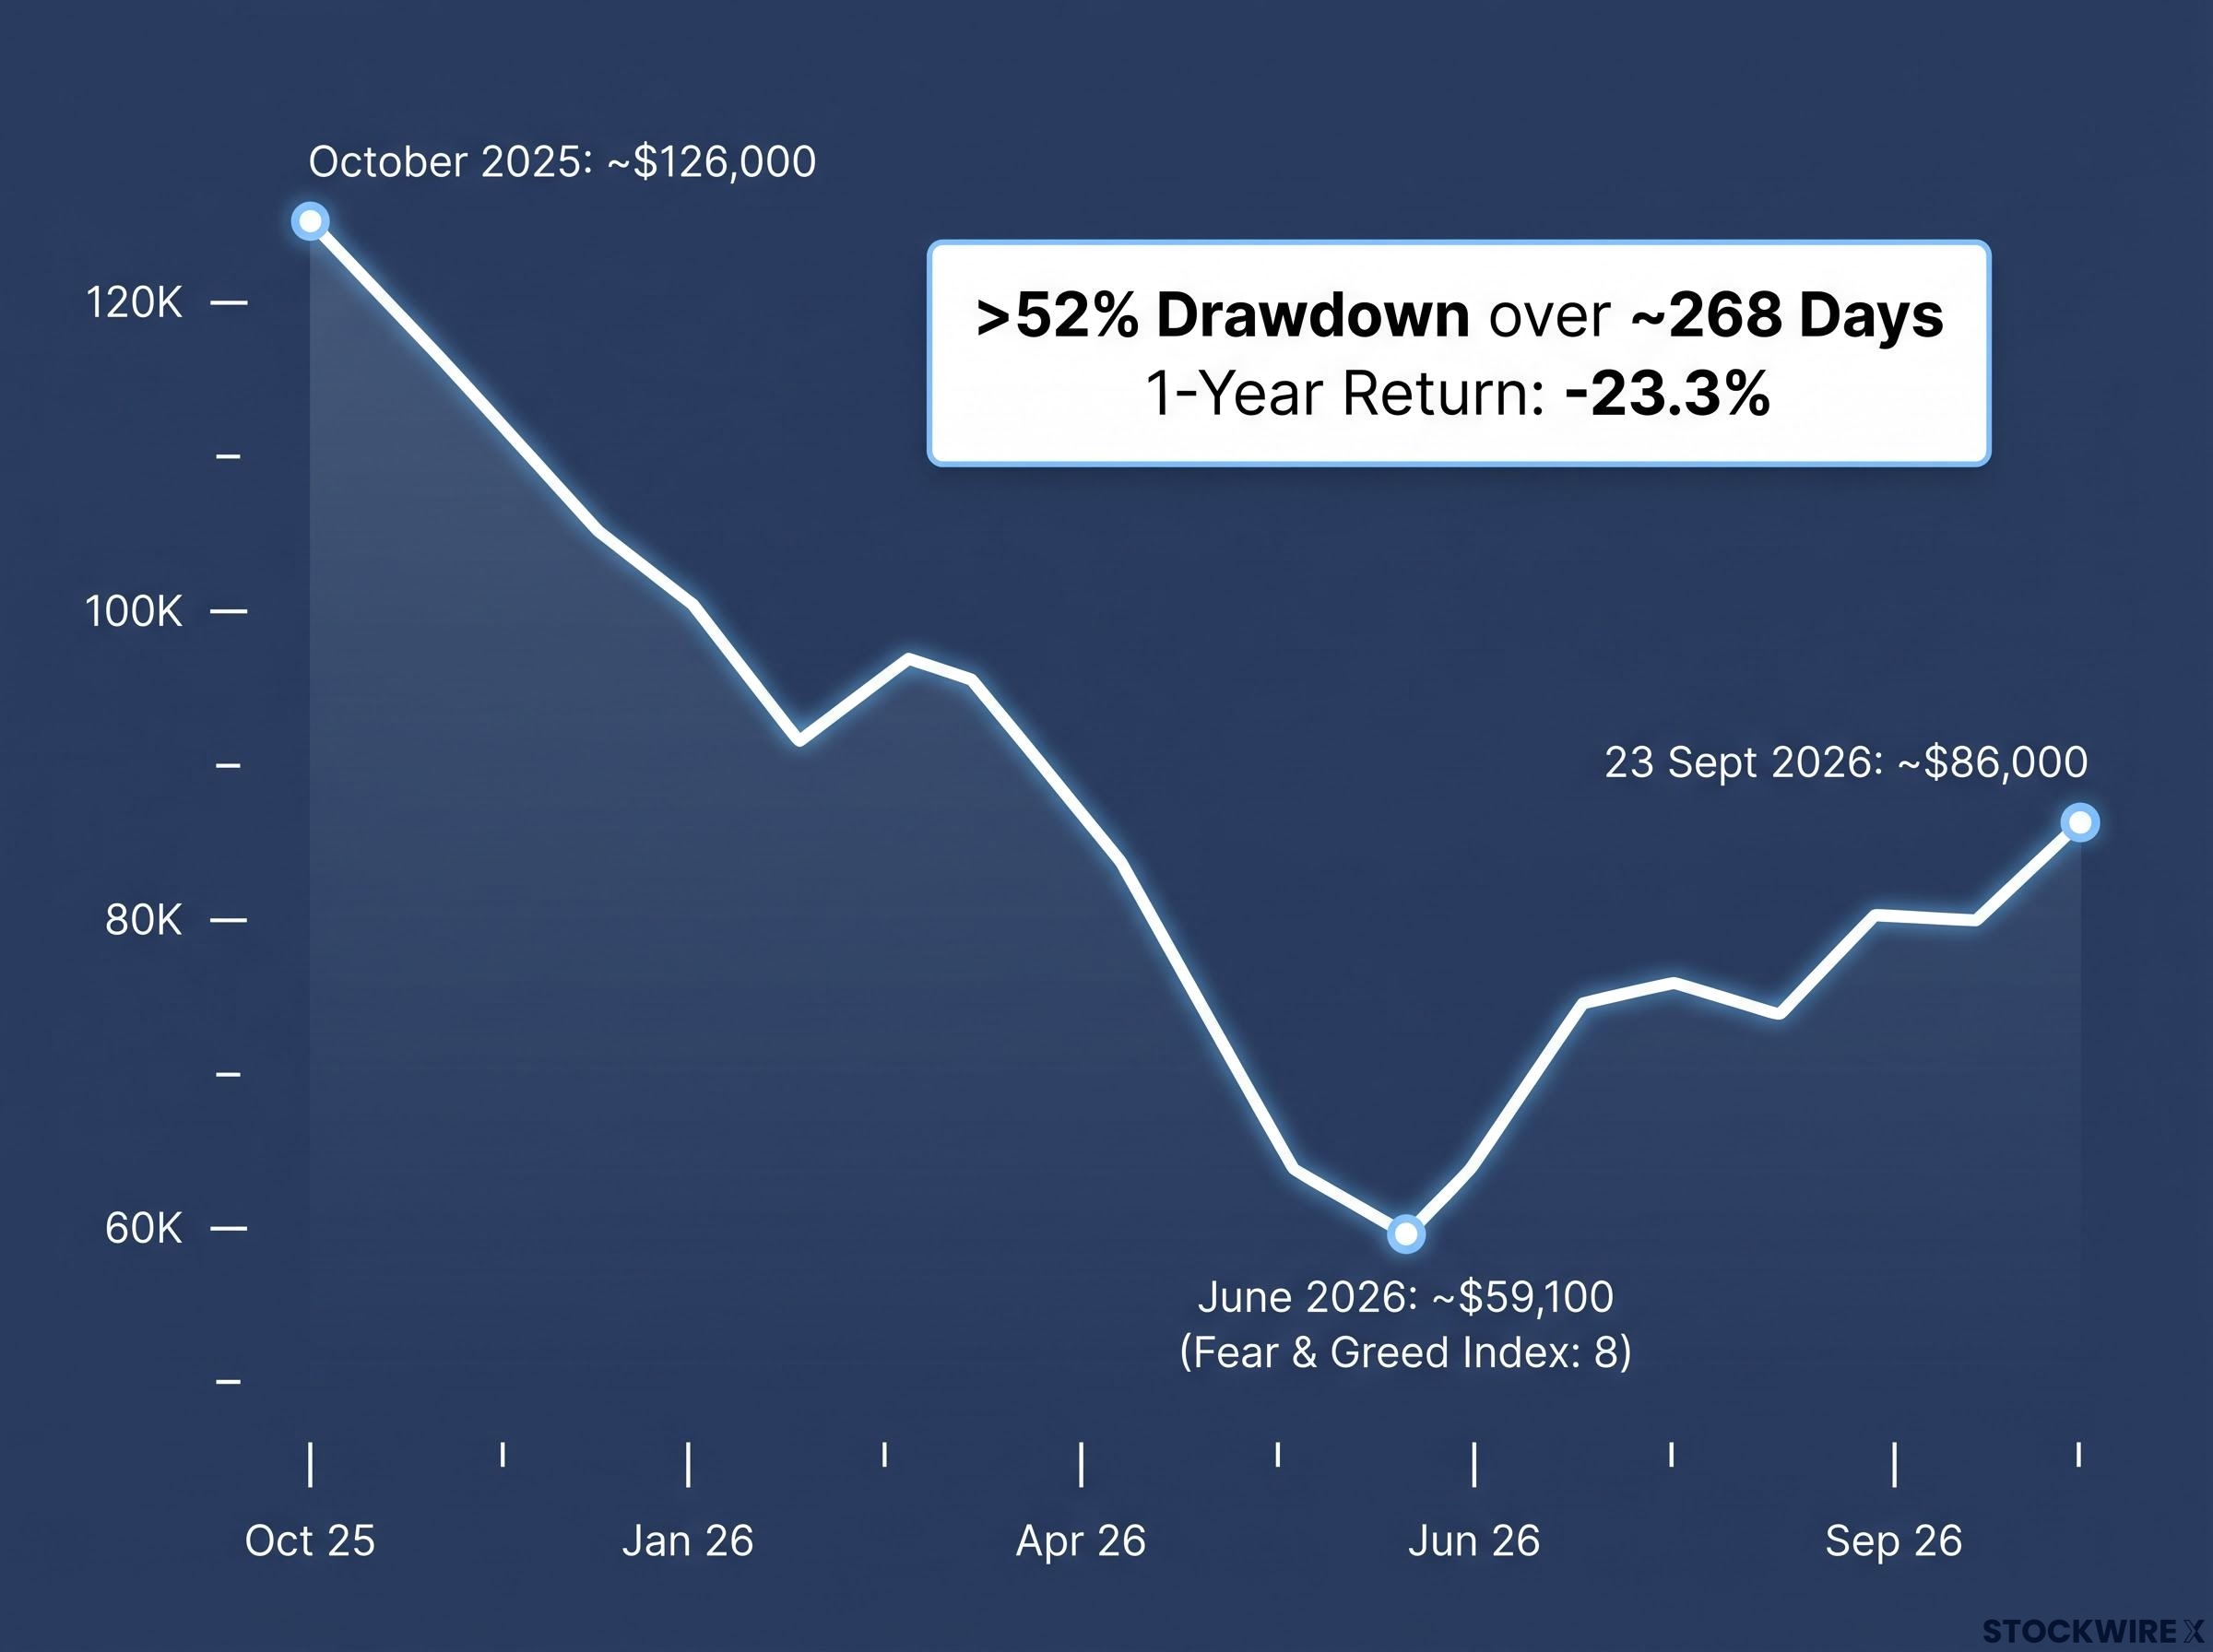
Bitcoin one-year return: -23.3% An inflation hedge is supposed to protect your purchasing power. An asset down nearly a quarter over twelve months did the opposite.
| Asset | Hedge function | When it works | When it breaks | 2025-26 drawdown |
|---|---|---|---|---|
| Gold | Inflation and currency store of value | Inflation, currency stress, equity bear markets | Rising real yields, strong dollar, extreme liquidity events | Regime-specific declines |
| Long Treasuries | Risk-off benchmark asset | Growth fears dominate inflation fears | Rising real yields, inflation shocks | Regime-specific declines |
| Bitcoin | Marketed as inflation hedge; behaves as high-beta risk | Occasional, unpredictable | Risk-off stress, ETF outflows, speculative unwinds | more than 52% |
A 52% drawdown lasting 268 days in the asset you bought to protect your purchasing power is not a hedge working. It is a risk position revealing what it always was. If you shifted portfolio weight into Bitcoin as an inflation hedge during 2024 and 2025, you should size it as high-risk satellite exposure going forward, not as a structural replacement for gold or Treasuries.
What the historical record says about when diversification actually fails
The most useful thing history gives you here is not a warning. It is a diagnostic tool. Three stress episodes over six years show that correlated sell-offs are not one phenomenon but a small family of them, each with a different dominant driver.
- March 2020, the dash for cash. Federal Reserve and BIS reporting documented Treasuries, gold, and equities selling off together as institutions scrambled for dollars. Assets with no fundamental reason to fall were liquidated simply because they were liquid enough to sell.
Federal Reserve Bank of New York research on the March 2020 dash for cash documented how selling pressure cascaded through U.S. Treasury markets as institutions liquidated their most liquid holdings first, regardless of those assets’ fundamental value, a dynamic that explains why gold and bonds fell in the same window equities did.
- 2022, the regime repricing. The inflation shock turned the normally negative stock-bond correlation positive, producing one of the worst years on record for the 60/40 portfolio. JPMorgan and Goldman Sachs research documented how rising real yields punished stocks, bonds, and gold in real terms at the same time.
A positive stock-bond correlation, where equities and Treasuries fall together rather than offsetting each other, is the defining feature of inflation-dominated regimes; UBS research from June 2026 found the two-month rolling correlation between the S&P 500 and the 10-year Treasury yield at its most extreme negative reading since 1996, a structural signal that the bond sleeve’s cushioning function has become conditional rather than reliable.
- 2025-2026, the ETF-era stress. Bitcoin’s more than 52% drawdown, from roughly $126,000 in October 2025 to near $59,100 in June 2026, layered a new mechanism onto the old speculative cycle: record ETF outflows, tracked by Coingecko in July 2026, amplifying the decline as the Fear and Greed Index hit 8.
The pattern is the point. Each episode had a different dominant driver, liquidity stress, then real-yield repricing, then ETF-structure amplification, but in every case the mechanism temporarily overwhelmed the hedge function. When your hedges fail together, the question to ask is not “which asset let me down” but “what kind of stress is this,” because the answer tells you whether to wait it out or restructure.
The current cycle in that context
Place the session from the opening into that taxonomy. Gold, Treasuries, and Bitcoin all falling together, with the dollar firm and sentiment near extremes, most closely resembles a liquidity-and-repricing hybrid rather than a pure fundamental collapse. The signals to read are dollar strength, the direction of real yields, and ETF flow data. When those three point the same way, you are likely watching plumbing and positioning, not a permanent verdict on any of these assets.
Holding these assets with accurate expectations going forward
So what do you actually do with this. The recalibration is simpler than the mechanics, and it comes down to three portfolio-logic points you can apply immediately.
Gold and long Treasuries belong in your core allocation, because their failure modes are interpretable and regime-specific. Bitcoin belongs as a high-risk satellite position, sized for the genuine possibility of a 50-plus percent drawdown rather than the hope of one. And no single hedge provides reliable protection during a liquidity or yield shock, so stop expecting one to.
Genuine portfolio diversification, in the framework Bridgewater built and applied across three decades, requires each position to have a correlation below roughly 0.3 with every other position and to be sized by volatility contribution rather than dollar allocation, a standard that a gold, long-Treasury, and Bitcoin combination fails during the specific stress regimes this article describes.
The ETF-wrapper question deserves a direct answer for US retail investors. Holding TLT or a gold ETF rather than direct Treasuries or physical metal adds a structural liquidity risk during stress, because the fund must sell underlying assets into weak markets when outflows accelerate. That does not make ETFs wrong to own, but it does mean their behaviour in a crisis can be worse than the asset itself.
To tell which stress regime is forming, watch three signals.
- Real yield direction: rising real yields, visible in Treasury Inflation-Protected Securities pricing, pressure bonds, gold, and Bitcoin at once.
- Dollar index movement: a strengthening dollar signals the funding stress that drives outflows from gold and crypto.
- ETF flow data: accelerating outflows from Bitcoin and gold ETFs warn that structural selling may be amplifying price moves.
A seven-year bond bear trend The analyst behind the source material describes a multi-year bearish backdrop in bonds already running roughly seven years, with more realistic pricing expected to reassert after the election. Treat this as a structural backdrop, not a near-term trade call.
One technical line worth watching: the source analyst flags gold support near the 4,300 level as the point where a break could accelerate selling. And Bitcoin’s climb from below $60,000 in June 2026 to roughly $86,000 by late September, up 14.4% in a single prior week, is the volatility profile you must be sized for.
This article is for informational purposes only and should not be considered financial advice. Investors should conduct their own research and consult with financial professionals before making investment decisions. Past performance does not guarantee future results, and these observations are subject to change based on market developments.
What changes in how you hold these assets, and what does not
The central shift is this: simultaneous declines across gold, bonds, and Bitcoin are not a signal that diversification is dead. They are a signal that the type of stress determines whether your hedges work, and identifying that stress type is now part of your job as an investor, not an optional extra.
What does not change is the core logic. Gold and Treasuries remain regime-dependent but structurally grounded, and they earn their place in your core. What changes is the humility you bring to any single hedge, and the discipline to size Bitcoin as the high-volatility risk asset its record shows it to be.
The conditions that produce these correlated sell-offs, rising real yields, a strengthening dollar, and ETF structures amplifying outflows, are not going away. Bitcoin sitting near $86,000 in late September 2026, well below its peak, is the live reminder of the volatility you are working with in real time.
When your portfolio next turns red across the board, the durable advantage is not knowing which asset to sell. It is knowing which question to ask first: what kind of stress is this. Leave with that question, and you are better positioned than the investor who leaves with only a list of assets to avoid.