There is a comforting story about interest rates that goes something like this: the Federal Reserve cuts, borrowing gets cheaper, and everything you own goes up. Bonds rally, the dollar falls, gold shines, oil climbs. One lever, one predictable outcome.
The problem is that markets have never actually worked that way.
Two years ago, in September 2024, the Fed handed us a clean laboratory to prove it. On 18 September 2024, the Federal Open Market Committee cut its target range by a hefty 50 basis points. What happened next was not uniform at all. Gold exploded to record highs while oil barely moved. The dollar sagged but did not collapse. Long-term Treasury yields, the asset that should have benefited most, dropped only modestly.
Understanding the central bank rate cut impact means understanding why those reactions diverged so sharply. This piece walks through the transmission mechanics, then takes you asset class by asset class through Treasuries, the dollar, and commodities, before landing on the economic data that ultimately governs all of them. After this, you will know why the next cut will not move your portfolio the way the headlines suggest.
The mechanics of monetary easing and market transmission
On the surface, a rate cut is a single decision. The FOMC votes to lower the target range for the federal funds rate, the overnight rate at which banks lend reserves to one another. In September 2024, that range came down to 4.75%-5.00%.
Underneath that headline sits a chain of plumbing that turns one domestic decision into a global repricing event.
The transmission chain described above rests on central bank rate mechanics that most investors never see directly, including the floor-ceiling corridor that enforces the overnight target and the role of open market operations in fine-tuning reserve supply between meetings.
Here is how the transmission actually flows:
- The Fed sets the overnight target range. This is the price of the shortest, safest money in the system.
- Institutional borrowing costs adjust immediately. Banks and money-market funds reprice their own lending against the new overnight benchmark.
- Consumer and corporate credit follows. Mortgages, business loans, credit cards, and corporate bond yields drift toward the new cost of money.
- Financial markets price the trajectory, not just the level. Traders look past today’s cut and start betting on the next one.
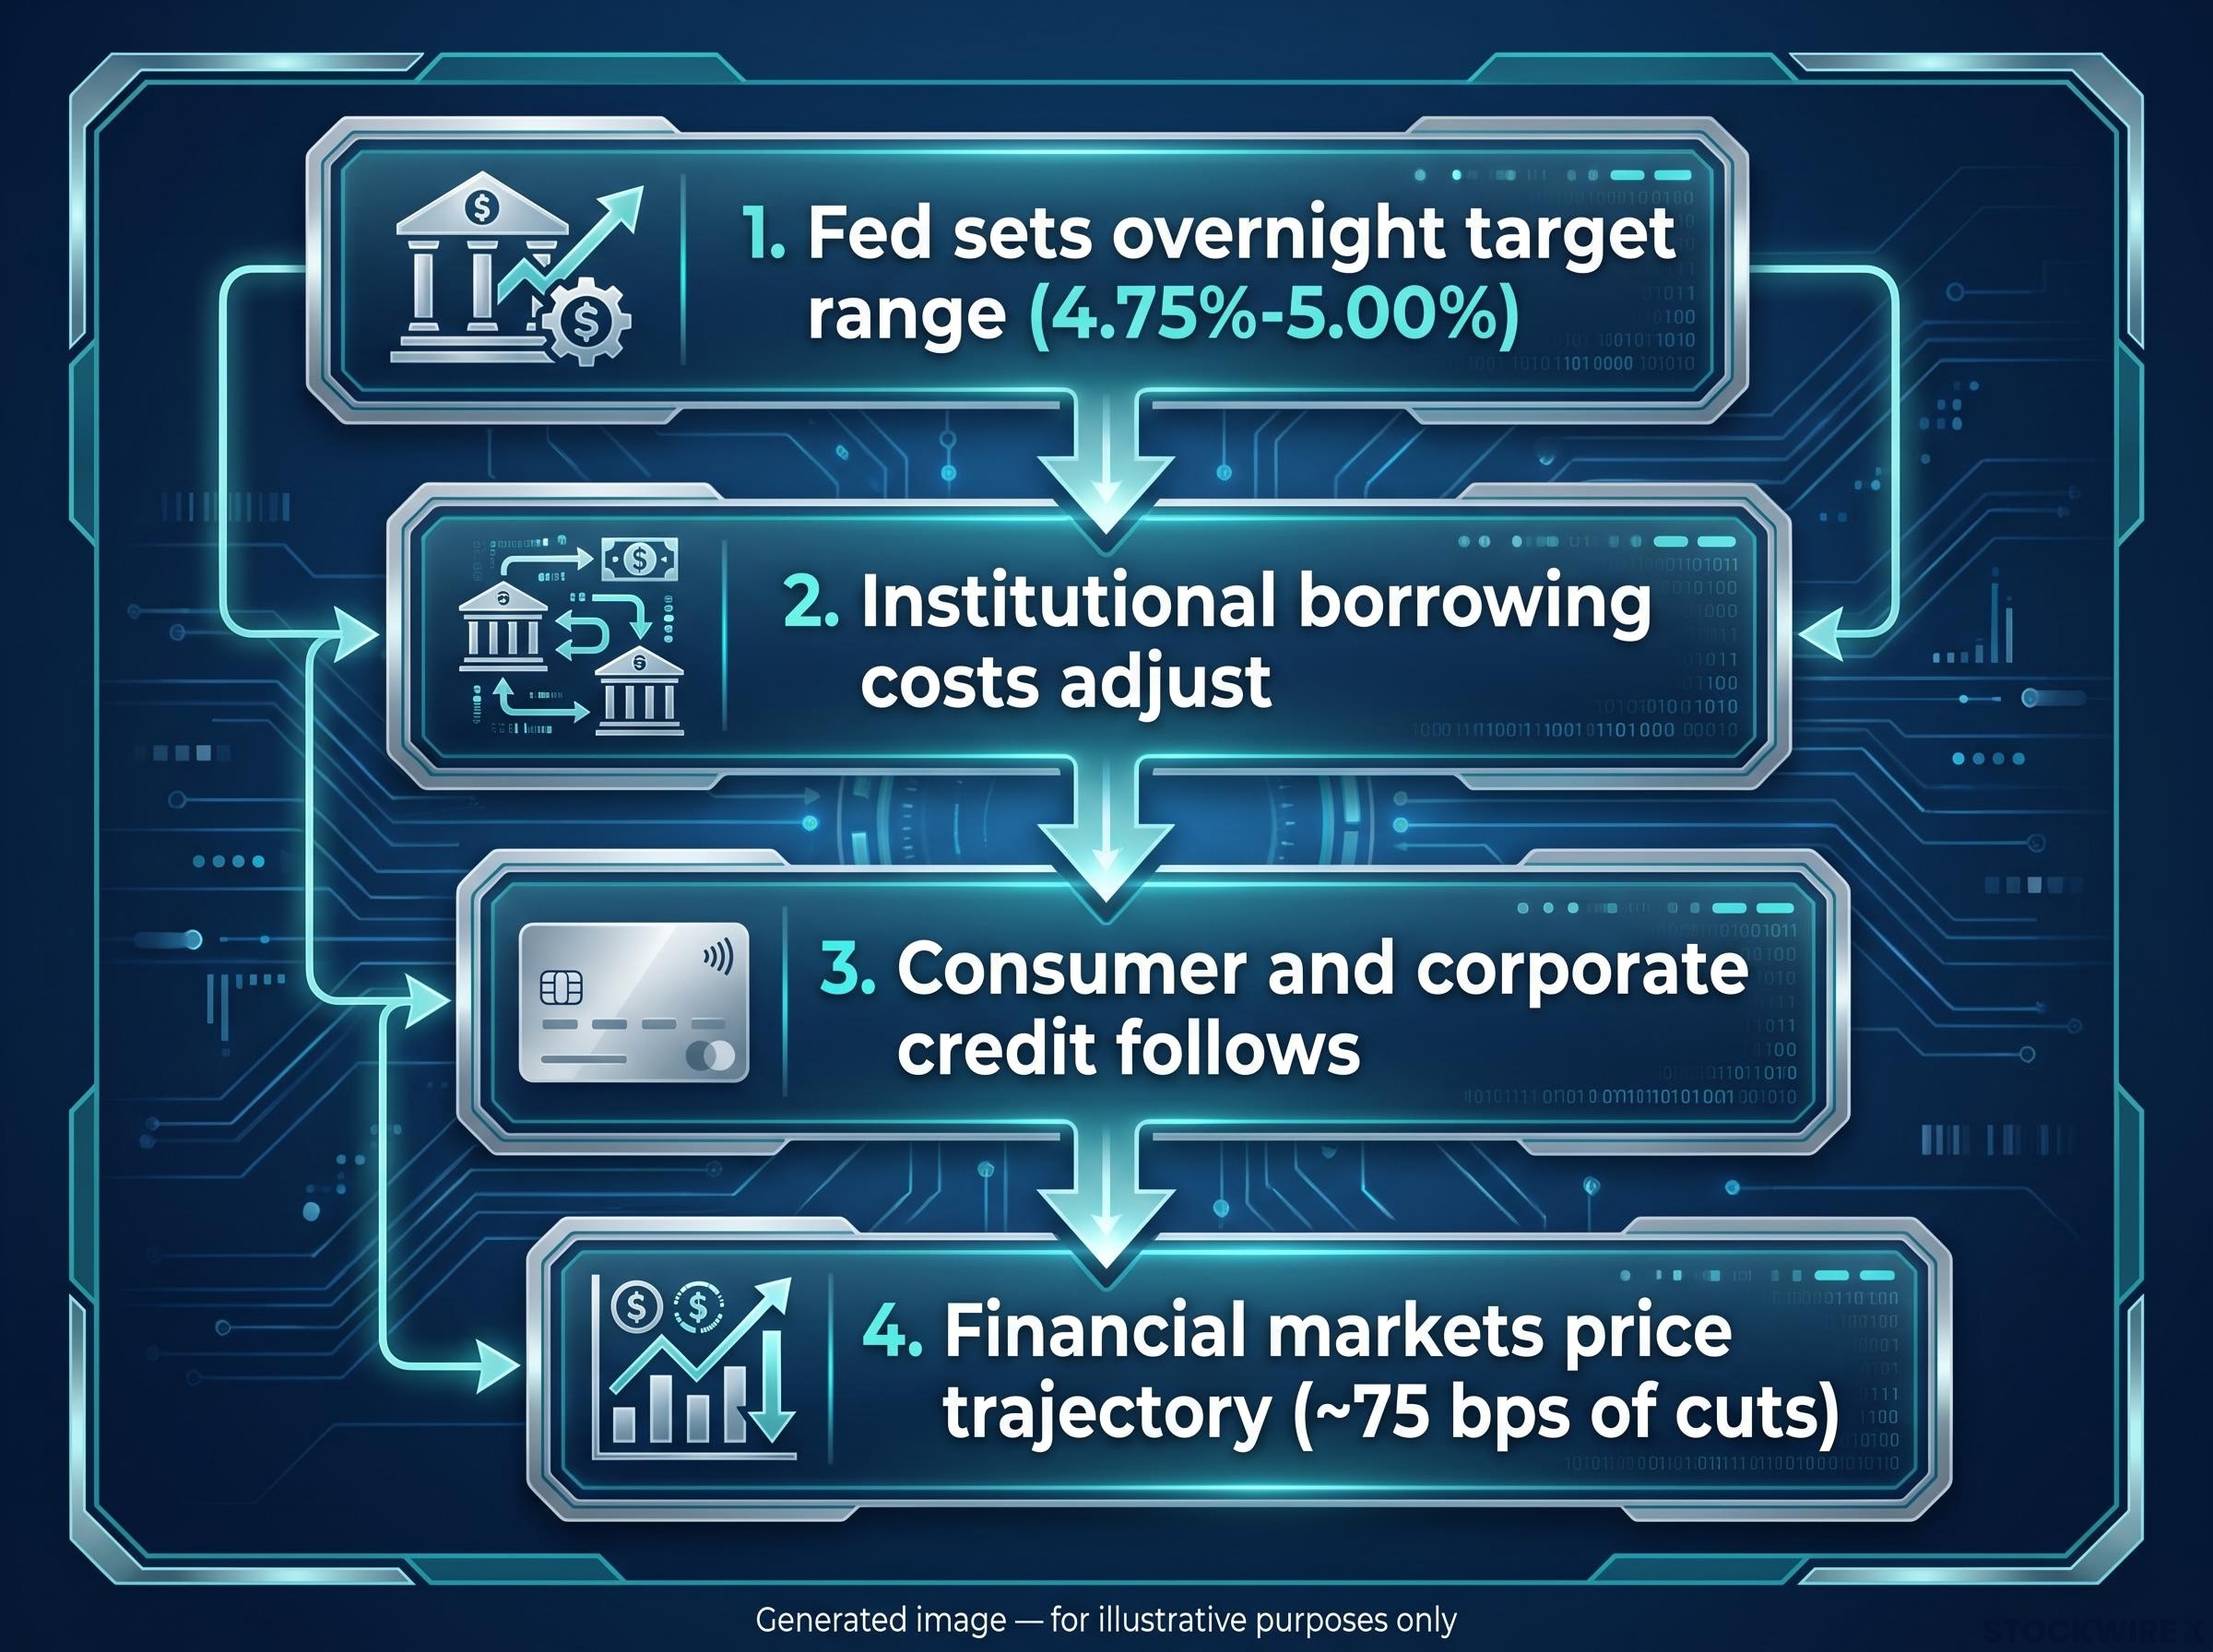
That last step is where most of the action lives. The Fed only controls one rate directly. Everything else, from your mortgage to the yield on a 10-year Treasury, is set by markets pricing where they think rates are heading.
The gap between what the Fed does and what traders expect can be wide. At the time of the September cut, the CME FedWatch Tool showed futures traders pricing in roughly 75 basis points of total cuts across the remainder of 2024, a deeper easing path than the Fed’s own projections signalled.
You need to understand this baseline because it is the engine driving the price of every asset you hold. When markets have already priced a cut before it lands, the actual announcement can barely register. When they are caught off guard, the same cut can move everything at once.
When big ASX news breaks, our subscribers know first
Why long-term Treasury yields often defy textbook rate cuts
If cheaper short-term money automatically pushed down long-term borrowing costs, the 10-year Treasury yield should have tumbled after a cut that large. It did not.
The yield had been trading near 3.9% in late August 2024. By the end of September, after the 50 basis point cut, it had settled around 3.72%-3.81%. That is a decline, but a mild one for such an aggressive move.
The reason sits in a piece of bond-market machinery most investors never think about.
Decoding the term premium
A long-term yield is not one number. It is two things stacked together: the market’s expectation for where short-term rates will average over the next decade, plus a term premium.
The term premium is the extra compensation investors demand for locking money up for years rather than rolling it over month to month. It covers the risk that inflation surprises higher, or that the government floods the market with new debt, or that future rate expectations shift.
The term premium has since become an even more consequential variable: by mid-to-late 2026, ACM model estimates put the US 10-year term premium at roughly 70-80 basis points, a structural swing of around 220 basis points from the negative readings of March 2020, amplifying the same dynamic that capped long yields in September 2024.
Federal Reserve research, including work from the Federal Reserve Bank of San Francisco by economists Michael Bauer and Glenn Rudebusch, has repeatedly shown that yield-curve moves often reflect changing growth and inflation expectations rather than the policy rate alone. Former Fed Chair Ben Bernanke made a related point: if the Fed cuts to guard against near-term risks while staying committed to its inflation target, markets can lower short-term expectations while leaving long-term ones intact.
That is roughly what happened in September 2024. Much of the cut had already been anticipated and priced in before the meeting. On top of that, concerns about heavy Treasury issuance and fiscal deficits kept the term premium elevated, putting a floor under long yields even as the Fed eased.
Contrast this with quantitative easing, where a central bank actively buys long-dated bonds. That directly compresses long yields because the buyer of last resort is soaking up supply. A rate cut alone does no such thing.
Quantitative easing works through a fundamentally different channel than a rate cut: where a cut signals cheaper overnight money, QE directly purchases long-dated bonds from the market, compressing long yields by removing supply rather than by adjusting the overnight target.
The distance between the overnight cash rate and the 10-year yield tells you how much growth and inflation risk the bond market is pricing in. That gap, not the Fed’s headline decision, is what should shape your fixed income duration bets.
The US dollar tug of war between yield and safe haven flows
Bonds are a domestic story. Currencies are a relative one, and that shift in perspective is where the picture gets more interesting.
The US dollar does not have a fixed reaction to rate cuts. It is caught between two opposing forces, and September 2024 showed both fighting it out in real time.
The bearish case is straightforward. When the Fed cuts faster than other major central banks, the yield advantage of holding dollars narrows. Capital that parked in the US for higher returns starts looking abroad.
When the domestic rate advantage shrinks, global capital rotates toward higher-yielding currencies elsewhere. That flow is what pushes the dollar down, and it is why aggressive easing is often read as structurally negative for the currency.
That is exactly what appeared immediately after the decision. The dollar index (DXY) touched 100.21, its lowest level since July 2023, while sterling, the Australian dollar, and the Norwegian krone outperformed. Across the quarter, the index fell from roughly 105.901 on 1 July to about 100.779 by 30 September.
But the counterargument is just as real. The dollar is the world’s safe-haven currency. In moments of global stress, investors buy dollars regardless of the yield on offer.
That is why the move was choppy rather than one-directional. On the day of the cut itself, DXY actually edged up 0.05% to 100.970, as Fed Chair Jerome Powell’s cautious tone curbed expectations for rapid future easing. According to Mesirow’s analysis, the dollar sank on the announcement, then recovered ground as that caution sank in.
Watching these currency flows shows you where global capital is hunting for the best risk-adjusted returns. It is an early warning for broader equity and credit moves, and it directly affects the multinationals in your portfolio whose overseas earnings swing with the exchange rate.
Uncoupling gold and oil in a rate reduction environment
Nothing dismantles the “one cut, one reaction” myth more cleanly than putting gold and oil side by side. Both are commodities. In September 2024 they behaved like they lived on different planets.
Gold is fundamentally a monetary asset. It pays no yield, so its appeal rises when real yields fall and the opportunity cost of holding it drops. A rate cut does exactly that, and gold responded with force.
Spot gold surged to an intraday record of $2,685 per ounce on 26 September, closing the month up between 4.6% and 5.24% depending on the measurement date. The World Gold Council explicitly tied the rally to the jumbo cut and the concurrent slide in the dollar. Its historical data shows gold has returned roughly 6% on average in the six months following the start of a cutting cycle.
Oil tells the opposite story. It is a physical asset, priced by how much the world actually consumes, what OPEC+ decides to pump, and where the next geopolitical flare-up erupts.
Despite the weaker dollar, which in theory makes oil cheaper for non-dollar buyers, Brent crude averaged only about $74 per barrel in September 2024. Concerns about soft demand and ample supply drowned out any monetary tailwind. As the International Energy Agency and others have long noted, the dollar effect on oil is usually secondary to supply and demand fundamentals.
| Factor | Gold | Oil |
|---|---|---|
| Primary driver | Monetary: real yields and rate expectations | Physical: global consumption and supply |
| Sensitivity | Falls in real yields lift it | Growth and OPEC+ output decisions |
| September 2024 result | Record high $2,685/oz, +4.6% to 5.24% | Roughly flat, ~$74/barrel average |
By treating gold and oil as distinct categories rather than a single commodity block, you can hedge against monetary devaluation and physical supply shocks separately. That distinction saves you from the common error of buying a broad commodity index on the assumption that a falling dollar lifts every raw material equally. It does not.
Economic indicators that override central bank policy
Here is the deeper truth the September 2024 episode reveals: the cut itself mattered far less than the economy it was cutting into.
A rate cut is only as bullish or bearish as the growth backdrop surrounding it. Markets read the same 50 basis points completely differently depending on whether business activity is expanding or shrinking. Solid growth turns a cut into a mid-cycle tune-up. Weak growth turns it into a recession warning.
The clearest read on that backdrop comes from S&P Global’s Purchasing Managers Index, a survey-based gauge that is the earliest monthly signal of business activity. A reading above 50 means expansion, below 50 means contraction. Here is what September 2024 showed:
- Composite PMI: 54.4 (down slightly from 54.6 in August), signalling steady overall expansion.
- Services PMI: 55.4, showing solid growth in the largest part of the economy.
- Manufacturing PMI: 47.0, indicating factory-sector contraction.
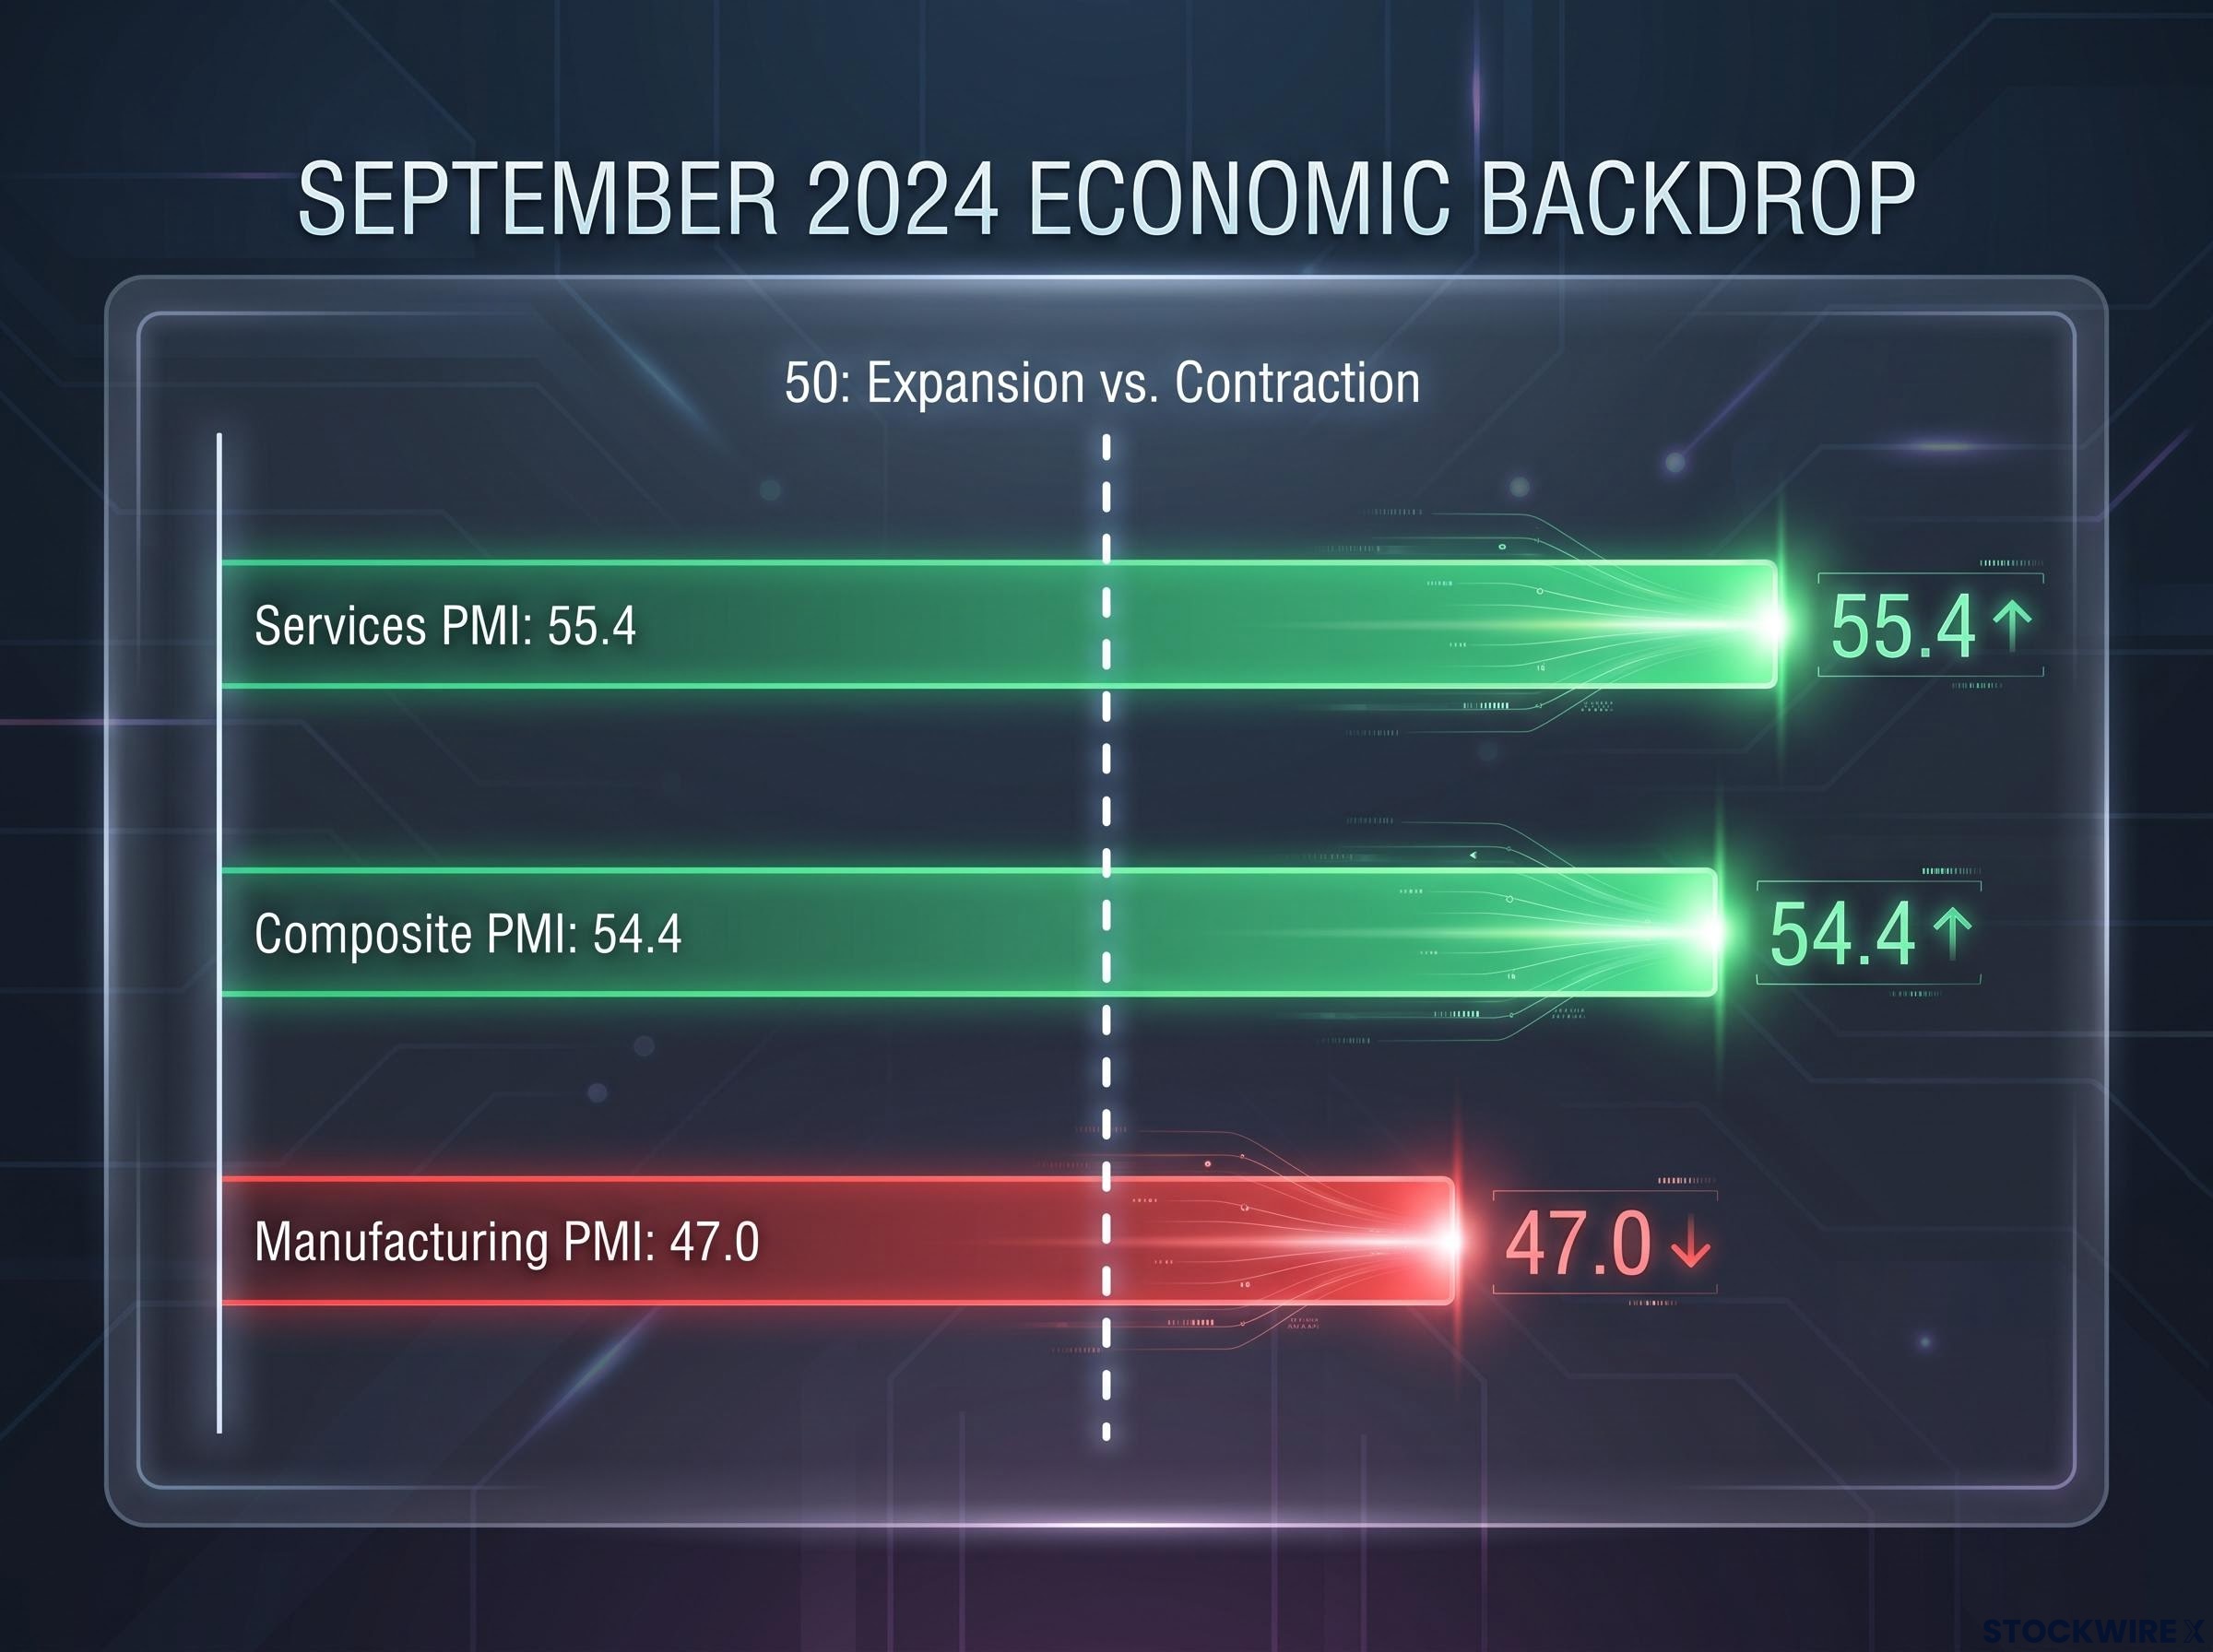
That mix, a healthy services economy alongside a struggling manufacturing sector, framed the 2024 cut as an adjustment into ongoing growth rather than an emergency rescue. It echoes the 2019 “insurance” cuts, when the Fed eased into a resilient economy and risk assets held their gains, rather than the panicked cuts of 2008.
You have to look past the headline decision and read the PMI direction. Whether purchasing managers report expansion or contraction is what ultimately determines your portfolio’s real downside risk, not the rate cut on its own.
For investors wanting to apply this framework to live releases, our dedicated guide to reading PMI data walks through the four-step professional method for disaggregating composite headlines into their forward-looking sub-indices before official GDP figures arrive.
Applying the September 2024 playbook to future easing cycles
The lesson from September 2024 is that asset reactions to easing are conditional, not automatic. Whether a cut lifts your holdings depends on starting valuations, the term premium buried in long yields, and the underlying health of the economy.
Gold rallied because real yields fell. Long yields barely moved because the market had already priced the cut and the term premium held firm. The dollar wobbled rather than collapsed because safe-haven demand offset the narrowing yield gap. Oil sat still because supply and demand outweighed monetary policy.
Use this as a structural framework rather than leaning on historical averages, which flatten out exactly the conditions that matter. When the next easing cycle arrives, parse the difference between policy intent and economic reality, then watch whether global central banks are cutting in coordination or at cross purposes. That reading remains the most valuable skill in modern asset allocation.
This article is for informational purposes only and should not be considered financial advice. Investors should conduct their own research and consult with financial professionals before making investment decisions. Past performance does not guarantee future results, and financial projections are subject to market conditions and various risk factors.