
The gold market is stuck in a high-stakes technical bottleneck right now, and traders are split on what happens next. Is the precious metal quietly building strength for a breakout, or is it perched on the edge of a steep correction?
As of late September 2026, spot gold (XAU/USD) is trading in a tight consolidation band in the mid-US$4,300s, squeezed between conflicting moving averages and momentum signals that refuse to pick a side. Trading this specific chart setup means moving past simple trend following and learning how overlapping technical clusters shape where the big money actually acts.
Here is a clear framework for reading the current gold chart. By the time you finish, you will know exactly which support and resistance levels matter, which ones are noise, and how to position for the breakout when it finally comes.
Understanding the foundation of charting precious metals
Gold is one of the most liquid, macro-sensitive assets on the planet, and that liquidity is precisely why it respects technical levels so reliably. When millions of participants watch the same chart, the lines on that chart stop being abstract and start becoming visible footprints of supply and demand.
Think of a support or resistance level as a place where large market participants have historically stepped in to buy or sell. Those decisions cluster at predictable price points, and the more traders who see the same level, the more likely it is to trigger a reaction.
This guide leans on three core tools. Moving averages smooth out price to reveal the underlying trend. Momentum oscillators, specifically the Relative Strength Index (RSI) and the Moving Average Convergence Divergence (MACD), measure the speed and conviction behind a move. And Fibonacci retracements map the levels where a pullback is likely to pause or reverse.
None of these tools predict the future. What they do is highlight high-probability zones where major players are most likely to act. Major institutions, for instance, closely monitor structural dividers such as the 200-day moving average as a line between long-term strength and weakness.
The trap most traders fall into is trusting a single indicator. Any one signal produces false readings often enough to burn you, which is why confluence, several tools pointing to the same level, is what actually matters.
Keep these limitations in mind as you read the rest of this guide:
- A single indicator frequently produces false readings, especially in choppy markets.
- Moving averages are retrospective, they describe where price has been, not where it must go.
- Fibonacci levels represent probabilities, not certainties, and can fail entirely.
- A strong fundamental shock, a surprise Fed decision or a geopolitical flare-up, can overwhelm every technical cluster on the chart.
Understanding this framework gives you a probabilistic edge. It trains you to wait for confirmed signals rather than guessing at random price wobbles, and it filters out the daily noise that lures traders into over-trading a sideways market.
When big ASX news breaks, our subscribers know first
Navigating the moving average decision zone
Look at the current gold chart and you can feel the tension. Spot gold is wedged tightly around its 100-day moving average, with the near-term bias reading mixed to modestly bearish.
The most recent spot quotes put the metal firmly in the mid-US$4,300s, with a daily range of roughly US$4,339 to US$4,376 across 21-22 September 2026. That is a narrow band, and narrow bands are where breakouts get built.
The complication is that the 100-day moving average is not one clean line. It depends on the calculation you use.
The 100-day Exponential Moving Average (EMA), which weights recent prices more heavily, is positioned as resistance between roughly US$4,368 and US$4,377. The 100-day Simple Moving Average (SMA), which treats all prices in the window equally, sits lower near US$4,328 to US$4,329. That gap matters, because it means gold is currently trading above one version of the trend line and below the other.
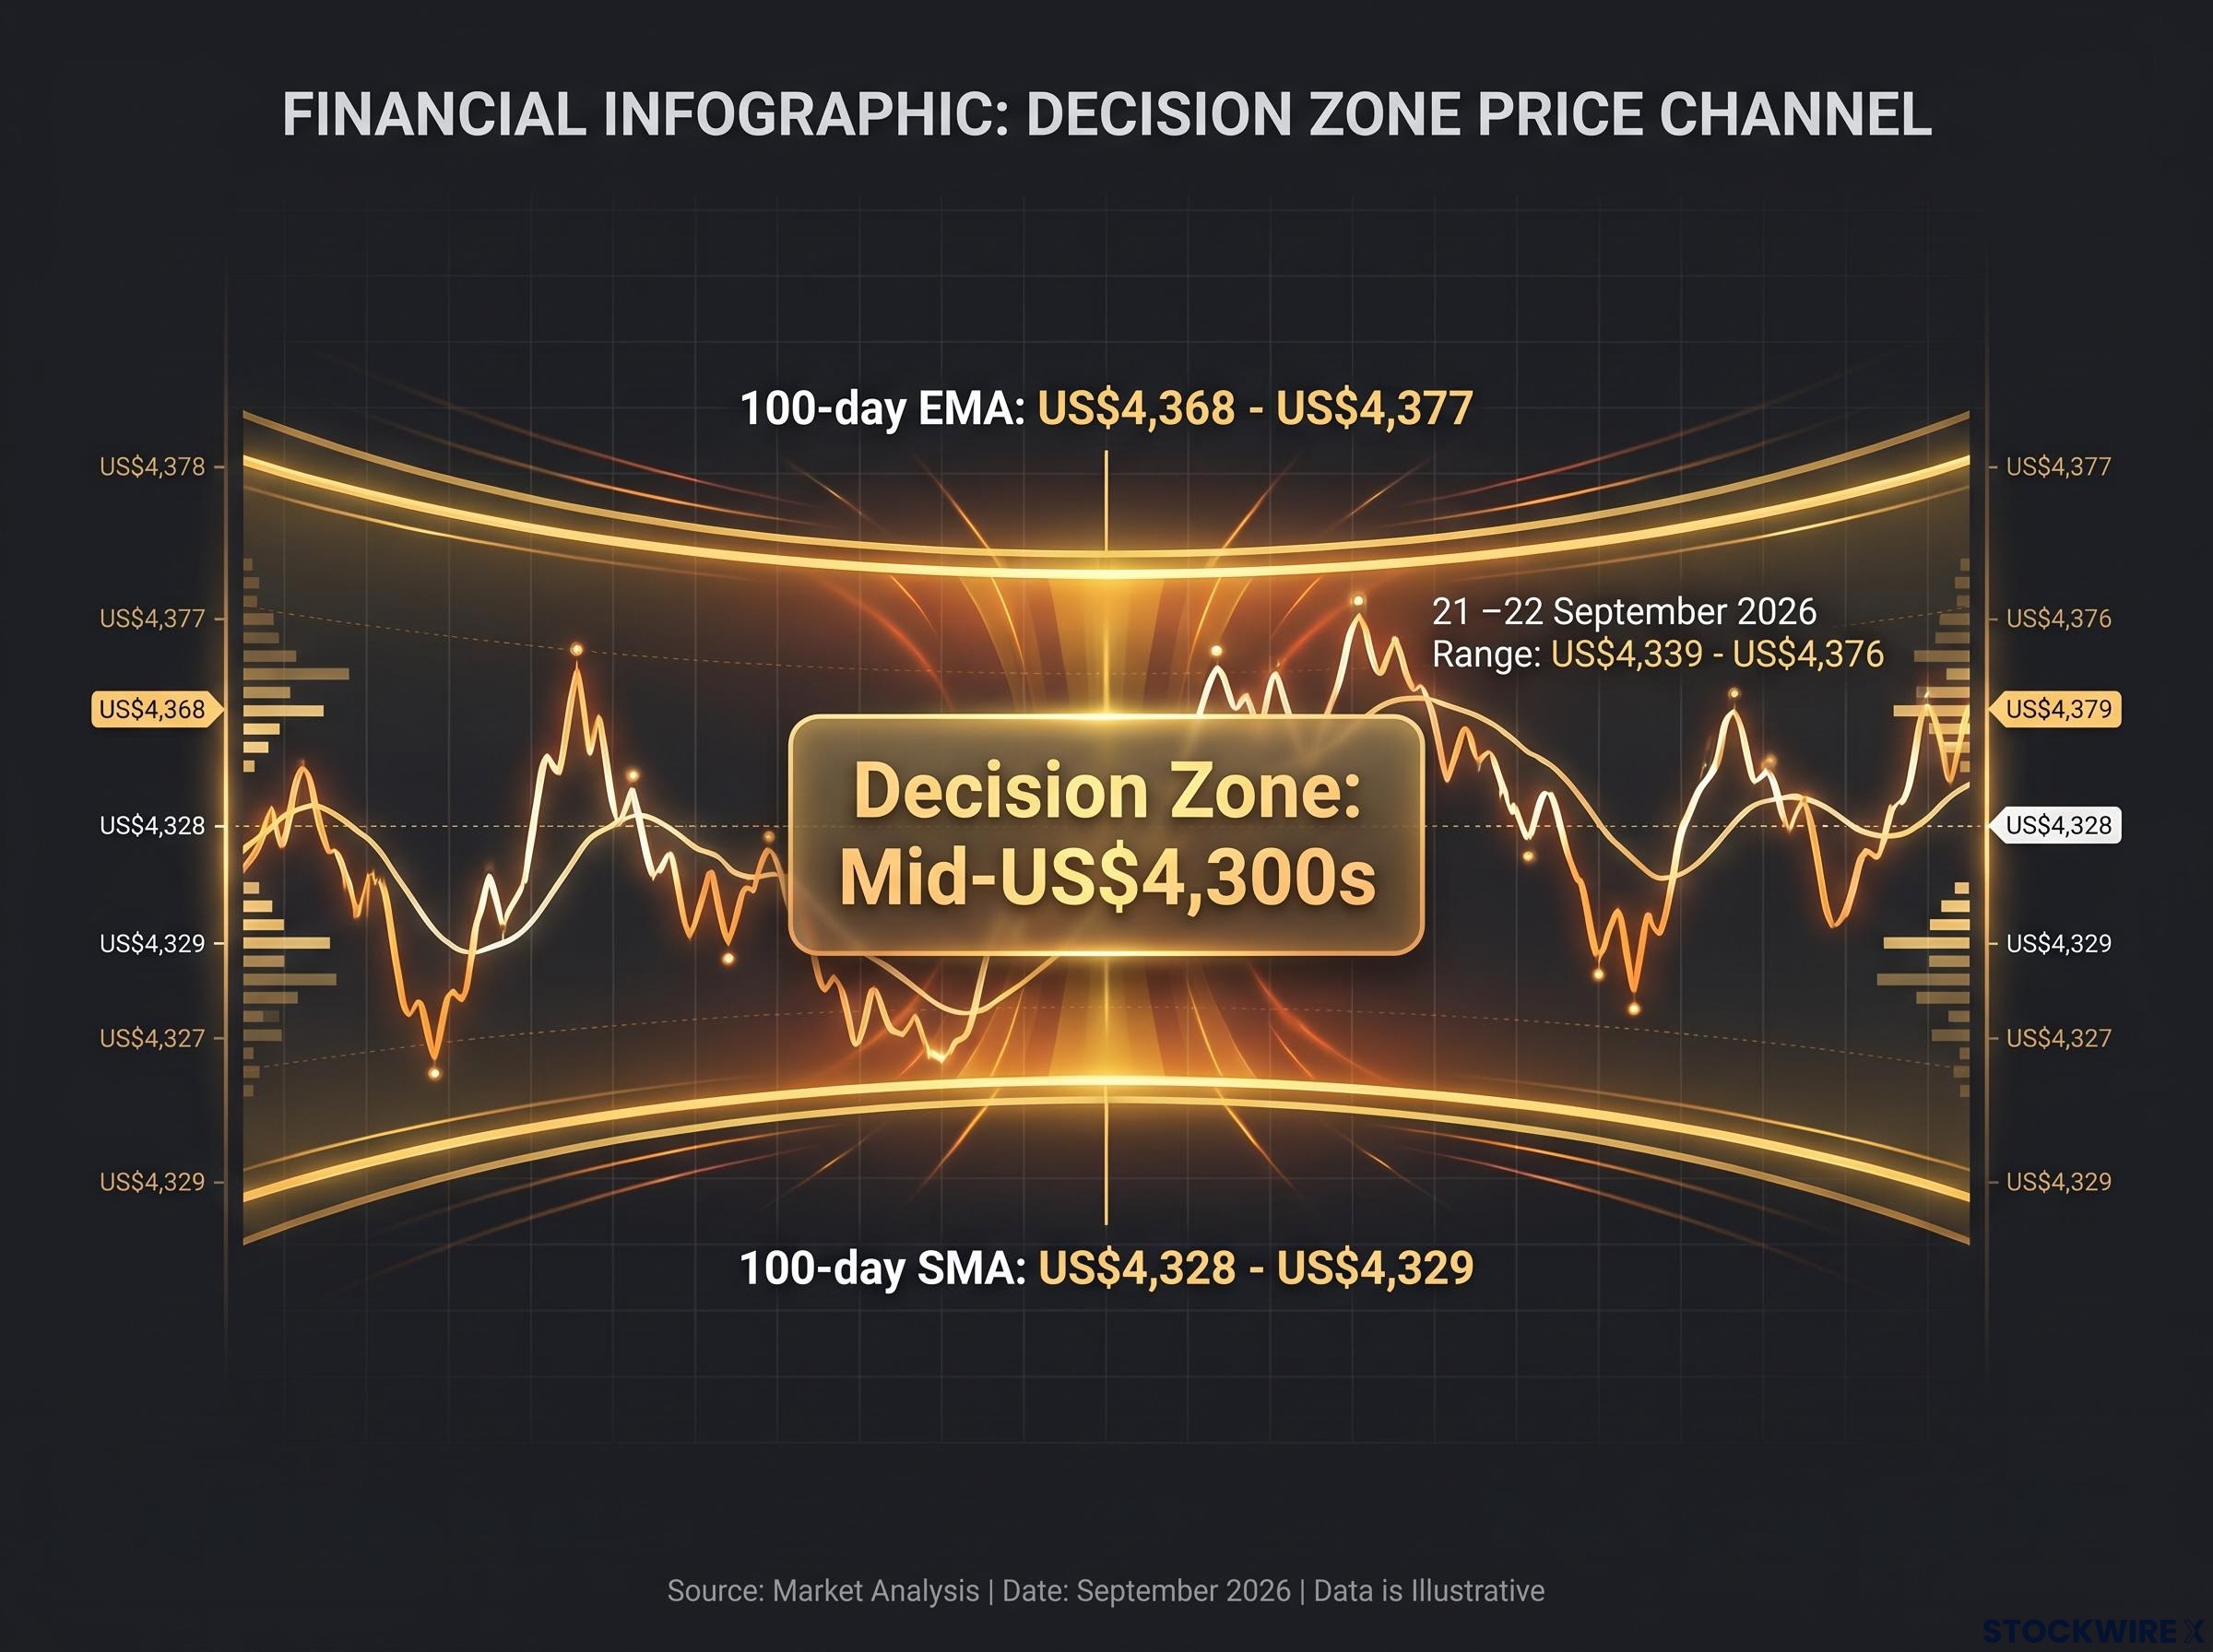
The Decision Zone When price sits between two conflicting moving averages, neither the bulls nor the bears are in control. Treat this entire area as a neutral battleground. The market has not chosen a direction yet, and pretending it has is how you get whipsawed.
So what would actually shift the tone from bearish to bullish? A definitive daily close above the 100-day EMA and its associated Fibonacci cluster. Not an intraday spike, not a brief poke above the level, but a confirmed close that holds.
That distinction protects your capital. Recognising a market in consolidation stops you from being chopped up by intraday volatility, and it tells you exactly which threshold confirms a genuine trend change versus a temporary fake-out.
Because gold is pinned between these conflicting averages, the disciplined move is to wait. Let the market print a clear daily close outside this range before you commit meaningful capital.
Reading the RSI and MACD momentum signals
Momentum indicators sound intimidating, but the current reading tells a simple story: the downward pressure is fading, yet nobody is buying with conviction. That combination produces a non-trending, sideways market.
The 14-period RSI, which measures whether an asset is overbought or oversold on a scale of 0 to 100, is sitting in the low-to-mid 40s, with readings ranging from 43.06 to 49.59 across different data feeds. Anything in that zone is textbook neutral territory, neither stretched to the downside nor building upward steam.
The MACD (12,26), which tracks the relationship between two moving averages to gauge momentum, is hovering near zero. Its negative profile is contracting, meaning the selling pressure is easing, but it has not flipped to confirm an upside reversal.
Put the two together and the picture is clear. Downward momentum is slowing, upward conviction is absent, and the market is drifting. This is exactly the environment where experienced analysts warn against forcing a trend trade.
Those flat readings are a direct warning for your portfolio. They tell you to reduce leverage and avoid aggressive directional bets until real momentum returns to the tape.
Adjusting tactics for flat momentum
The standard RSI rules break down in markets like this one. The classic thresholds of 30 and 70 that signal oversold and overbought conditions are far less reliable than watching for price divergence, where price makes a new high or low but the indicator refuses to follow. Divergence often flags a genuine turn well before the raw threshold does.
MACD suffers a similar problem in choppy conditions. Its signals whipsaw constantly when price is ranging, generating buy and sell crossovers that lead nowhere. When that happens, stop trading the major swings and focus instead on the smaller range boundaries.
Momentum indicators reveal the velocity behind a move. Reading them correctly protects your capital during stagnant stretches and preserves your ammunition for the high-probability, trending markets that actually reward directional bets.
Mapping the Fibonacci support and resistance grid
Fibonacci retracements turn a vague chart into an architectural blueprint. They measure how far a pullback has retraced a prior move, and the key ratios mark the levels where dip-buyers and short-sellers are most likely to appear.
For the current setup, the relevant reference is the broader summer rally from a late-June low near US$4,015 to a recent high around US$4,755. Draw the retracements from that swing and you get a clean map of the immediate battlefield.
| Retracement level | Price target (US$) | Technical significance |
|---|---|---|
| 23.6% | US$4,516 to US$4,520 | Upper resistance overlapping prior supply |
| 38.2% | US$4,408 to US$4,413 | Overhead resistance capping rallies |
| 50.0% | US$4,320 to US$4,326 | Fragile near-term support floor |
| 61.8% | US$4,298 | Critical support, actively defended |
The real power comes from Fibonacci clusters, areas where multiple retracements stack up alongside moving averages within a tight band. Notice how the 50% retracement near US$4,320, the 100-day EMA around US$4,368, and the 38.2% level near US$4,408 form successive layers of structural significance. Where several tools agree, the level carries far more weight.
That defended behaviour is not theoretical. According to Kitco, the 61.8% retracement at US$4,298 held firm right after a hawkish Fed quarter-point hike, with gold dipping just below it intraday before recovering to close above, a live demonstration of active technical demand.
Below that critical US$4,298 floor, the deeper supports come into play: the rising 55-day average near US$4,250, followed by structural levels at US$4,116 and US$3,959 if selling pressure genuinely extends.
Map these exact levels onto your own charts and they become objective parameters for stop-loss orders and profit targets. That removes emotion from trade management and anchors your risk to solid mathematical points rather than arbitrary guesses about where price “feels” cheap or expensive.
Formulating a strategy in the current decision zone
The market is currently split into three camps, and understanding all three is how you build a game plan that survives whatever comes next.
The bearish-continuation camp points to hawkish Fed policy, rising yields, and a strong US Dollar, arguing that gold stays capped and drifts toward downside targets in the US$4,170 to US$4,234 zone. The bullish-recovery camp highlights those fiercely defended Fibonacci levels, arguing that if gold reclaims the 100-day average and the US$4,370 to US$4,400 band, the door opens to recovery targets at US$4,400, US$4,500, and US$4,600. The neutral camp, including the World Gold Council, simply treats this as a range-bound phase inside a longer structural bull market.
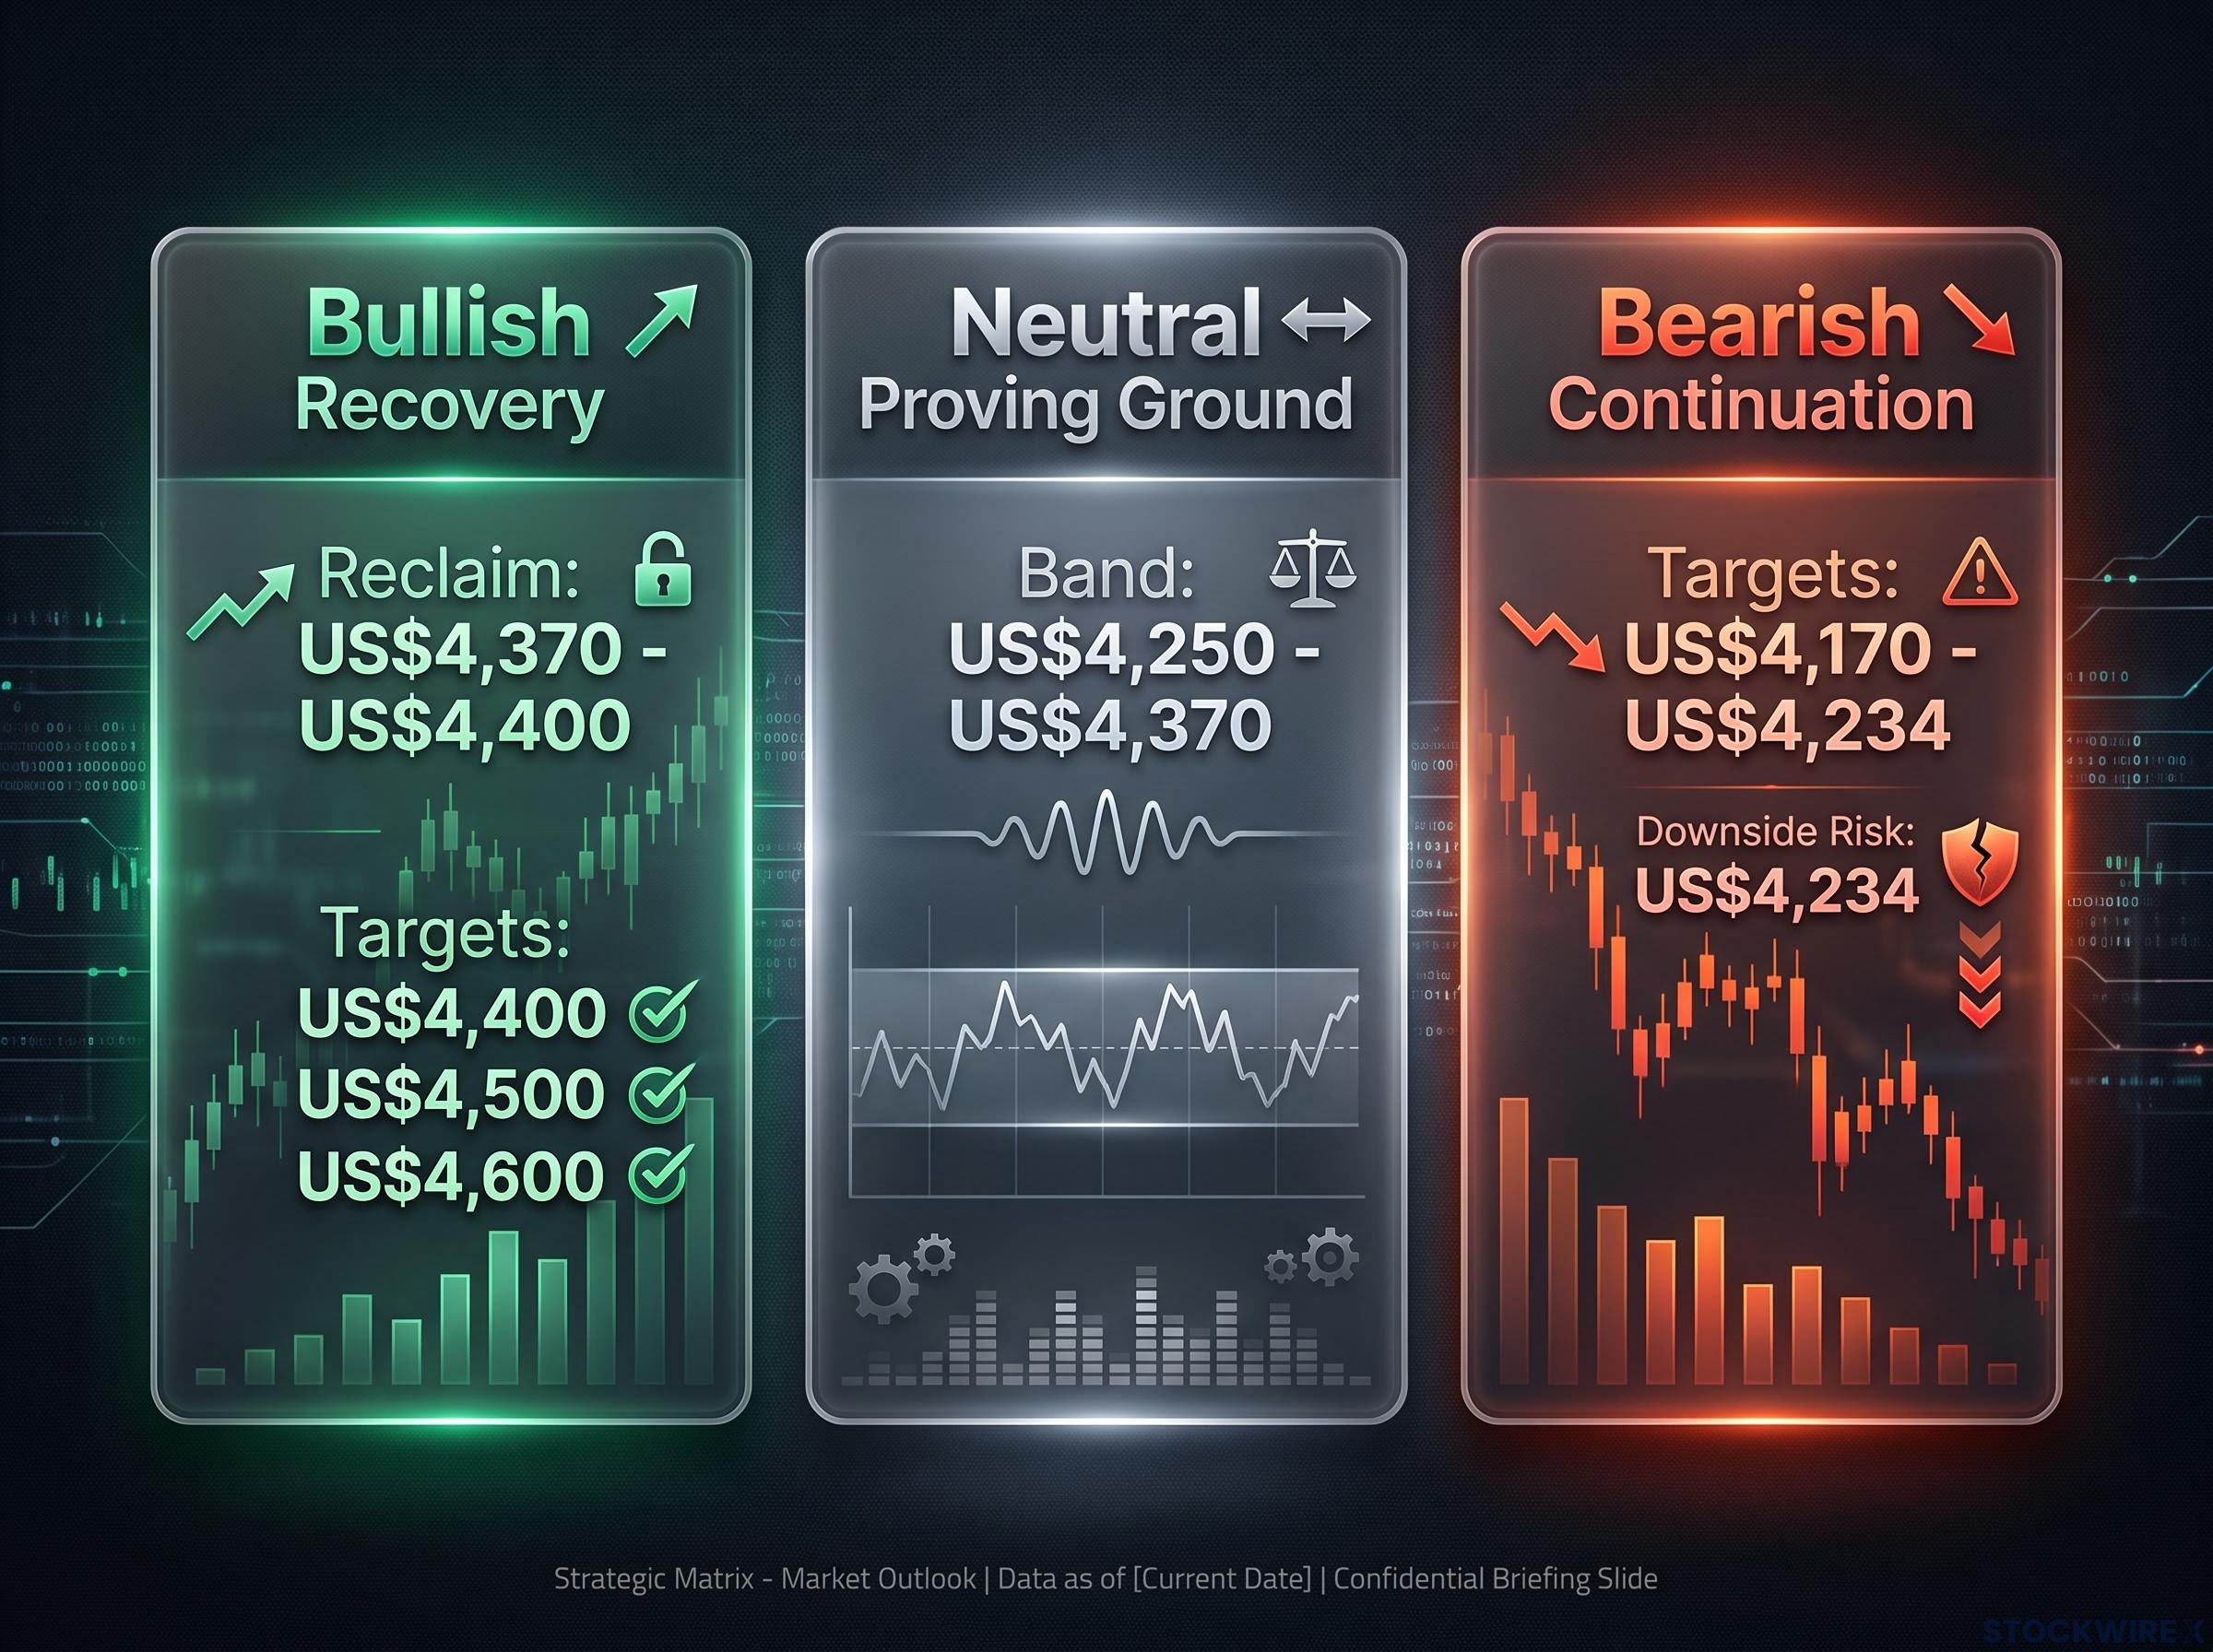
The US$4,250 to US$4,370 band is the proving ground. Movement inside it is noise; a confirmed daily close beyond it is your signal to act, up or down.
Actively monitor those daily closes. Respect the longer-term uptrend and favour buying dips at major structural supports over aggressive shorting, but stay alert, because a fundamental shock can overwhelm even the tightest technical cluster.
This article is for informational purposes only and should not be considered financial advice. Investors should conduct their own research and consult with financial professionals before making investment decisions. Past performance does not guarantee future results, and these technical scenarios are speculative and subject to change based on market developments.