
In one week this September, three of the world’s most influential central banks set interest rates. The Federal Reserve, the Bank of England, and the Bank of Japan each delivered a verdict, and each reached a different conclusion from what was, broadly, the same global backdrop.
That divergence is the story. The August 2026 data feeding those decisions, covering the US, UK, Eurozone, Japan, and China, landed alongside the rate calls in the week of 14-18 September 2026, and the picture it paints is anything but synchronised. This is a world that has drifted a long way from the co-ordinated tightening cycle of the early 2020s.
Here is a structured read on where each major economy actually stands after that week, and what the gaps between them signal for anyone tracking global macro conditions heading into the final quarter of the year.
The US consumer holds, but the goods sector flashes a warning
The clearest positive signal of the week came from the American shopper. US retail and food services sales reached $773.9 billion in August 2026, according to the US Census Bureau advance estimate released on 15 September 2026. That figure rose 1.2% month-over-month and 6.0% year-over-year, and both measures beat consensus analyst estimates.
On its own, that number reads as unambiguous strength. Demand is not fading; it is accelerating.
Manufacturing underperforms while consumers keep spending
Then the industrial data arrived, and the confidence softens. The Federal Reserve’s G.17 release on 17 September 2026 showed total US industrial production was flat at 0.0% month-over-month, with the index sitting at 103.1% of its 2017 average, a 1.4% annual gain.
Manufacturing specifically fell 0.3% month-over-month and grew just 0.9% year-over-year. Both manufacturing readings came in below analyst forecasts, which makes the miss more telling than the absolute level alone: the goods-producing side of the economy did not just slow, it undershot what analysts already expected.
Hold the two figures together and the divergence becomes the point.
- US retail and food services sales: $773.9 billion, +1.2% month-over-month, +6.0% year-over-year (US Census Bureau, 15 September 2026)
- US industrial production: 0.0% month-over-month, +1.4% year-over-year, index at 103.1% of 2017 average (Federal Reserve G.17, 17 September 2026)
- US manufacturing production: -0.3% month-over-month, +0.9% year-over-year, both below analyst forecasts
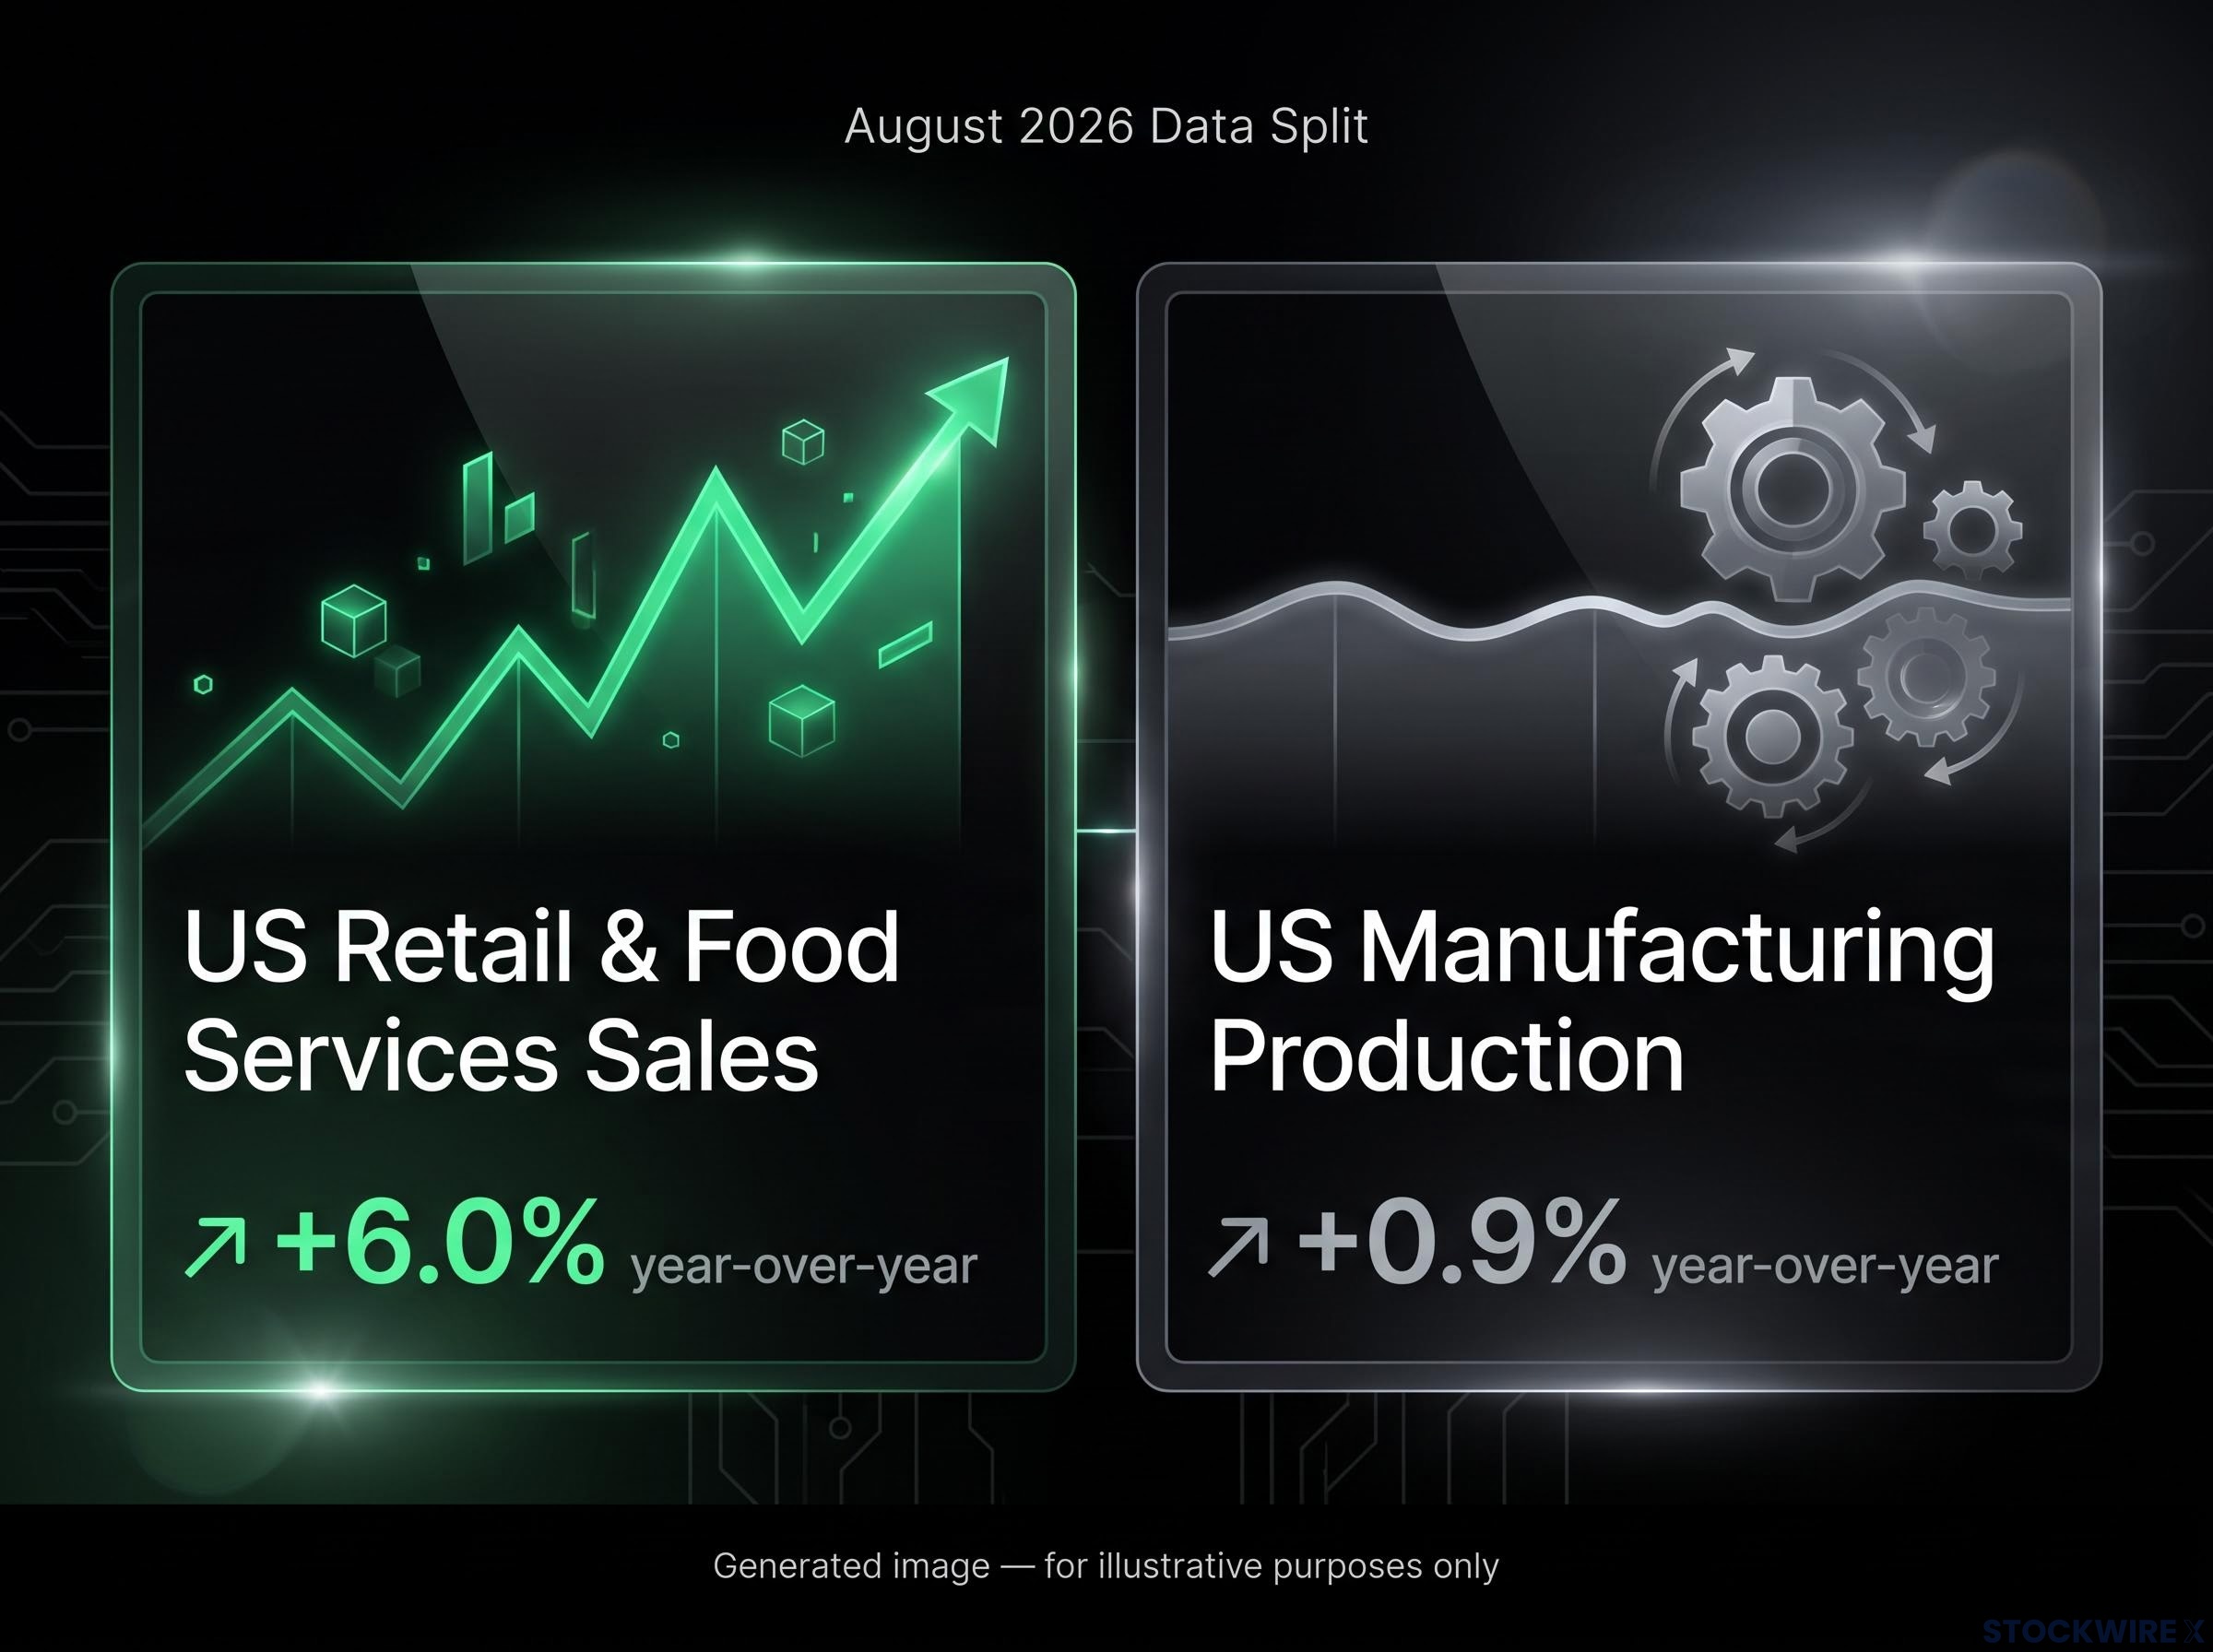
The spread between a 6.0% annual gain in retail and a 0.9% annual gain in manufacturing tells you that US growth is being carried almost entirely by the consumer right now. That concentration is worth watching as a potential vulnerability rather than treating it as a straightforward strength. A consumption-led expansion is durable only for as long as the consumer stays confident, and a soft goods sector removes one of the cushions if that confidence slips.
The gap between strong aggregate retail figures and a soft goods-producing sector has a direct read-through to consumer sector valuations: the Consumer Discretionary index sat negative year-to-date through late July 2026 even as FactSet spending data showed leisure and apparel above January 2025 baseline levels, suggesting equity markets and spending data are pricing very different outcomes.
When big ASX news breaks, our subscribers know first
Three central banks, three different conclusions from the same macro environment
The same week that produced the mixed US data also produced three rate decisions, and the interesting part is how little they agreed. The Fed raised, the Bank of England held, and the Bank of Japan raised. Same global inflation and growth environment, three separate readings of it.
The concept of central bank divergence has been building since early 2026, when the Fed, ECB, and BoJ each held rates at the same meeting yet faced fundamentally different growth-inflation trade-offs that made those holds analytically distinct.
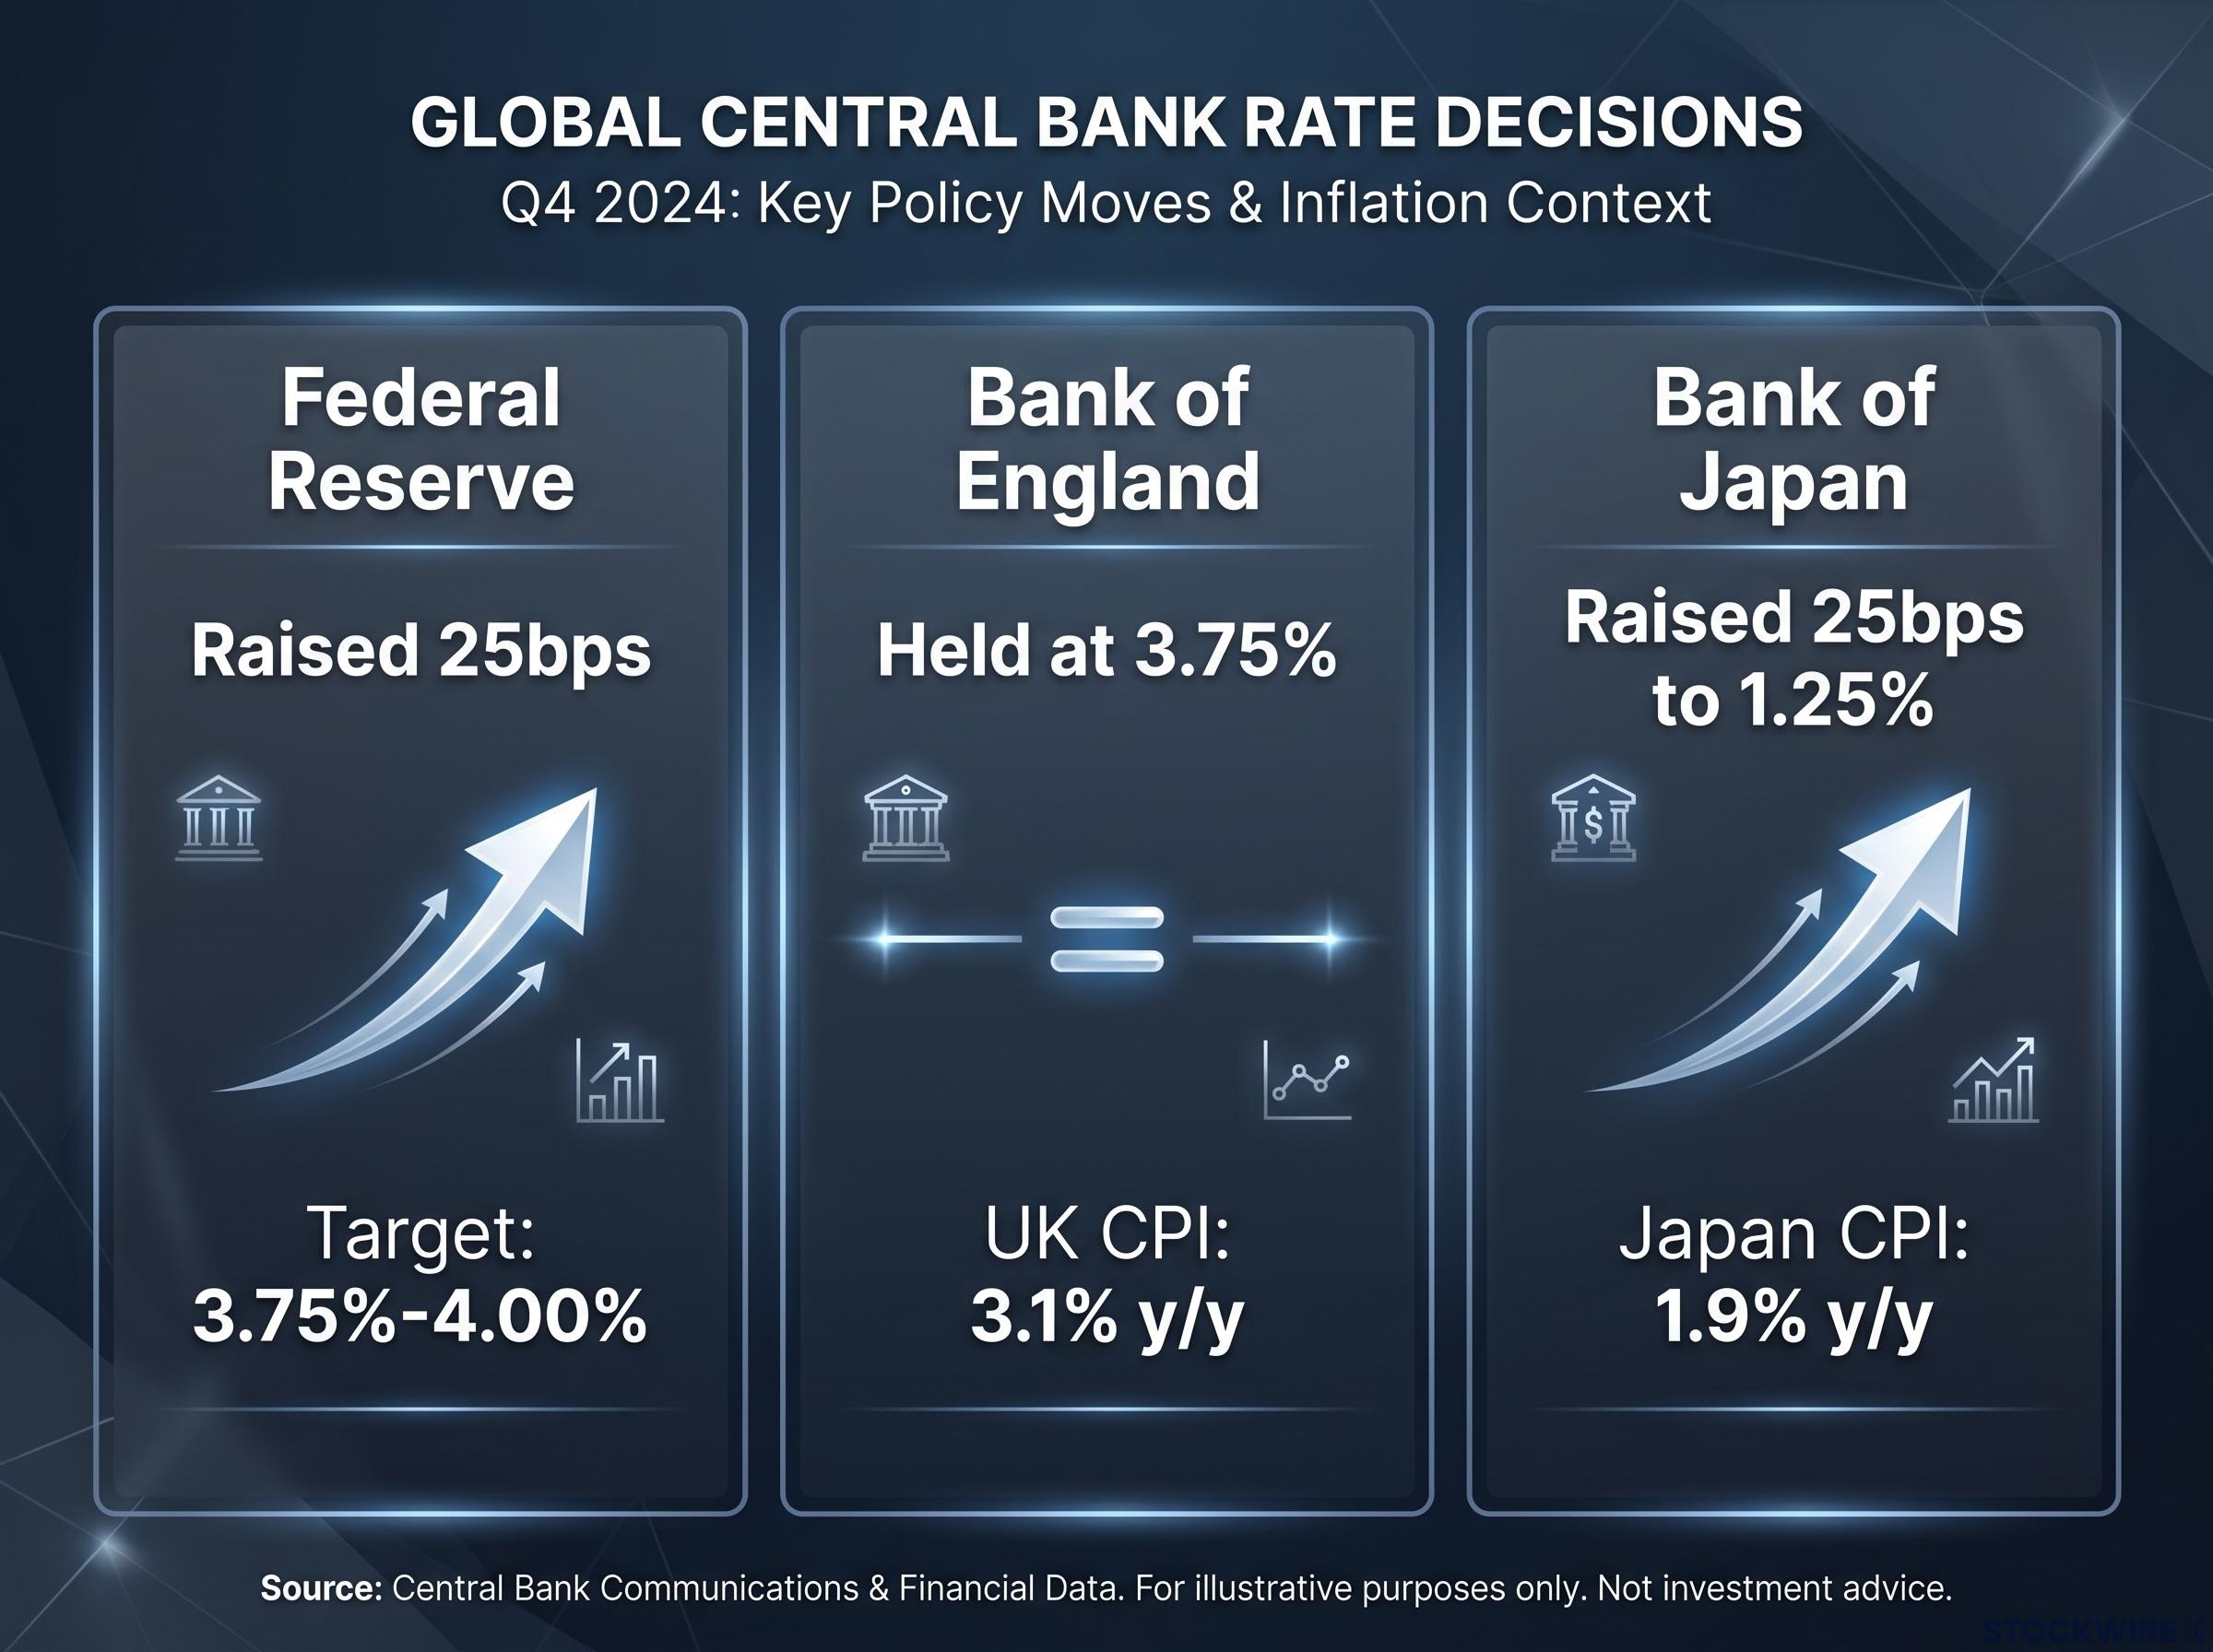
| Central Bank | Decision | Key domestic context |
|---|---|---|
| Federal Reserve | Raised 25bps to 3.75%-4.00% | Widely anticipated; markets had already priced it in |
| Bank of England | Held at 3.75% | UK CPI at 3.1% y/y, core 2.6% y/y; retail sales outperforming |
| Bank of Japan | Raised 25bps to 1.25% | Headline and core-core CPI both at 1.9% y/y, below 2% target |
The Fed’s move to a 3.75%-4.00% target range surprised no one. It was a step markets had already built into their pricing, and its standalone impact looks modest.
Fisher Investments on the Fed move In its 17 September 2026 commentary titled “The Ineffectual Fed Hike,” Fisher Investments described the hike as one the market had largely seen coming, arguing that a move of this kind, taken in isolation, carries little power to alter the trajectory of growth, inflation, or asset prices in any meaningful way.
The Bank of England took the opposite path, holding at 3.75% even with UK headline inflation running at 3.1% year-over-year and core at 2.6%, and with UK retail sales up 0.5% month-over-month and 2.4% year-over-year. Firm demand and above-target inflation, yet no move. That is a central bank prioritising something other than the headline inflation print.
The Bank of Japan is the most analytically interesting of the three. It raised to 1.25% while Japan’s headline consumer inflation sat at 1.9% year-over-year, with the core-core measure (excluding fresh food and energy) also at 1.9%. Both are below the BoJ’s stated 2% target. By conventional metrics, that inflation level does not yet fully justify tightening, yet the bank continued its exit from decades of ultra-loose policy anyway.
What this tells you is that a single global rate narrative no longer exists. Three major central banks facing broadly similar external conditions reached three different conclusions, which means monetary policy is now driven by domestic structural considerations as much as by global inflation dynamics. For anyone managing exposure across these regions, that divergence feeds directly into currency dynamics, bond positioning, and sector rotation. Rate moves that look similar in magnitude are doing very different work in each economy.
The Eurozone and China data problem: strong on the surface, softer underneath
The habit worth building from this week’s releases is reading macro data as a compound signal rather than a single number. Both the Eurozone and China delivered headline figures that suggest momentum, alongside sub-surface indicators that quietly argue the opposite.
Eurozone headline versus core: reading in opposite directions
Eurozone headline consumer inflation accelerated to 3.2% year-over-year in August 2026, up from 2.9% in July. A brief note on the figure: Eurostat’s preliminary estimate cited 3.3%, while FactSet and the later Trading Economics update corroborated 3.2%, which is the more widely confirmed reading.
The direction that matters, though, is what core inflation did at the same time. Core CPI (excluding energy, food, alcohol, and tobacco) slowed to 2.4% year-over-year even as the headline rose. That split is not the same thing as a uniform inflation surge; a headline pushed up by energy while underlying core pressure eases points to very different dynamics than a broad-based acceleration.
The backdrop makes it softer still. Eurozone industrial production for July 2026 fell 0.1% month-over-month and was flat year-over-year, so the headline inflation uptick sits on top of an already-weak production base.
China beats on activity, misses where it matters
China told the same two-layer story from a different angle. Industrial production rose 5.2% year-over-year and retail sales rose 1.1% year-over-year, both above analyst forecasts. The activity headlines beat.
China’s export dynamics add a further complication to the activity beat: Nomura estimates that integrated-circuit and data-processing exports alone accounted for roughly 45% of total export growth in August, concentrating the trade surge in a single AI-driven demand cycle rather than reflecting broad-based external strength.
| Indicator | Reading | Consensus | Beat or miss |
|---|---|---|---|
| Industrial production (y/y) | +5.2% | Below reading | Beat |
| Retail sales (y/y) | +1.1% | Below reading | Beat |
| Loan growth (y/y) | +4.9% | Above reading | Miss |
| Unemployment rate | 5.3% | Below reading | Miss (higher) |
The financial and labour signals are where it complicates. Loan growth came in at 4.9% year-over-year, below expectations, and unemployment ticked up to 5.3%, slightly above consensus. Money supply (M2) grew 7.5% year-over-year, which raises its own question: if M2 is expanding faster than credit is being extended, where is that money supply flowing if not into new lending?
The read to take from both economies is the same. When headline activity beats and sub-surface financial or labour indicators miss at the same time, the safer analytical posture is to treat the outperformance as fragile until credit and jobs data confirm it. This is precisely where the intuition that “above-forecast is good” tends to mislead. Give the second layer at least equal weight.
Japan’s breakout week and what the week of September 21 will confirm or complicate
If one economy stood out this week, it was Japan, and the trade data is why. August 2026 imports and exports both cleared forecasts by a wide margin.
Japan’s August trade surge Imports rose 28.0% year-over-year and exports rose 19.3% year-over-year, both above analyst forecasts (FactSet).
That external strength arrived against a more mixed domestic backdrop. Japan’s July industrial production slipped 0.2% month-over-month but grew a healthy 3.9% year-over-year, while July retail sales rose 3.7% year-over-year yet still missed consensus. Domestic demand, in other words, has not fully confirmed what the trade figures are shouting.
Layer the BoJ hike on top and the picture sharpens. A central bank tightening into sub-target 1.9% inflation, alongside a trade surge, signals that the BoJ is betting on external demand and structural wage dynamics rather than waiting for a conventional inflation clearance. Whether that confidence is warranted is exactly what the incoming data will start to test.
The BoJ rate hike path projects a terminal rate of 1.75% by April 2027, but a planned food consumption tax cut could mechanically suppress headline CPI by up to 1.5 percentage points, meaning investors reading 2027 inflation prints at face value risk misreading policy intent entirely.
That is the natural pivot to the week ahead. Several releases in the week of 21-27 September 2026 speak directly to the ambiguities left open by the August numbers.
- September PMIs: manufacturing and services readings for the US, UK, Eurozone, and Japan
- United States: August new home sales and August durable goods orders
- Eurozone: August broad money supply
For context, S&P Global’s August Eurozone PMIs showed modest expansion, with manufacturing at 52.7 and the composite at 52.0, both above the 50 line that separates growth from contraction. The September figures will show whether that expansion held.
What the mid-September data mosaic tells investors before the next set of readings
Pull the week together and two tensions stand out, neither of which any single regional headline captures on its own.
The first is a demand-versus-production split that spans borders. Strong consumer activity in the US and UK sits beside soft US manufacturing and fragile sub-surface signals in the Eurozone and China. The global growth picture is, at the same time, better and more uneven than the strongest headlines suggest.
The second is central bank divergence, and this one is not a one-week anomaly. The Fed, BoE, and BoJ are now running on distinct policy timelines, and that separation will shape currency, fixed income, and equity dynamics through the rest of 2026.
The honest read is that both an optimistic and a pessimistic interpretation of this dataset are defensible right now. That is exactly why the September PMIs carry unusual diagnostic weight; they are the first leading indicators for Q4 2026 conditions across every major economy, and they arrive into a picture that is genuinely mixed.
Here is what to watch as the next readings land:
- September PMIs across all four major regions, as the earliest confirmation or contradiction of current momentum
- US durable goods orders, for whether the manufacturing softness deepens
- Eurozone broad money supply, which speaks to whether credit conditions are tightening beneath the inflation numbers
- China credit and labour follow-through, to test whether the activity beat was real or fragile
This article is for informational purposes only and should not be considered financial advice. Investors should conduct their own research and consult with financial professionals before making investment decisions.
Past performance does not guarantee future results. Forward-looking references to upcoming data releases are subject to market conditions and various risk factors, and outcomes may differ from current expectations.
—