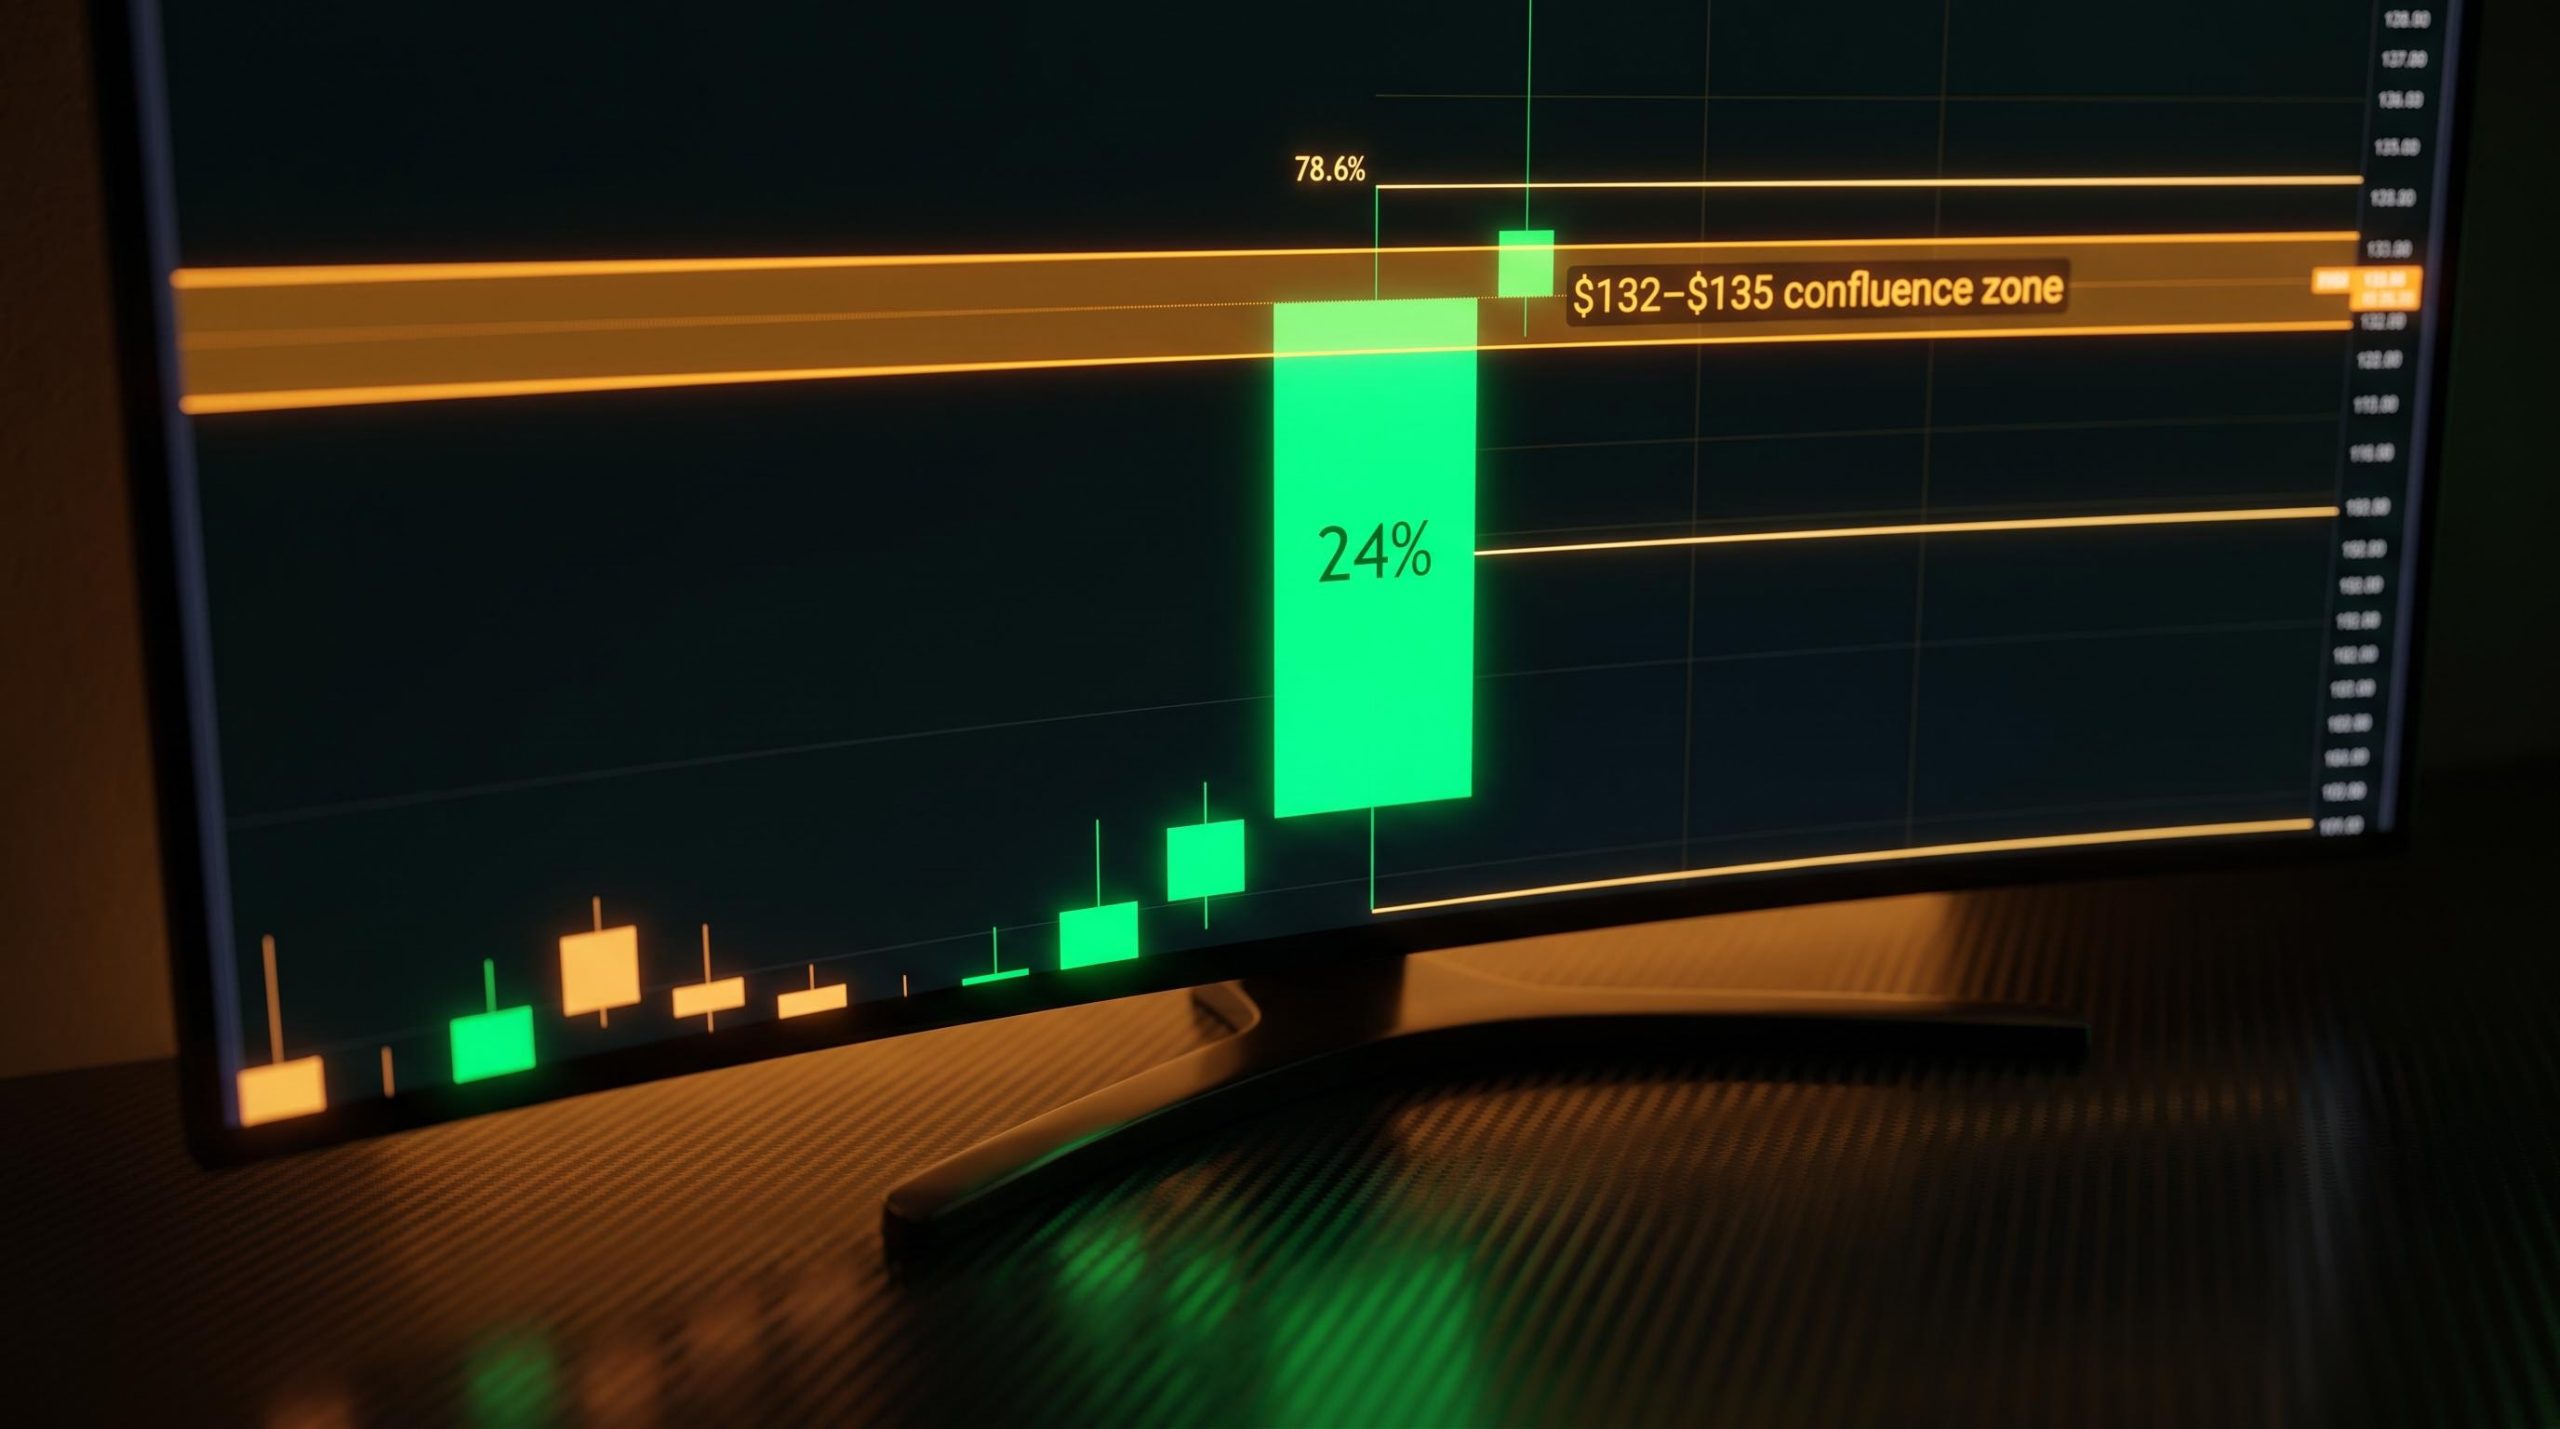
Most traders who watched Intel surge 24% in a single session in April 2026 asked one question: how do they get in on the next move like that? A small group of contrarian traders asked the opposite question, and they had already mapped out exactly where they planned to short it.
When a stock gaps up 10 to 38% in a single session, the crowd sees confirmation. Contrarian short sellers see a setup.
This explainer breaks down the technical logic behind that instinct: how confluence zones are built from Fibonacci retracements, unfilled chart gaps, and prior pivot highs; why a sharp single-session gain can improve the odds of a short entry rather than kill them; and how four real stocks, Intel, Meta, MongoDB, and Qualcomm, illustrate each piece of the framework.
Here is a clear framework for understanding how contrarian traders assemble a short thesis from a chart, why they wait for specific price levels instead of chasing the move, and where the approach falls apart entirely. Whether you plan to trade this way or simply want to understand what is happening on the other side of a momentum trade, this is how the technical logic actually works.
Why momentum stocks become short candidates after a big session
Here is the premise that stops most investors cold: a stock that just jumped 20% in a day can be a better short candidate than it was the week before.
Sit with that for a moment, because it runs against everything momentum feels like. A big green candle looks like strength. To a contrarian short seller, it can look like exhaustion.
The logic is structural, not emotional. A sharp single-session gain does not remove downside risk. It often manufactures a temporary supply point, because the late buyers and profit-takers who pile in at elevated prices become the sellers who reappear the moment momentum stalls.
That is why contrarian traders treat the price zone above a surge as a search space rather than a no-go area. They are not calling a top on the whole rally. They are waiting for price to climb into a pre-identified resistance zone where several technical factors line up at once.
Consider the raw material these moves provide. Intel soared 24% in a single session on 24 April 2026, described by CNBC as the stock’s best daily performance since October 1987. MongoDB rallied 38% in one session on 27 August 2025, then surged another 22% in a single day on 2 December 2025. Qualcomm ran 61.7% between 10 March and 8 June 2026, throwing off multiple potential resistance zones along the way.
Three conditions typically flag a momentum stock as a short candidate:
- A sharp single-session gain that stretches price well above recent averages
- Price approaching a known resistance cluster identified in advance
- Momentum showing early signs of deceleration
This is not a hunch dressed up as analysis. Research supports the pattern.
A 2024 conference paper, “Stealthy Shorts: Informed Liquidity Supply,” links higher prior-week returns directly to increased short-selling activity, showing that institutional short sellers actively fade rallies rather than chase them.
What that tells you is important: the contrarian impulse after a big rally is not irrational noise. It reflects a structured, evidence-backed response from sophisticated participants who read stretched prices as opportunity, not as a warning to stay away.
When big ASX news breaks, our subscribers know first
How Fibonacci levels, chart gaps, and pivot highs combine into a confluence zone
Picture yourself with a live chart open. A stock has surged, and you want to find the exact price where supply is most likely to overwhelm buyers. You have three tools, and each answers a different question.
The first is the 78.6% Fibonacci retracement. It is the mathematical square root of 0.618, and technical literature places it inside the “institutional discount zone” running from 61.8% to 78.6%. At this depth, a rebounding stock has recovered most of a prior decline but has not fully reclaimed it. A clean breach of the 78.6% level is often read as a signal of potential full trend reversal, which is precisely why contrarians invert the logic and use it as a high-risk short entry, fading an extended upward push.
Fibonacci retracement levels derive their practical weight from collective trader recognition: because enough market participants watch the same ratios, the levels become self-reinforcing zones where supply and demand shifts are genuinely more likely to occur.
The second tool is the unfilled chart gap. When aggressive buying at the open leaves untraded price levels behind, those levels sit there like a magnet. As momentum cools, mean-reversion and algorithmic strategies that track gap-fill statistics tend to pull price back toward them.
The third is the prior pivot high: a previous peak where buyers once got trapped. Market memory does the work here. Traders who bought at that high and are still underwater will often sell into a retest, turning the old peak into fresh resistance.
Individually, each tool is just a line on a chart. Stacked together, they define a zone. Here is how the four case studies map out.
Professional traders validate technical levels only when at least two independent structural factors converge on the same narrow price zone; a single Fibonacci ratio without gap or pivot confirmation is not a zone, it is a guess dressed as precision.
| Stock | Session Gain | Fibonacci Level | Unfilled Gap | Confluence Zone |
|---|---|---|---|---|
| Intel | ~13% | Trend-line aligned | ~$139.63 | $132-$135 |
| Meta | ~10% | 78.6% at ~$738 | ~$738 | $738-$740 |
| MongoDB | Up to 38% | 78.6% at ~$447.64 | ~$434 and ~$453 | $434-$453 |
| Qualcomm | ~8% | Trend-line aligned | Not identified | $211-$212 |
One number keeps this honest. StockMarketWatch data from an 9 April 2026 snapshot shows that over a five-year period, 62% of MongoDB gap-ups filled, with a median of 3 trading days, while 38% stayed unfilled.
That 38% non-fill rate tells you directly what a confluence zone is and is not. It is a region where the probability shifts in the short seller’s favour. It is not a deterministic trigger that guarantees a reversal.
Stacking the tools: from individual signals to a short zone
Confluence does not mean three signals pointing vaguely in the same direction. It means three independent technical reasons for one narrow price range to act as resistance.
Meta is the cleanest illustration. Its 78.6% retracement, drawn from a prior all-time high to a swing low, resolves at roughly $738, landing directly on an unfilled gap and a prior pivot high. All three factors sit within about two dollars of each other, which is what makes the $738-$740 band a genuine zone rather than a single hopeful line.
Intel adds a fourth layer. Its $132-$135 zone combines an unfilled gap at approximately $139.63, a double-top pattern, and an ascending trend line. That trend line is dynamic resistance, meaning it moves with time, giving the whole zone a time-sensitive character the others lack.
Reading the short entry: what contrarian traders watch for at the zone
Building the zone is the easy part. Knowing when to actually short it is where discipline separates traders.
Price reaching the confluence zone is not the trigger. It is the starting gun for observation. The trigger is behavioural: evidence that supply is overwhelming demand right at that level, showing up as rejection candles, volume divergence, or intraday reversal patterns.
Volume divergence, where price advances into a resistance zone on shrinking participation, is one of the clearest behavioural signals that supply is beginning to overwhelm buyers, because it shows fewer traders are willing to commit capital at elevated prices even as the index-level move continues.
Take Qualcomm. A pivot high near $193.58 was expected to act as near-term resistance and slow the advance, with the primary short zone projected higher at $211-$212, aligned with a trend-line breakout level. A contrarian would watch how price behaves as it approaches that upper band, not simply short it on arrival.
Intel offers a contrast in timing. On the session studied, the stock printed an intraday high around $124.73, with the $132-$135 cluster sitting above as the next expected resistance. The trader waits for price to travel into that cluster before anything happens.
Stop-loss placement is what makes the whole approach survivable. The stop sits above the 78.6% level or the original swing high, giving the position a mathematically defined invalidation point. If price closes decisively above that, the thesis is simply wrong, and the trade is closed.
Here is the sequence in order:
- Identify the confluence zone in advance
- Wait for price to reach the zone
- Look for behavioural confirmation at the zone
- Place the entry with a stop above the invalidation level
- Define the target, either a gap fill below or prior support
There is a real trade-off buried in step two. A “first touch” entry offers a better reward but higher risk, because you are shorting into live momentum. Waiting for a failed retest lowers the risk but worsens the reward, because the best price is often gone by then.
And this is where honesty matters most.
A 2024 study by Goyal et al. on short-term momentum and reversals finds that reversal effects fade as turnover and a stock’s price-to-52-week-high ratio increase, meaning momentum tends to dominate in high-turnover regimes.
What that finding tells you is the qualification every reader needs before acting. In a genuine momentum regime, with heavy turnover and price near its 52-week high, the statistical edge of the contrarian entry shrinks. The zone may not hold even when you have identified it correctly.
What can go wrong: the real risks of shorting high-momentum tech
Before you file this away as a usable technique, consider what a losing trade in this strategy actually costs, because it is not symmetrical with a long position.
When you buy a stock, your loss is capped at what you invested. When you short one, the loss is theoretically unlimited, because a stock can keep rising indefinitely.
The SEC investor guidance on short selling establishes that short positions expose investors to theoretically unlimited losses, because a stock can keep rising indefinitely with no ceiling on the loss a short seller is forced to absorb.
The U.S. Securities and Exchange Commission investor bulletin “An Introduction to Short Sales” explicitly warns that short selling exposes investors to theoretically unlimited losses.
That is the authoritative framing for everything that follows. Four distinct risks compound it:
- Unlimited loss exposure, with no ceiling on how far price can run against you
- Short squeeze mechanics, where crowded shorts are forced to cover
- Margin call cascades triggered by parabolic single-session moves
- Broker recall of borrowed shares at the worst possible moment
The short squeeze deserves specific attention, because it is a distinct mechanism, not generic volatility. When a heavily shorted name rallies, short sellers are forced to buy back shares to cover, and that forced buying pushes the price higher still, which forces more covering. The result is a non-linear cascade.
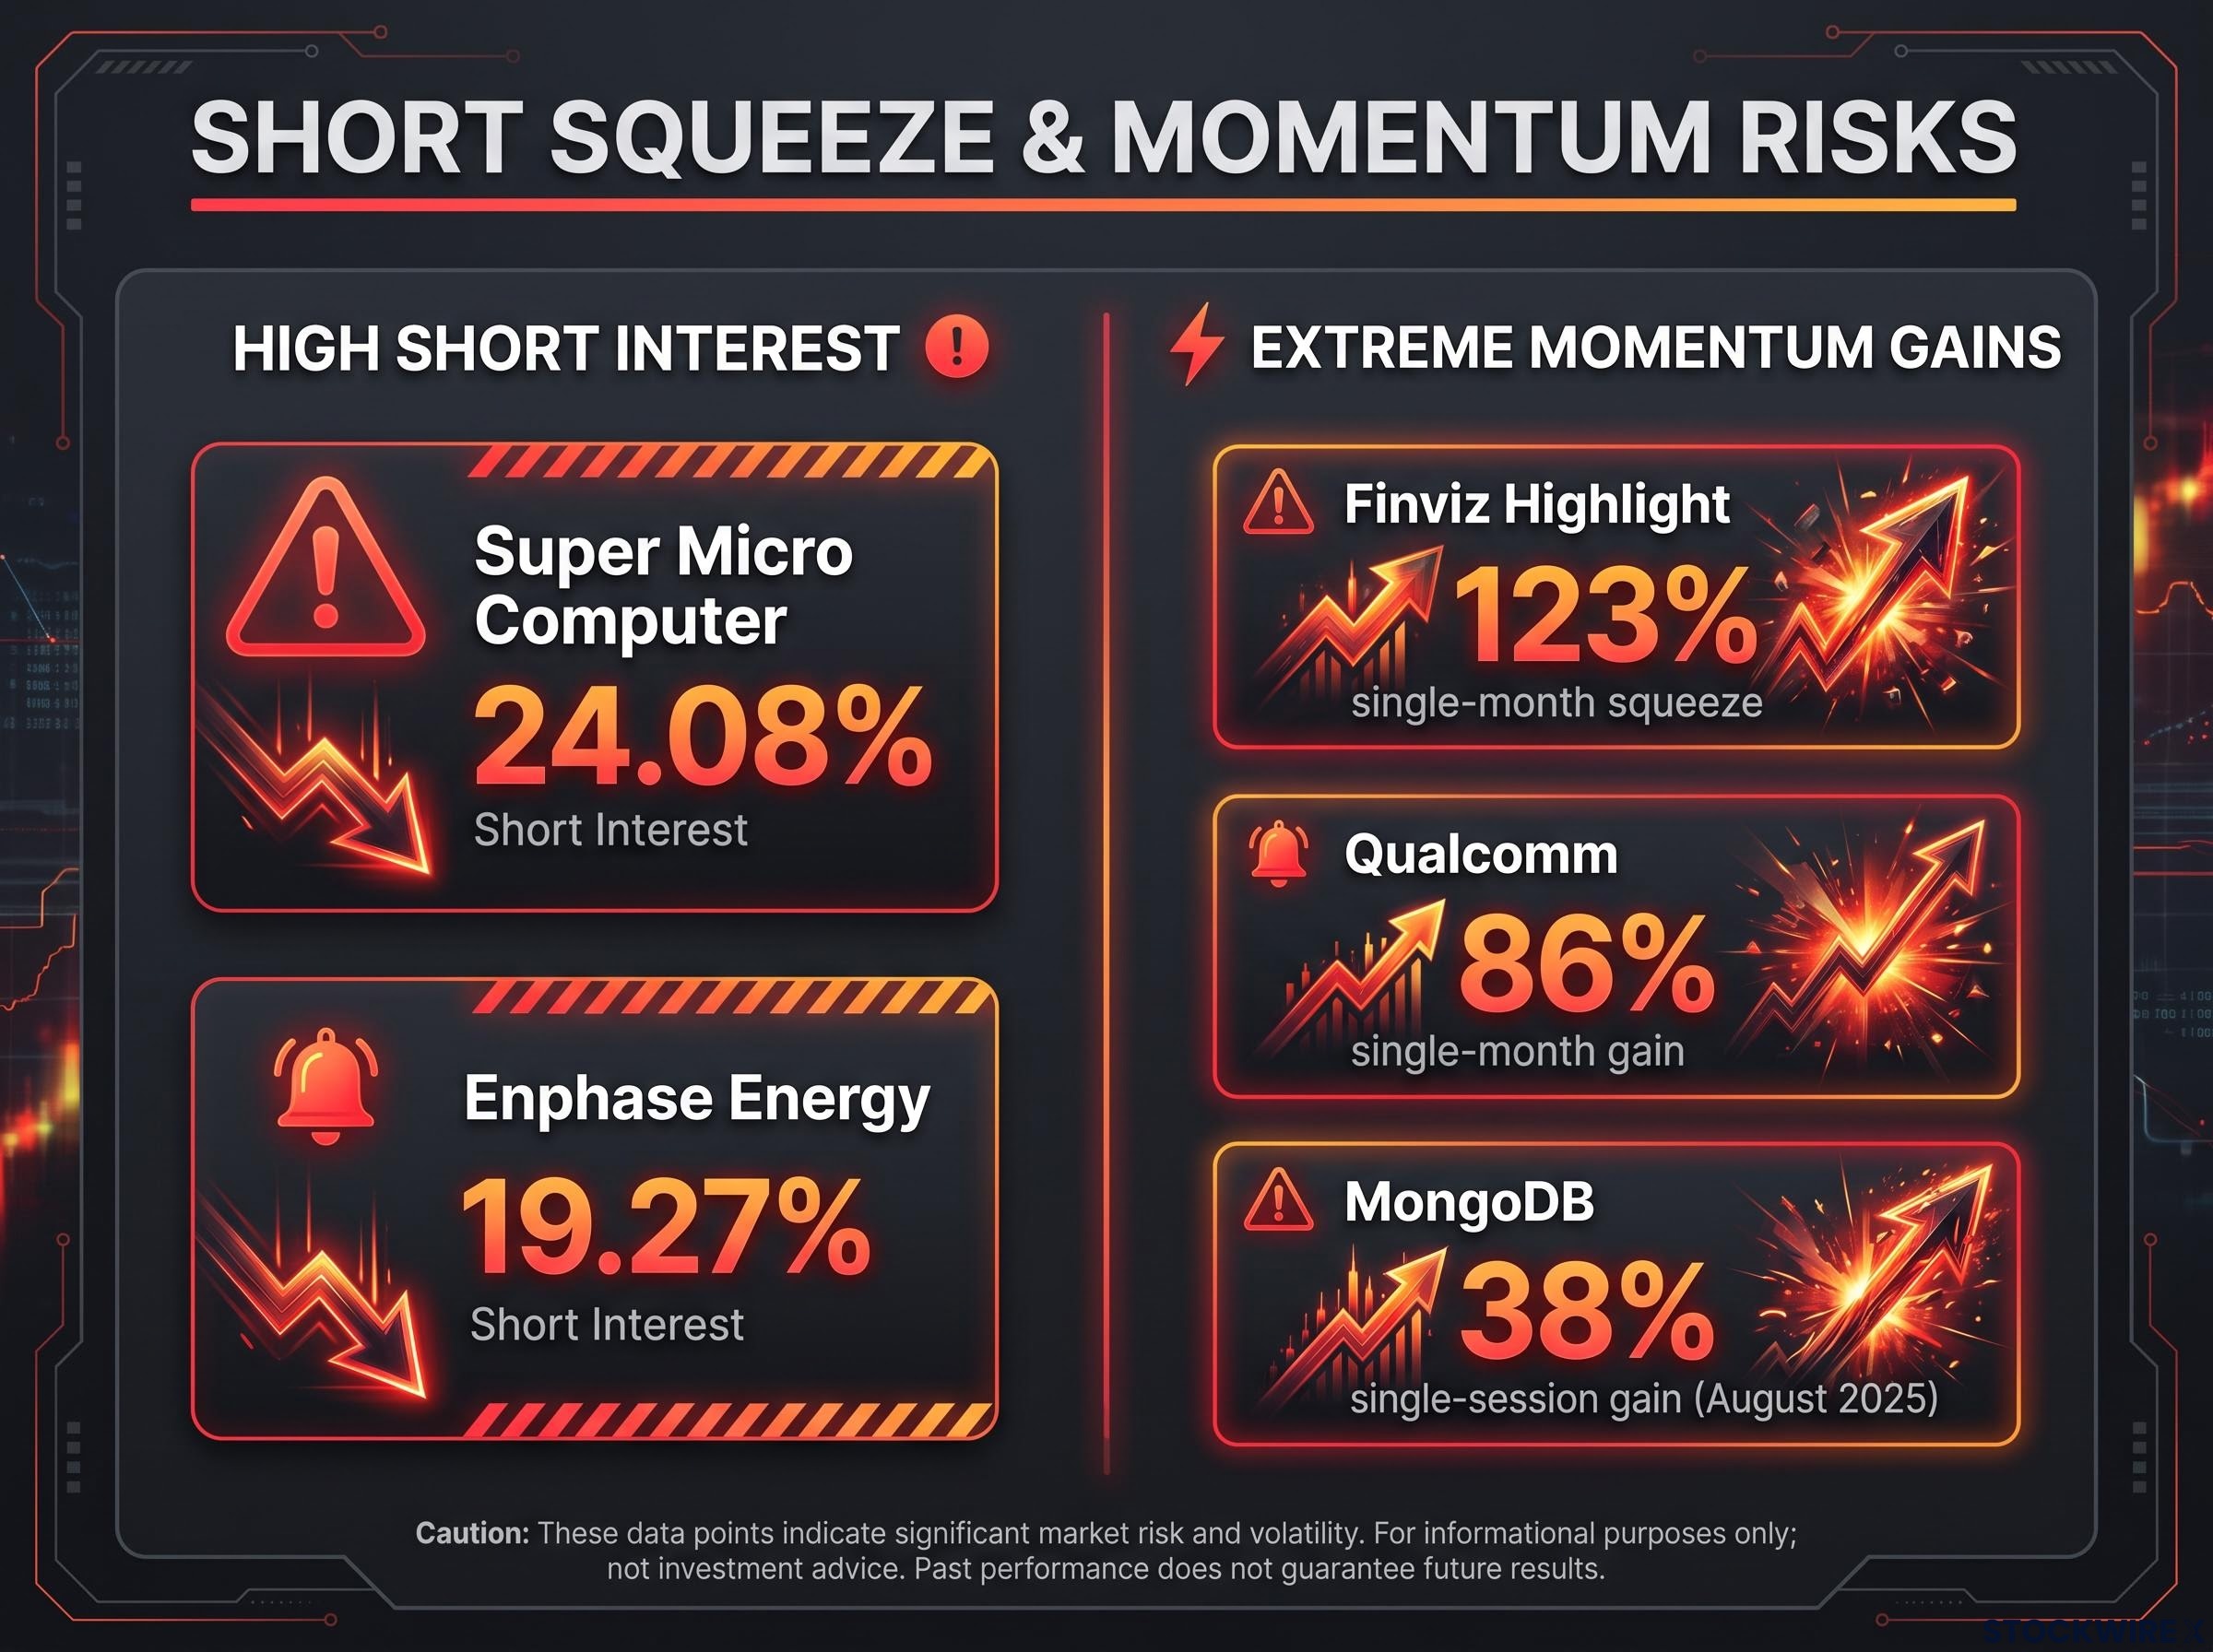
The numbers show what that looks like. Reports cited short interest of approximately 19.27% for Enphase Energy and 24.08% for Super Micro Computer, with one instance highlighted by Finviz of a 123% gain over a single month driven purely by a squeeze.
Now hold that against the case studies. MongoDB’s 38% single-session gain in August 2025 and Qualcomm’s 86% gain over a single month are not abstract tail risks. A move of that size against a short position can obliterate it before a stop-loss ever executes at the intended price.
Operational risks that traders often underestimate
The mechanics of loss are only half the picture. The operational risks are the ones that catch experienced traders off guard.
Margin call timing is the first. Because short sellers operate on borrowed money, an extreme single-session move can trigger a rapid margin call and forced liquidation. A theoretically sound stop-loss level may simply fail to execute at the intended price if the stock gaps at the open.
Broker recall is the second, and it removes control entirely. The Managed Funds Association’s “Updated Intro to Short Selling” (2025) flags that brokers can force buy-ins by recalling borrowed shares at any time. You can be right on the thesis and still be forced out of the position at the worst possible moment.
There is a third dimension the research documents clearly: publicly disclosed short positions face heightened vulnerability to coordinated retail activity, the same squeeze dynamics that have produced triple-digit monthly gains in crowded names.
This article is for informational purposes only and should not be considered financial advice. Investors should conduct their own research and consult with financial professionals before making investment decisions. Past performance does not guarantee future results.
Using the framework without becoming the cautionary tale
You now hold the full method. The question is whether it belongs in your toolkit, and that decision rests on one variable the framework cannot decide for you.
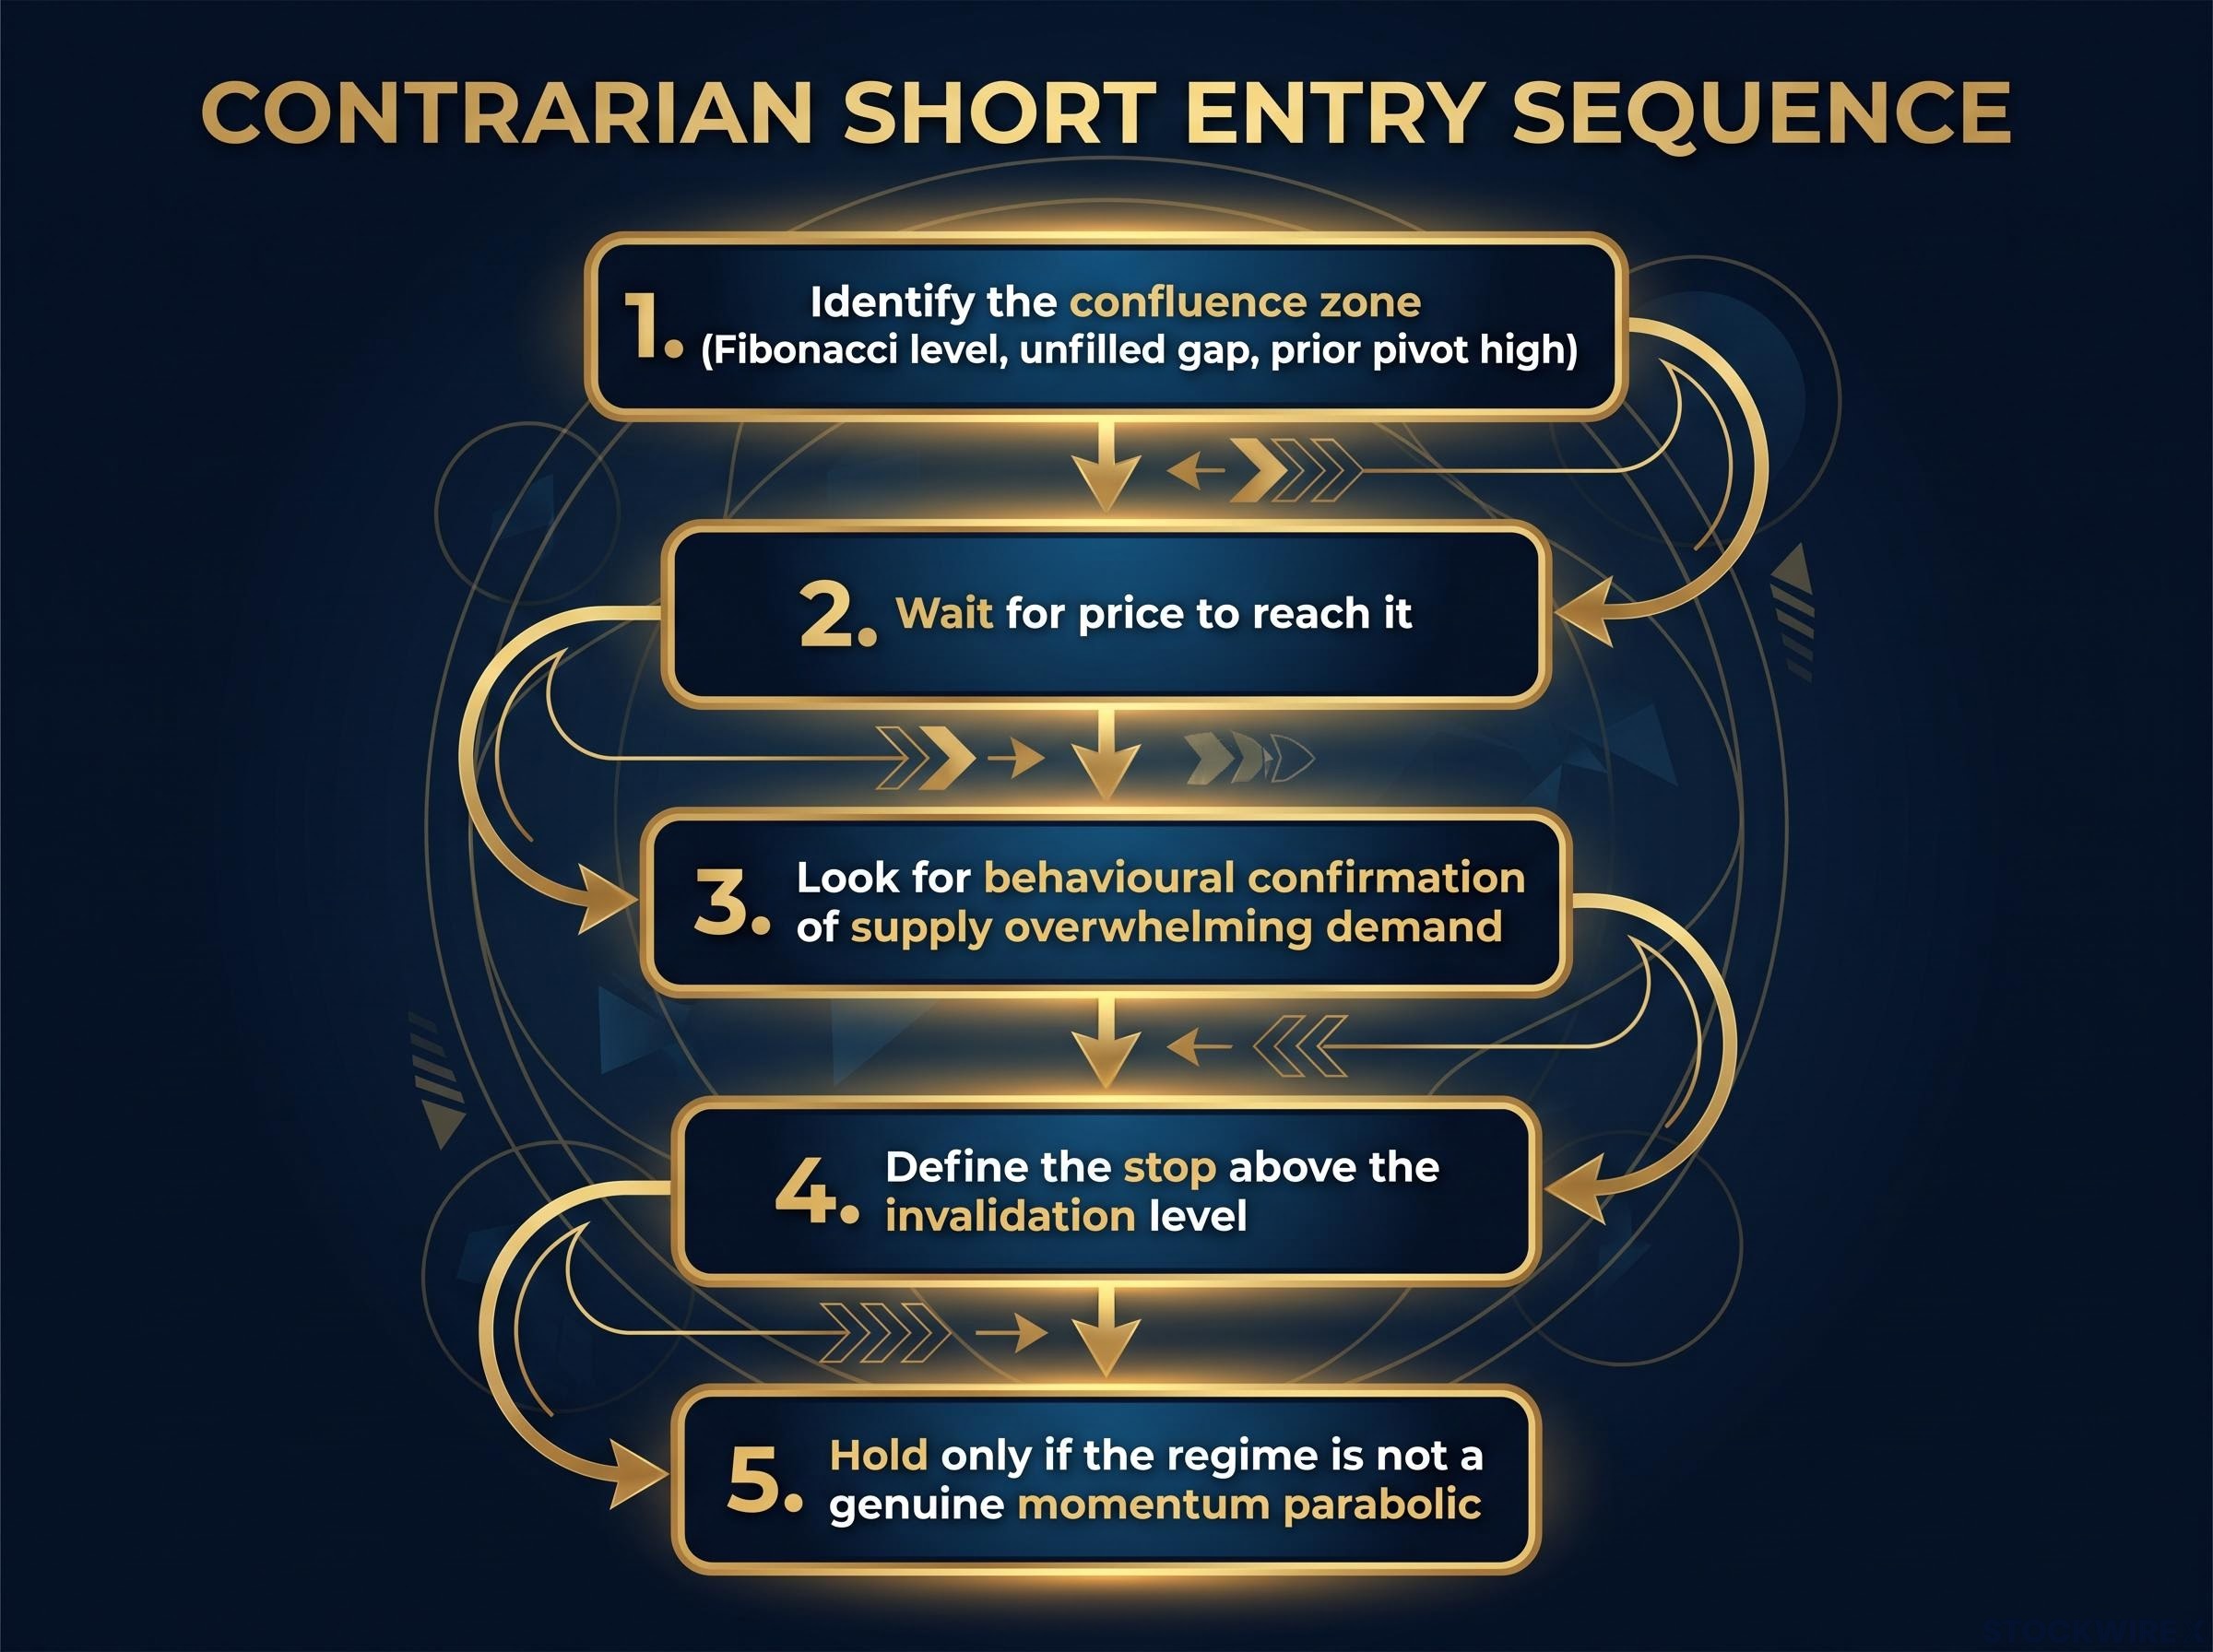
The methodology, in sequence:
- Identify the confluence zone, combining a Fibonacci level, an unfilled gap, and a prior pivot high
- Wait for price to reach it
- Look for behavioural confirmation of supply overwhelming demand
- Define the stop above the invalidation level
- Hold only if the regime is not a genuine momentum parabolic
Step five is the one no signal resolves cleanly. Regime identification, knowing whether a rally is a structural re-rating or a short-term exhaustion move, is pure judgment.
Intel is the warning. The stock gained 84% in 2025, a fundamental re-rating driven by AI demand, a new CEO, and outside investment. In that kind of move, confluence zones would have been invalidated again and again, because the valuation anchor itself had shifted. Any stock with a genuinely changing earnings trajectory sits outside the scope where this method applies.
Be honest about the ceiling, too. The 78.6% level carries a documented reversal reliability of roughly 55-60% in a futures context, according to FuturesHive, and MongoDB’s 62% gap-fill rate still leaves 38% of setups failing to reach target.
That leaves position sizing as the one non-negotiable. Even a correctly identified setup can lose. The only traders who survive being wrong here are those who size positions so that a 20-30% adverse move never threatens the account.
These statements are speculative and subject to change based on market developments. Short selling carries risks structurally different from long-side investing, including theoretically unlimited losses.
For readers who want to translate the framework above into live trade mechanics, our dedicated guide to building short positions covers the three specific entry signals, stop adjustment rules, and borrow-cost accounting that distinguish disciplined short sellers from directional gamblers.