
USD/JPY is a trade where the direction and the danger point in opposite directions. The pair sits in the high-150s as of late September 2026, and almost every structural force in the market argues it should move higher. Yet the market cannot chase it, because the cost of being wrong is not a slow drawdown. It is a violent, government-engineered reversal that can erase a year of carry returns in a matter of hours.
That tension is the whole story. The directional bias says up. The trade risk says do not get greedy.
What makes this pair worth studying is that the forces shaping it are not purely macroeconomic. They are institutional. A Federal Reserve that has just delivered its first rate hike in three years, a Bank of Japan tightening but moving far more cautiously, and a Ministry of Finance that has shown it will deploy tens of trillions of yen to slow the yen’s slide.
This is less a routine currency read and more a case study in how sovereign intervention capacity reshapes the risk-reward calculus for everyone in the market.
What follows here breaks down the conditions that would need to align for USD/JPY to reach 160.0, why the velocity-based intervention regime changes how any position should be sized and timed, and why intervention-driven reversals have historically bought time rather than changed the trend.
What the policy gap actually tells you about where USD/JPY is headed
Start with the mechanical force, because everything else is built on top of it. On 16 September 2026, the Federal Open Market Committee raised its target range by 25 basis points to 3.75-4.00%, its first rate hike in three years and the first under Chair Kevin Warsh. Two days later, on 18 September 2026, the Bank of Japan lifted its policy rate to 1.25% from 1.00% by a 7-2 vote, a 31-year high.
That leaves a spread of roughly 250-275 basis points between the two. For a currency pair, that gap is the engine. It is what makes short-yen carry trades profitable, and it is what keeps institutional demand for USD/JPY structurally elevated.
The rate differential mechanics driving yen weakness are more stubborn than the headline policy numbers suggest: a 250-275 basis point gap in favour of the dollar means each incremental BoJ hike closes a fraction of the structural divide rather than reversing it.
Here is where the analytical work begins. A rate differential of that size does not just support the pair on a given day; it anchors the entire directional bias. Any read on where USD/JPY is headed has to start with whether that gap is genuinely closing or merely appearing to close.
| Central Bank | Current Policy Rate (Most Recent Decision) | Direction of Travel | Key 12-Month USD/JPY Target |
|---|---|---|---|
| US Federal Reserve | 3.75-4.00% (16 September 2026) | Tightening, one further hike signalled for 2026 | Goldman Sachs: 165 |
| Bank of Japan | 1.25% (18 September 2026) | Tightening, but gradual and cautious | ING: probing 155-160 |
The forecasts split along exactly this question. ING’s Francesco Pesole frames the setup as one where USD/JPY is “probing the 155-160 area” rather than settling into it. Goldman Sachs went further: on 6 July 2026 it raised its 12-month target to 165, with intermediate targets of 162 at three months and 163 at six months, on the view that the gap remains wide enough to sustain carry appeal even as both banks tighten.
Goldman’s bullish anchor Goldman Sachs lifted its 12-month USD/JPY forecast to 165, up from 155, on 6 July 2026, citing limited room for sustained yen strength if BoJ tightening under-delivers.
The other camp sees the gap narrowing. StoneX and J.P. Morgan argue forward yield expectations are compressing as markets price a gradual BoJ cycle, with Governor Kazuo Ueda signalling a shift toward pre-emptively stopping inflation from overshooting the 2% target. LSEG, FXStreet, and Goldman counter that a 250-plus basis point spread, Japan’s fiscal pressures, and the BoJ’s historically cautious guidance are enough to keep yen depreciation biased.
The read you should take is this: the spread is real and it is wide, but the debate is not about today’s number. It is about the trajectory. That distinction determines whether the structural bid for USD/JPY fades or persists.
When big ASX news breaks, our subscribers know first
How Japanese authorities use velocity, not price levels, as their intervention trigger
Here is what a speculator actually sees on screen. A quiet Friday, USD/JPY grinding higher, and then a sudden dip back under 157.0 on nothing more than a reported Bank of Japan rate check. No yen spent. No official statement. Just a phone call, and positions start trimming.
A rate check is exactly that: authorities contact banks to ask about pricing. It signals that direct intervention may be close, and it prompts immediate position trimming without the Ministry of Finance spending a single yen. It is the cheapest tool in the box, and often the most effective.
The logic underneath it is what matters. Former BoJ FX operations head Atsushi Takeuchi has explained that intervention decisions rest on a mix of the speed of the move, how concentrated one-way positioning has become, and whether markets are turning disorderly. Not a specific level.
That is the key structural fact. A two-to-three yen surge over a few hours is treated as far more dangerous than a gradual drift from 160 to 162, because velocity, not price, is the trigger.
Authorities layer deterrence through a verbal escalation ladder before any official order arrives:
- “Watching closely” signals the move is on the radar
- “Excessive” flags concern about the size of the move
- “Rapid and one-sided” warns intervention is being actively considered
- Official action follows only if the warnings are ignored
Each rung is designed to force speculative position trimming before actual yen purchases hit the market. And the numbers show it works.
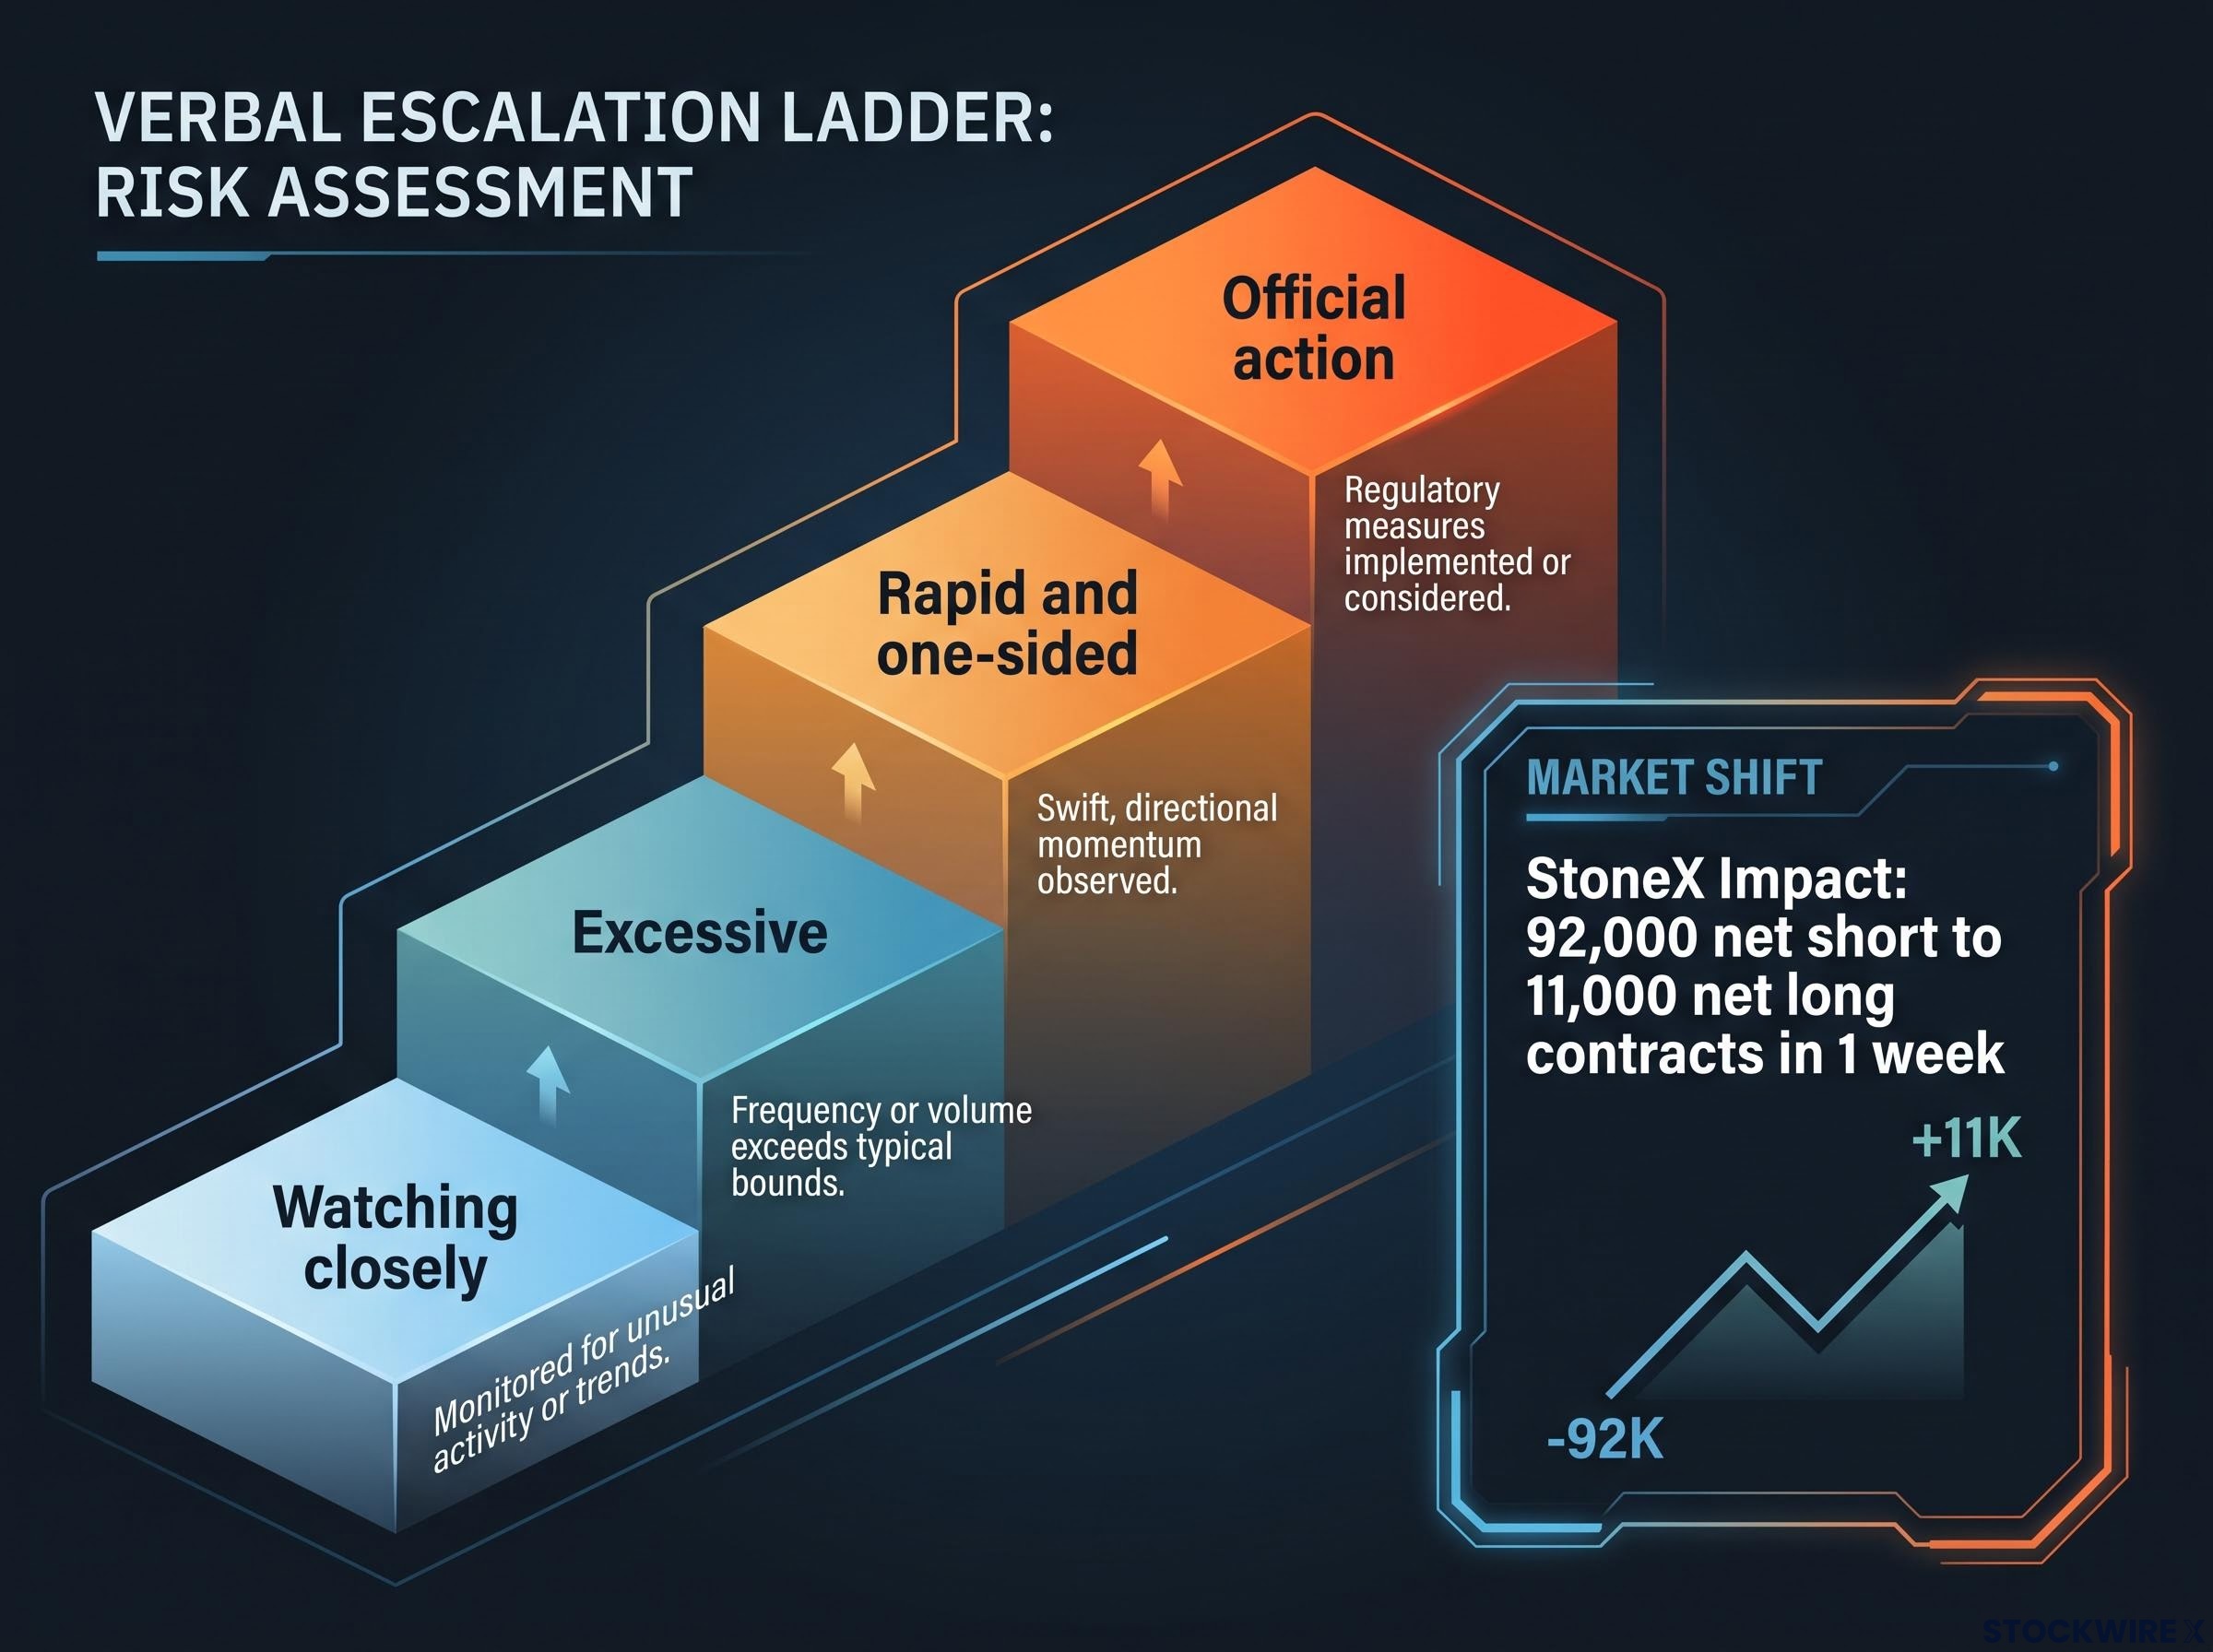
The scale of deterrence in practice StoneX highlighted an instance where intervention fears alone shifted net positioning from 92,000 net short yen contracts to 11,000 net long within a single week.
For anyone sizing a USD/JPY position, this changes the calculation entirely. If you are planning to fade intervention at a fixed price, say 160.0, you are working from a false assumption. The regime is deliberately ambiguous, which means the intervention risk is live well before the obvious level is reached. It is not about where the pair is. It is about how fast it got there and what the positioning data looks like when it arrives.
What the intervention track record reveals about staying power
The interventions are not bluffs, and the scale is not trivial. The MoF’s April-May 2026 campaign ran to three confirmed operations: ¥6,278.7 billion on 30 April, ¥780.2 billion on 4 May, and ¥4,675.9 billion on 6 May. Lazard Asset Management described the combined effort as a record ¥11.73 trillion, roughly $73 billion.
The 30 April operation alone drove USD/JPY up 3% to 155.5 after the pair had weakened to 160.72 earlier that session. Then, on 31 July 2026, the MoF executed a coordinated yen-buying operation with the United States, estimated at ¥14 trillion, or about $88 billion, producing what LSEG described as a roughly 5-standard-deviation move that pushed USD/JPY back toward 155 from beyond 163.
The July 2026 coordinated US-Japan operation was deliberately structured to avoid dollar or Treasury sales, with Washington selling euro reserves instead, because unilateral Japanese action would have flooded the US bond market with supply at a moment of acute fiscal sensitivity.
Set that against the October 2022 precedent, when Japan spent approximately $42.8 billion (¥6.35 trillion) after the yen hit a 32-year low of 151.94, triggering intraday drops of up to 7 yen.
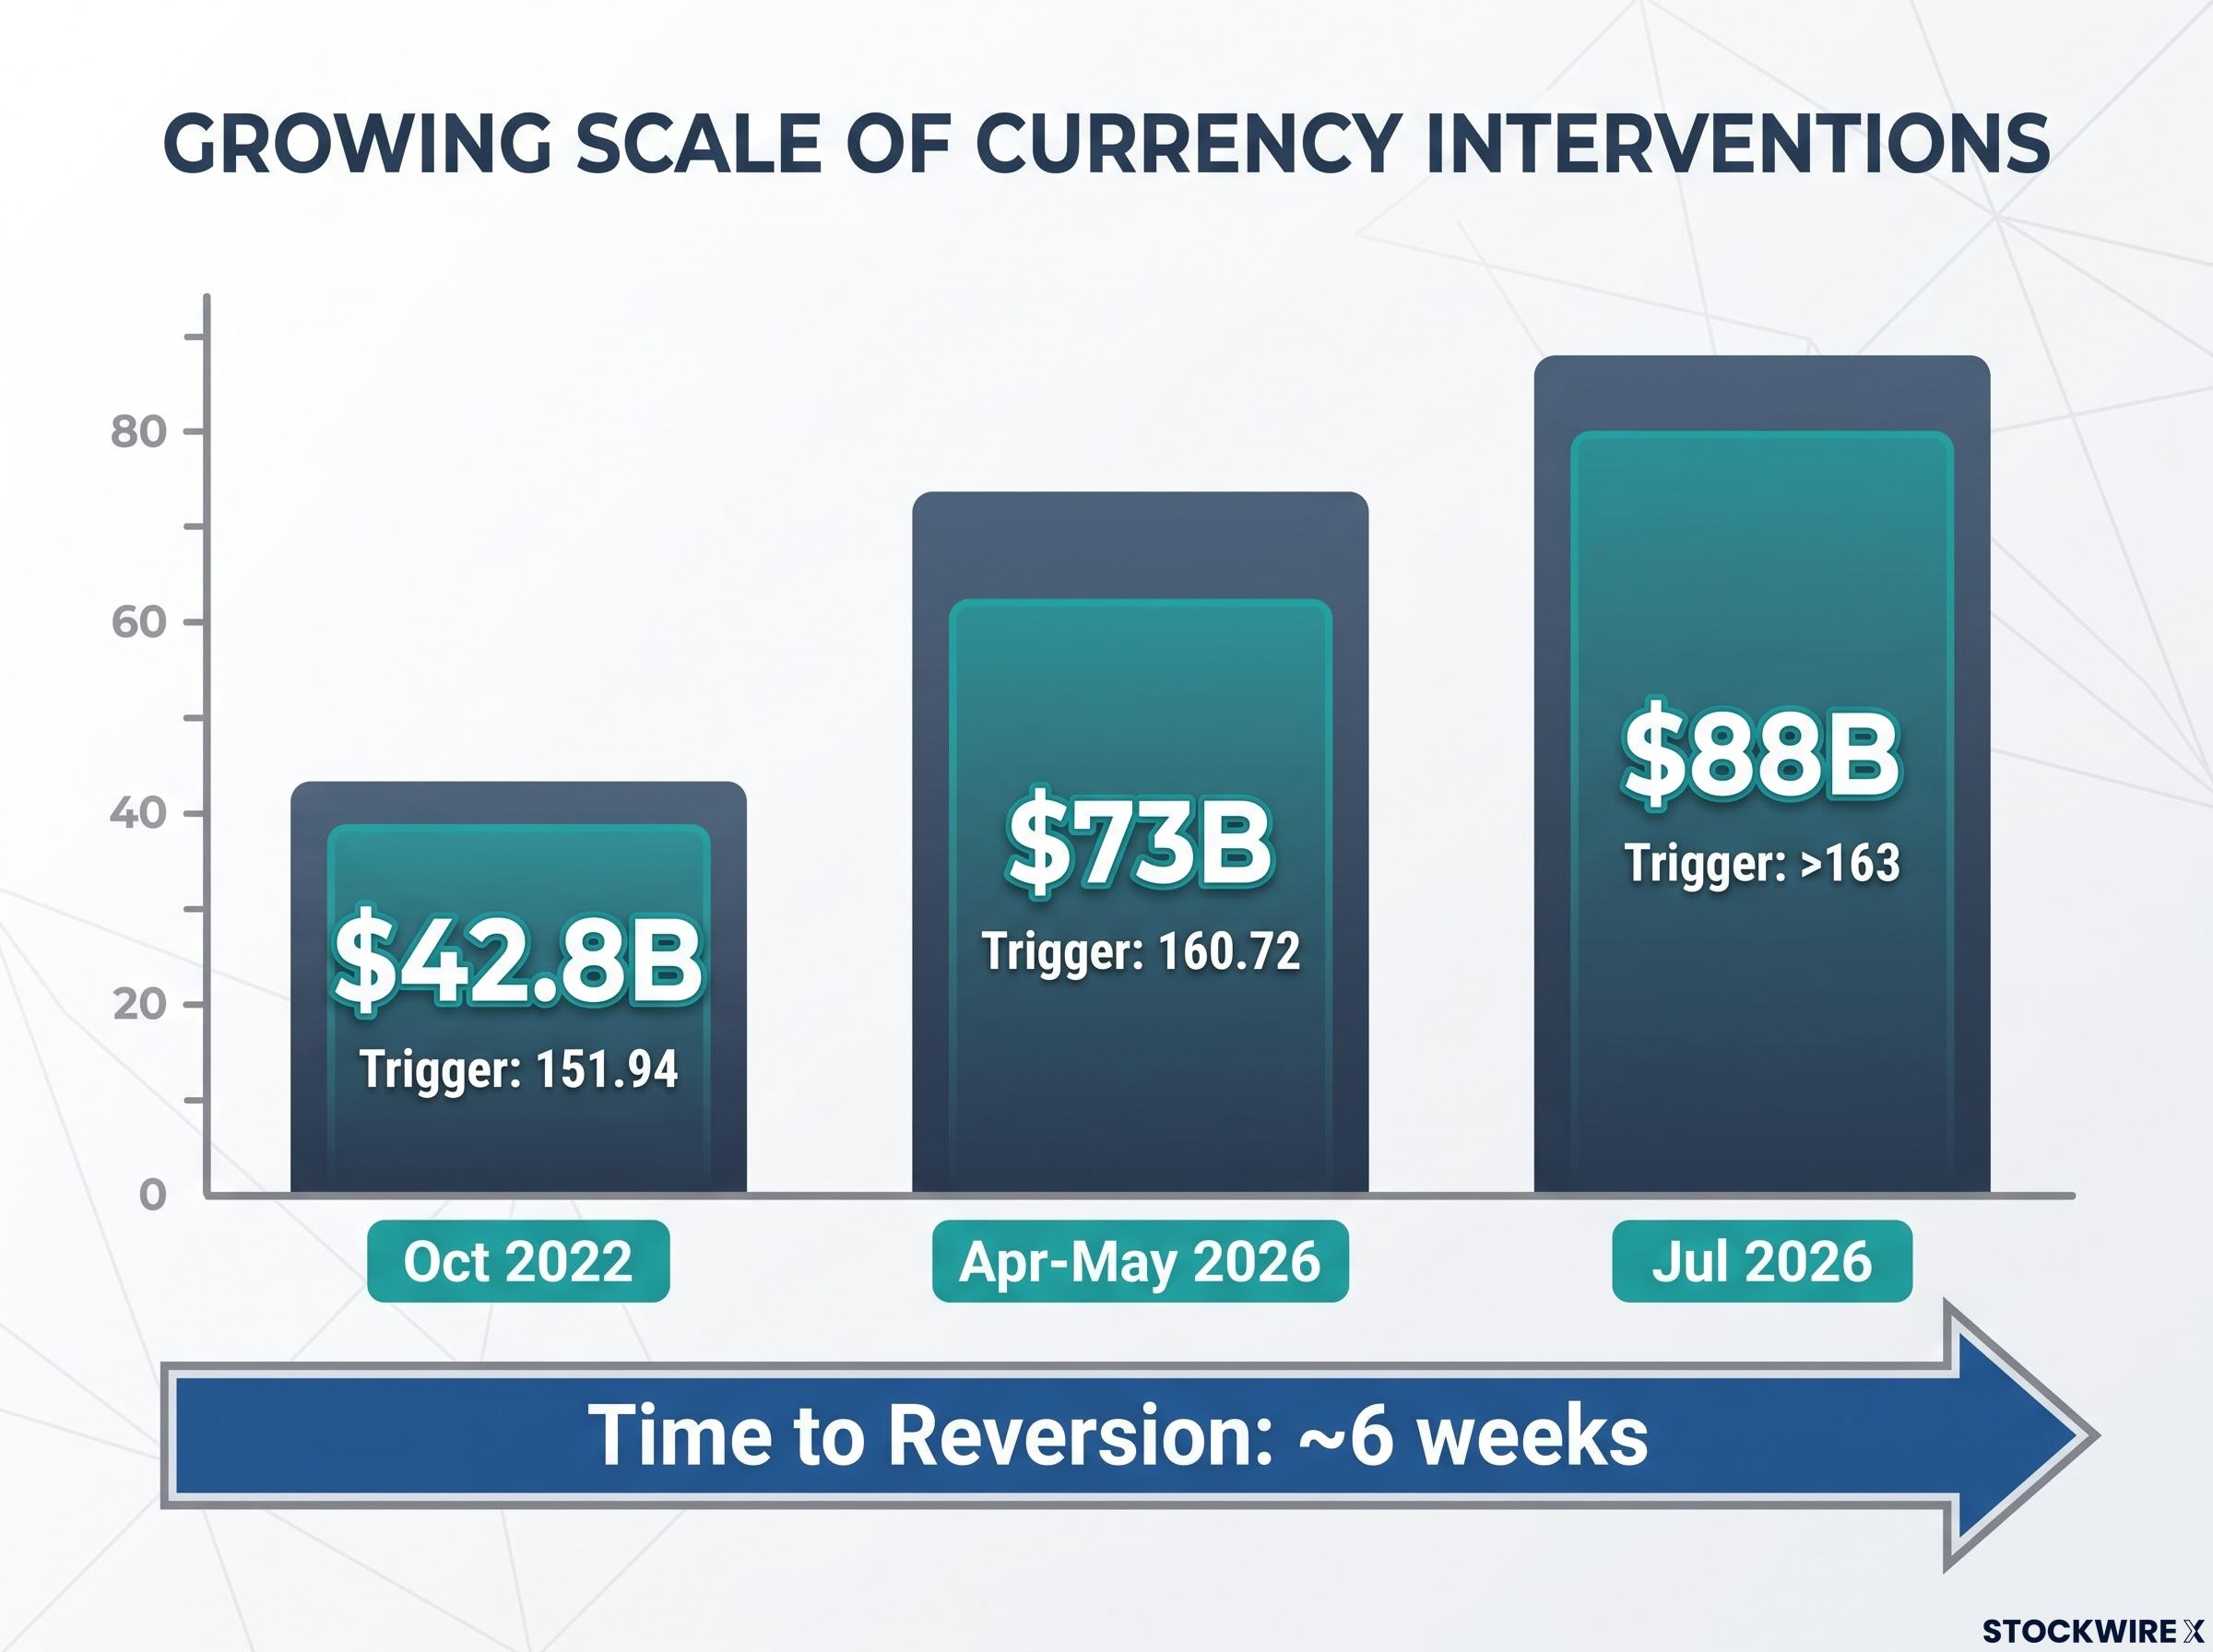
| Period | Approximate Scale | Trigger Level (USD/JPY) | Short-Term Impact | Time to Reversion |
|---|---|---|---|---|
| October 2022 | ~$42.8B (¥6.35T) | 151.94 (32-year low) | Intraday drops up to 7 yen | ~6 weeks |
| April-May 2026 | ~$73B (¥11.73T) | 160.72 | 3% jump to 155.5 | ~6 weeks |
| July 2026 | ~$88B (¥14T) | Beyond 163 | ~5-sigma move back toward 155 | Same structural pattern |
Why scale alone does not determine effectiveness
The July operation was the largest on record and it carried the weight of US coordination. Yet USD/JPY returned toward elevated levels along the same path as smaller unilateral operations, because the one thing that was never touched was the rate differential.
There is a second reason the effectiveness ceiling is falling. Nomura Foundation research found that Japanese exporters no longer systematically rely on yen depreciation to boost export volumes. That weakens the political-economy rationale for aggressive, sustained intervention even as the operations themselves have grown larger.
The honest conclusion is two-sided. Interventions demonstrably move the market in the short run, and the scale behind them is real. But during both the October 2022 and the April-May 2026 campaigns, USD/JPY returned to or surpassed pre-intervention levels within roughly six weeks, because the fundamental rate differential stayed intact.
That six-week reversion pattern is not coincidence. It is the market’s verdict that intervention without a matching shift in central bank policy is a displacement, not a reversal. If you are using intervention-driven dips as a fade entry, the historical window for that trade has been short, and Goldman Sachs has warned that a sudden 3% gap lower can wipe out a full year of annualised carry returns in a single day.
Carry trade risk and the second-order effects market participants are pricing
This is where the story stops being bilateral. The short-yen carry trade is attractive on the rate differential alone, but the tail risk changes everything. Goldman Sachs has quantified it: a sudden 3% gap lower in USD/JPY can erase an entire year of annualised carry returns in a single session.
That forces hedge funds to size down or rotate into alternative funding currencies. And the mechanics of a forced unwind are self-reinforcing:
- Intervention is announced or triggered
- USD/JPY drops sharply within hours
- Stop-loss orders are hit at scale
- The carry unwind accelerates as positions liquidate
- Correlated risk assets reprice as liquidity tightens
That cascade is what produces the 3-8% intraday swings seen in prior operations. A deliberate yen purchase becomes a momentum event, amplified by the same stop-loss mechanics the authorities are counting on.
Carry unwind dynamics tend to be self-amplifying but shorter-lived than the headlines suggest: the 2024 episode cleared 40-60% of speculative positioning within weeks without a structural breakdown in global equity markets, and the same pattern shaped how the 2026 operations resolved.
The carry math that limits the chase Goldman Sachs has warned that a single 3% intraday gap lower in USD/JPY can wipe out an entire year of annualised carry returns in one session.
The reach extends further. When FX volatility spikes on intervention, carry exposure gets reduced across multiple asset classes at once, tightening global liquidity conditions and rippling into equities, credit, and broader cross-asset positioning. StoneX noted that the mere threat of action has moved net positioning by more than 80,000 contracts in a single week.
Here is why this matters even if you hold no yen position at all. A violent unwind forces risk reduction across correlated assets, which means yen intervention risk is also equity risk, credit risk, and a compressed global liquidity event. This is a global macro variable, not a niche FX story.
Whether 160.0 is a target or a tripwire
Pull the four layers together and the forward view is not a prediction. It is a conditional framework. ING’s Pesole calls a rebound toward 160.0 “consistent with prevailing market conditions,” and Goldman’s 3-month target of 162 treats 160.0 as a waypoint rather than a ceiling. With spot around 157.40 as of 21 September 2026, that leaves roughly 260 pips of distance.
But those 260 pips are not open runway. They are best understood as intervention premium, because the velocity regime means the journey matters as much as the destination. A rapid sprint to 160.0 is precisely what triggers a rate check or official action.
So the level becomes navigable only under specific conditions:
- Gradual drift: a measured climb over multiple sessions, driven by steady Fed communication rather than a single catalyst, with net short-yen positioning at moderate rather than extreme levels
- Structural shift: a materially faster BoJ hiking path that narrows the differential below 200 basis points, or a Fed pivot on US economic softening, either of which changes the whole picture
- Coordinated escalation: a formal US-Japan intervention agreement, following the July 2026 precedent, that removes the unilateral constraint on the MoF and raises the reversal risk sharply
Consensus for 2026 sits in a 146-154 trading range with year-end expectations around 151-157, according to FXEmpire, which tells you how far the bullish targets sit above the middle of the pack.
For investors wanting to model the full range of credible scenarios before taking a directional view, our dedicated guide to the yen outlook examines the 240% debt-to-GDP ceiling on BoJ hikes, the yield spread compression from 525 to 180 basis points, and what Washington’s tacit approval of intervention means for the 158-162 zone.
Three variables to watch before taking a directional view
Three signals determine which scenario plays out. First, BoJ meeting outcomes and the language of Ueda’s forward guidance, which set the trajectory of the rate gap. Second, the pace of USD/JPY appreciation over rolling 48-72 hour windows, the velocity signal that authorities themselves watch. Third, net speculative positioning in CFTC or equivalent data, which tells you whether the crowd is already leaning hard one way.
Read together, these decide whether the next 200-300 pip move is the start of a run toward Goldman’s 162 target or the setup for the next intervention episode. The distance to 160.0 is not just price. It is the gap between the current monitoring zone and the level where the probability of official action rises sharply.
This article is for informational purposes only and should not be considered financial advice. Investors should conduct their own research and consult with financial professionals before making investment decisions. Past performance does not guarantee future results, and financial projections are subject to market conditions and various risk factors. These statements are speculative and subject to change based on market developments and central bank policy.