The Russell 2000 is sitting near 2,860 while the federal funds rate holds at 3.75-4.00% and West Texas Intermediate (WTI) crude trades above $99 a barrel. That combination is more than uncomfortable for small-cap investors.
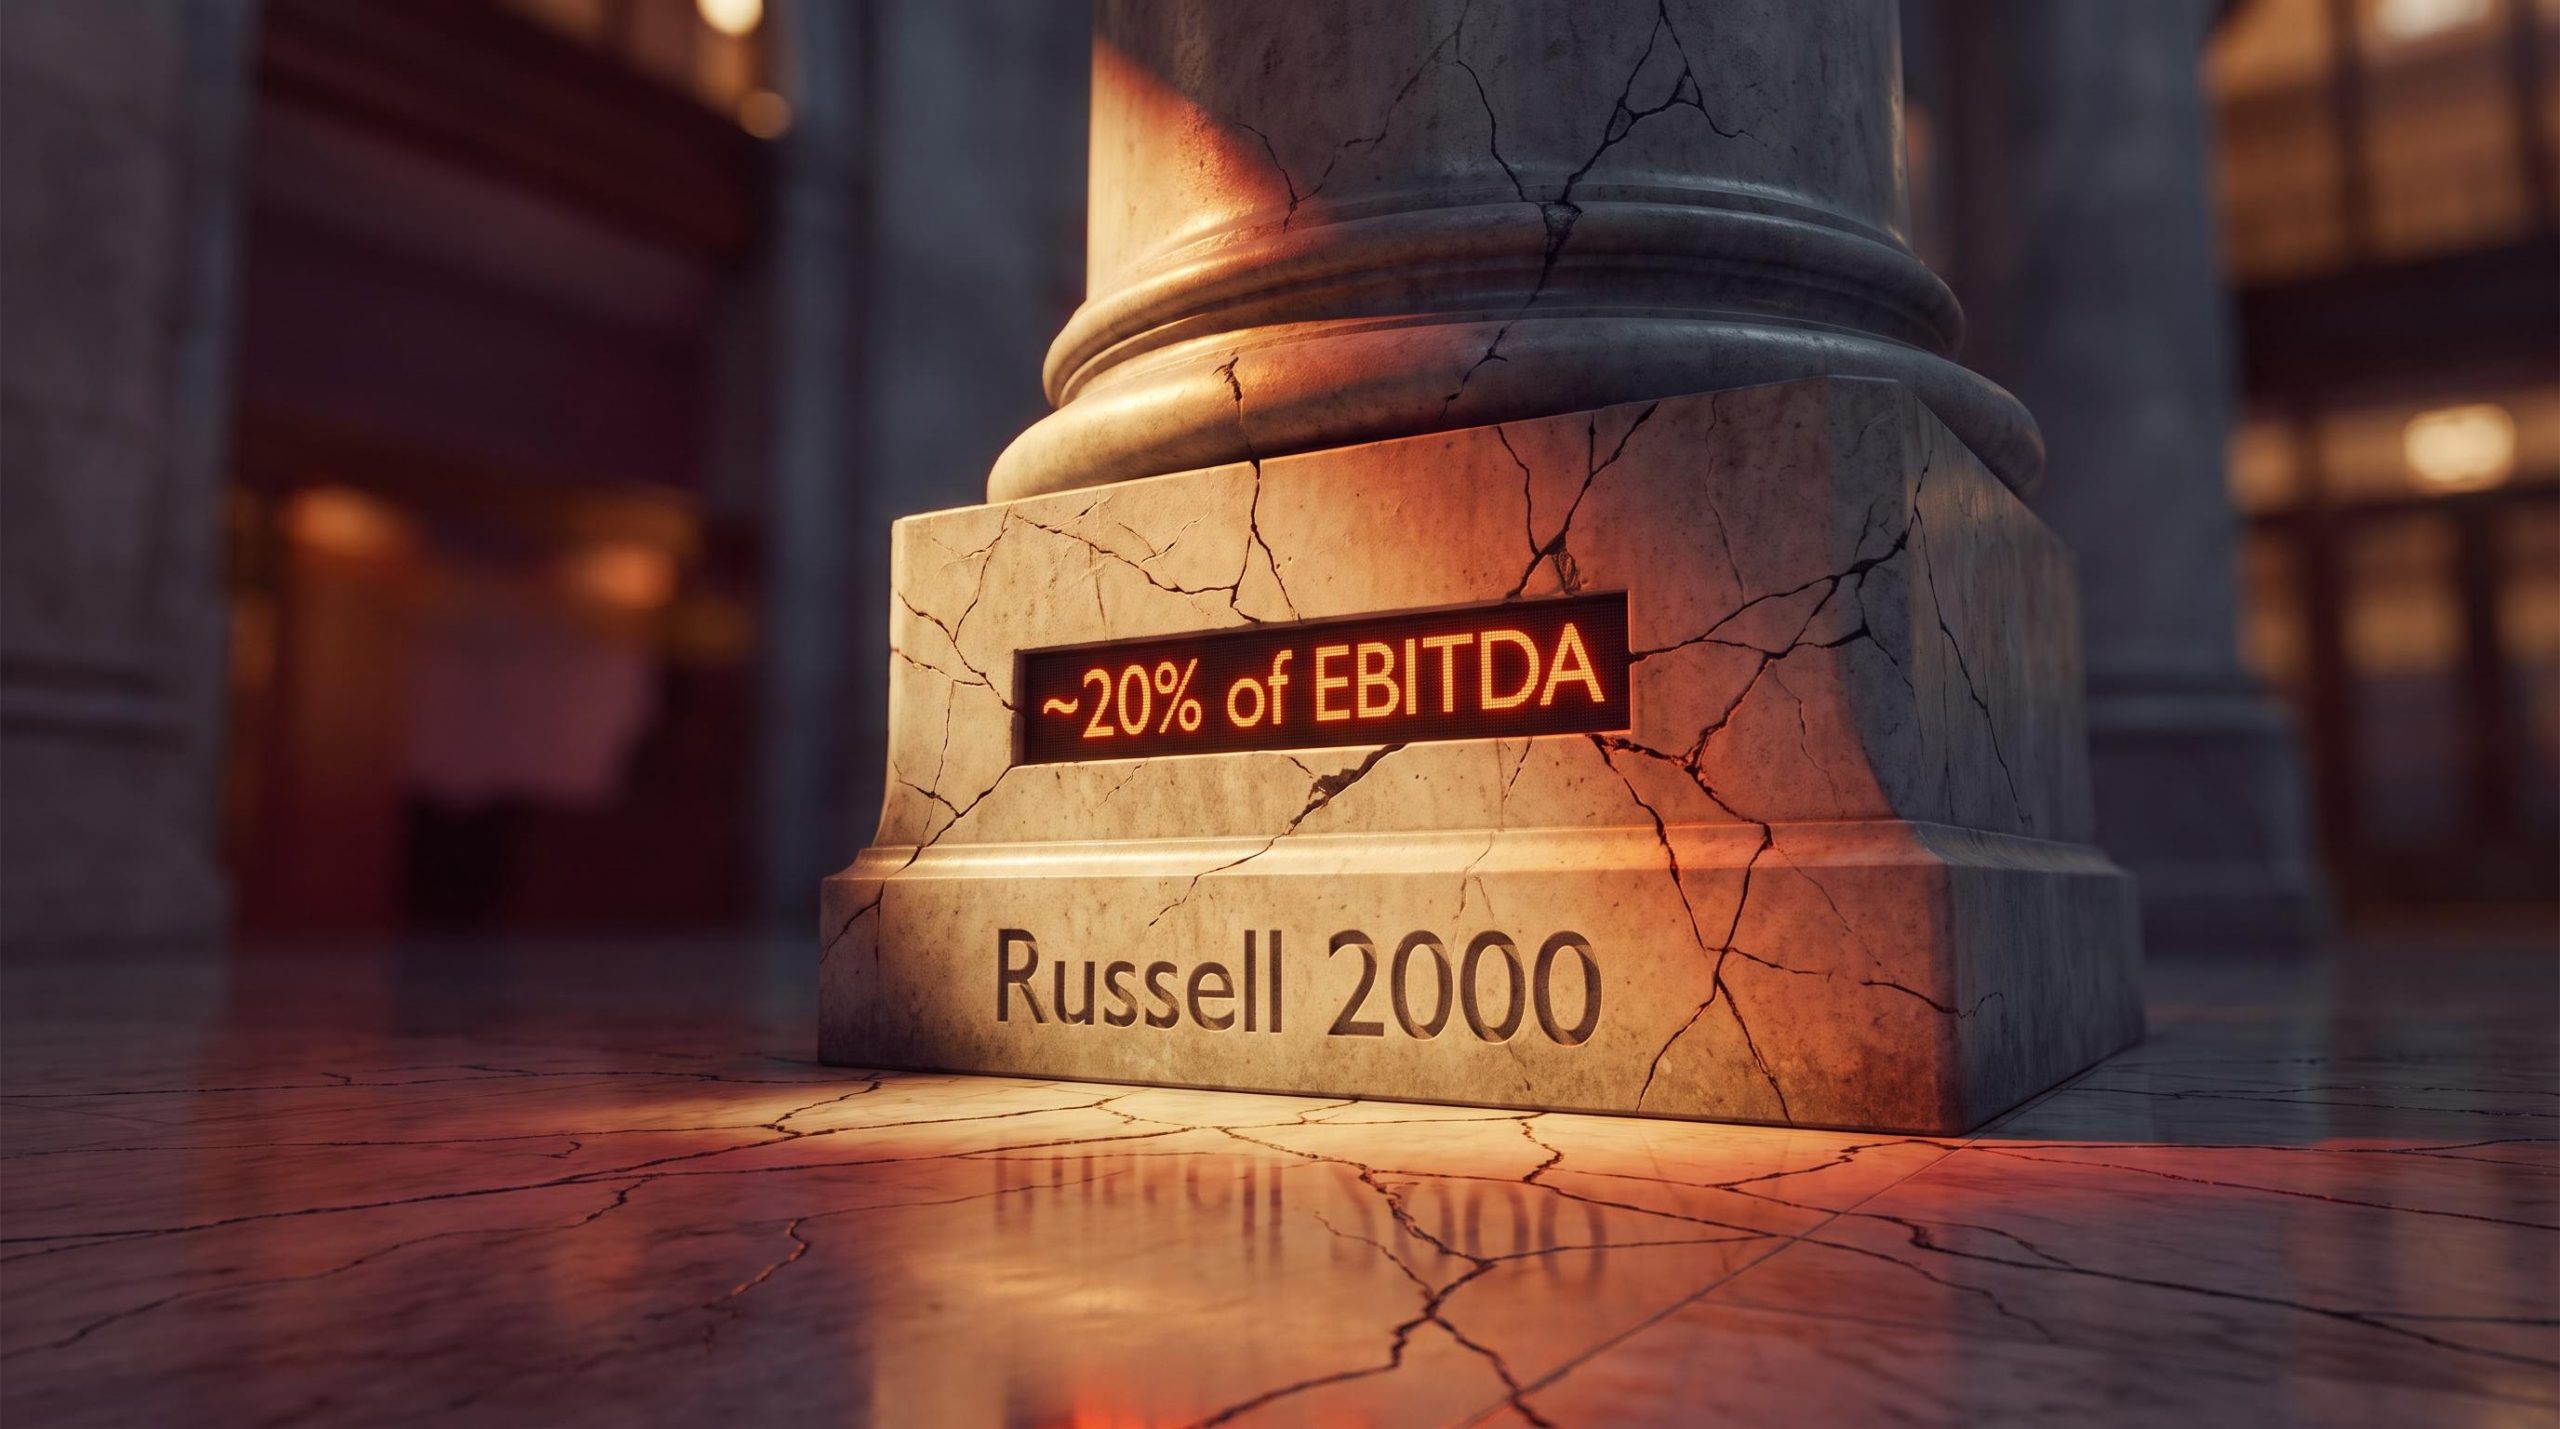
For a cohort of companies where floating-rate debt already consumes nearly 20% of EBITDA (earnings before interest, taxes, depreciation and amortisation), and where refinancing at current coupons could push that figure past 30%, it points to a structural problem the index level alone does not reveal.
Most commentary on small-cap risk fixates on the index’s beta sensitivity or its relative valuation against large caps. Far fewer analyses work through why the Russell 2000 is architecturally different from the S&P 500 in a high-rate, high-energy-cost world, and what that architecture means for the specific channels through which value erodes.
The mechanics matter because they decide whether the bearish case is a passing headwind or a sustained earnings-erosion story.
This piece works through the balance sheet vulnerabilities specific to small caps, applies the equity duration framework to explain why rate sensitivity bites harder here, examines where the options market sits relative to the risk, and lays out the structural logic behind a long put spread as a defined-risk way to express the view. After reading, you will have a framework for judging whether the macro risk is already priced in, or whether the pressures still have room to run.
The balance sheet architecture that makes small caps structurally exposed right now
Start with the number that most investors never see placed next to its counterpart. Somewhere between 30% and 38% of Russell 2000 constituent debt (excluding financials) carries a floating rate, according to recent published estimates. For the S&P 500, the equivalent figure is roughly 7%.
That gap is not a market-cycle quirk. It reflects how these two universes of companies fund themselves. Large caps tap deep bond markets and lock in long-dated fixed coupons; smaller firms lean on bank financing that reprices as rates move.
Barclays framed the same floating-rate debt exposure as a compounding risk alongside an earnings-to-price divergence and near-zero AI participation, publishing a formal hedge recommendation in August 2026 that cited the index’s 21% year-to-date gain as unsupported by any improvement in earnings revisions.
The maturity picture sharpens the point further. Small-cap fixed-rate debt tends to carry shorter average maturities, which means the refinancing wall is not a distant concern. It is arriving, and it arrives at today’s coupons rather than the low coupons these firms borrowed at a few years ago.
Now attach the rate backdrop. Following the 16 September 2026 FOMC meeting, the target range moved up 25 basis points to 3.75-4.00%, with the effective rate at 3.88% the next day. The median FOMC participant expects one more hike to close 2026 at 4.1%, and cuts are not generally projected until the 2028-2029 window.
The FOMC September 2026 projections confirm the median participant expectation of one additional hike before year-end, with rate cuts placed in the 2028-2029 window, a timeline that extends the refinancing burden grinding through small-cap income statements well beyond a single quarterly earnings cycle.
| Metric | Russell 2000 | S&P 500 |
|---|---|---|
| Floating-rate debt share (ex-financials) | 30-38% | ~7% |
| Average debt maturity profile | Shorter, nearer refinancing wall | Longer, largely termed out |
| Interest expense as % of EBITDA (current) | ~20% | Materially lower |
| Interest expense post-refinancing (projected) | Above 30% | Modest change |
Here is where the arithmetic turns into an earnings problem. Interest expense is projected to swallow nearly 20% of EBITDA across small caps this year, and estimates suggest that figure climbs past 30% once existing debt refinances into higher rates.
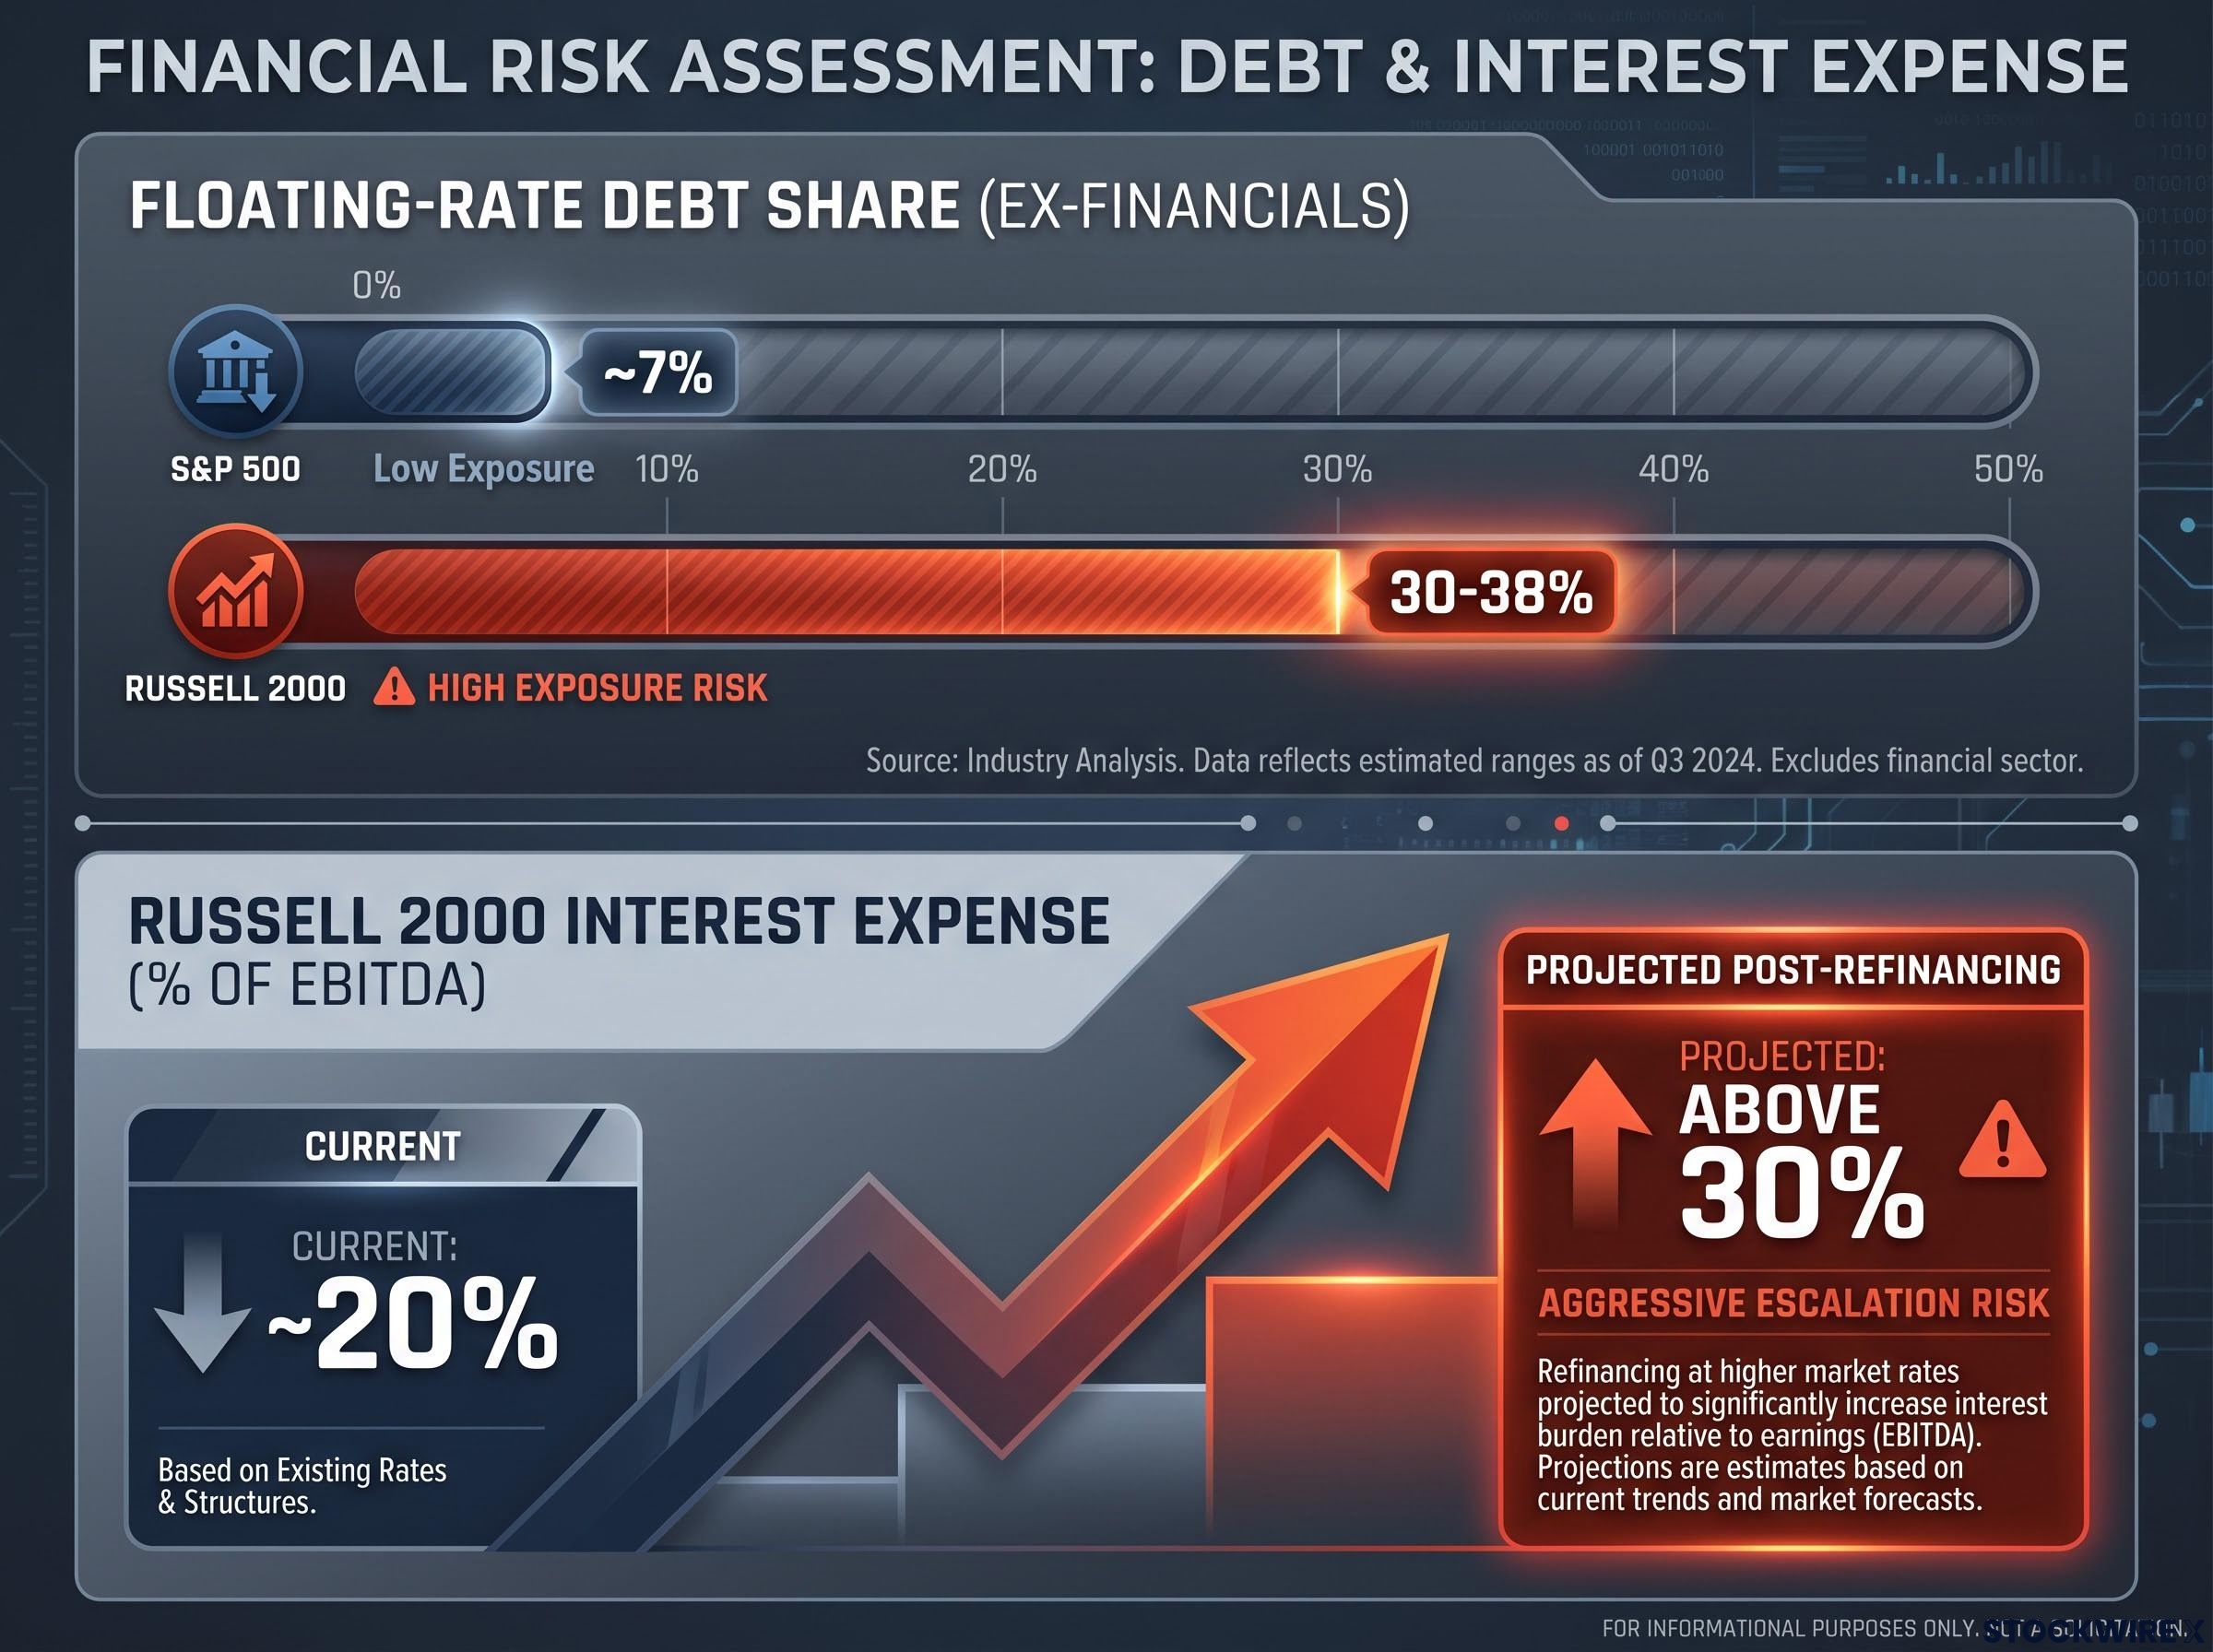
The refinancing squeeze: Small-cap interest expense could consume more than 30% of EBITDA once current debt cycles into today’s coupons, up from roughly 20% now.
What this tells you is straightforward. Every dollar routed to lenders is a dollar unavailable for reinvestment, and it also narrows access to external capital when firms need it most. A rate plateau that S&P 500 companies can absorb becomes genuinely damaging to small-cap earnings across a 12-24 month refinancing horizon. The erosion here is not a sentiment story. It is a spreadsheet story, and it is still working its way through the income statement.
When big ASX news breaks, our subscribers know first
Why equity duration explains the rate sensitivity gap between small and large caps
Think about how long it takes to get your money back from an investment. A company throwing off strong cash today returns your capital quickly. A company promising most of its value years from now takes far longer, and that waiting period is where the danger sits when rates rise.
That measure of how long recovery takes is called equity duration. It maps directly onto where a company’s cash flows land in time: current-earnings businesses are short-duration, while speculative growth firms with distant, uncertain profits are long-duration.
When interest rates climb, the present value of cash flows sitting years out gets discounted more harshly. The further out the payoff, the larger the negative swing in what that payoff is worth today.
This dynamic drew wide public attention during the 2021-2022 rate-rise cycle, when long-duration growth strategies such as Cathie Wood’s ARK Invest suffered steep drawdowns as the Fed tightened. The mechanism was not company-specific bad luck. It was duration doing what duration does.
Apply the framework to the Russell 2000 and the exposure becomes clear. Many constituents are unprofitable or heavily debt-reliant, valued primarily on the present value of expected future cash flows. That makes them exceptionally sensitive to rising discount rates and to widening risk premia, the extra return investors demand for holding riskier assets.
Nearly half of unprofitable Russell 2000 constituents reflect a structural deterioration accelerated by private capital acting as a two-sided filter: venture markets keep the best growth companies private, while buyouts remove quality names that do reach public markets.
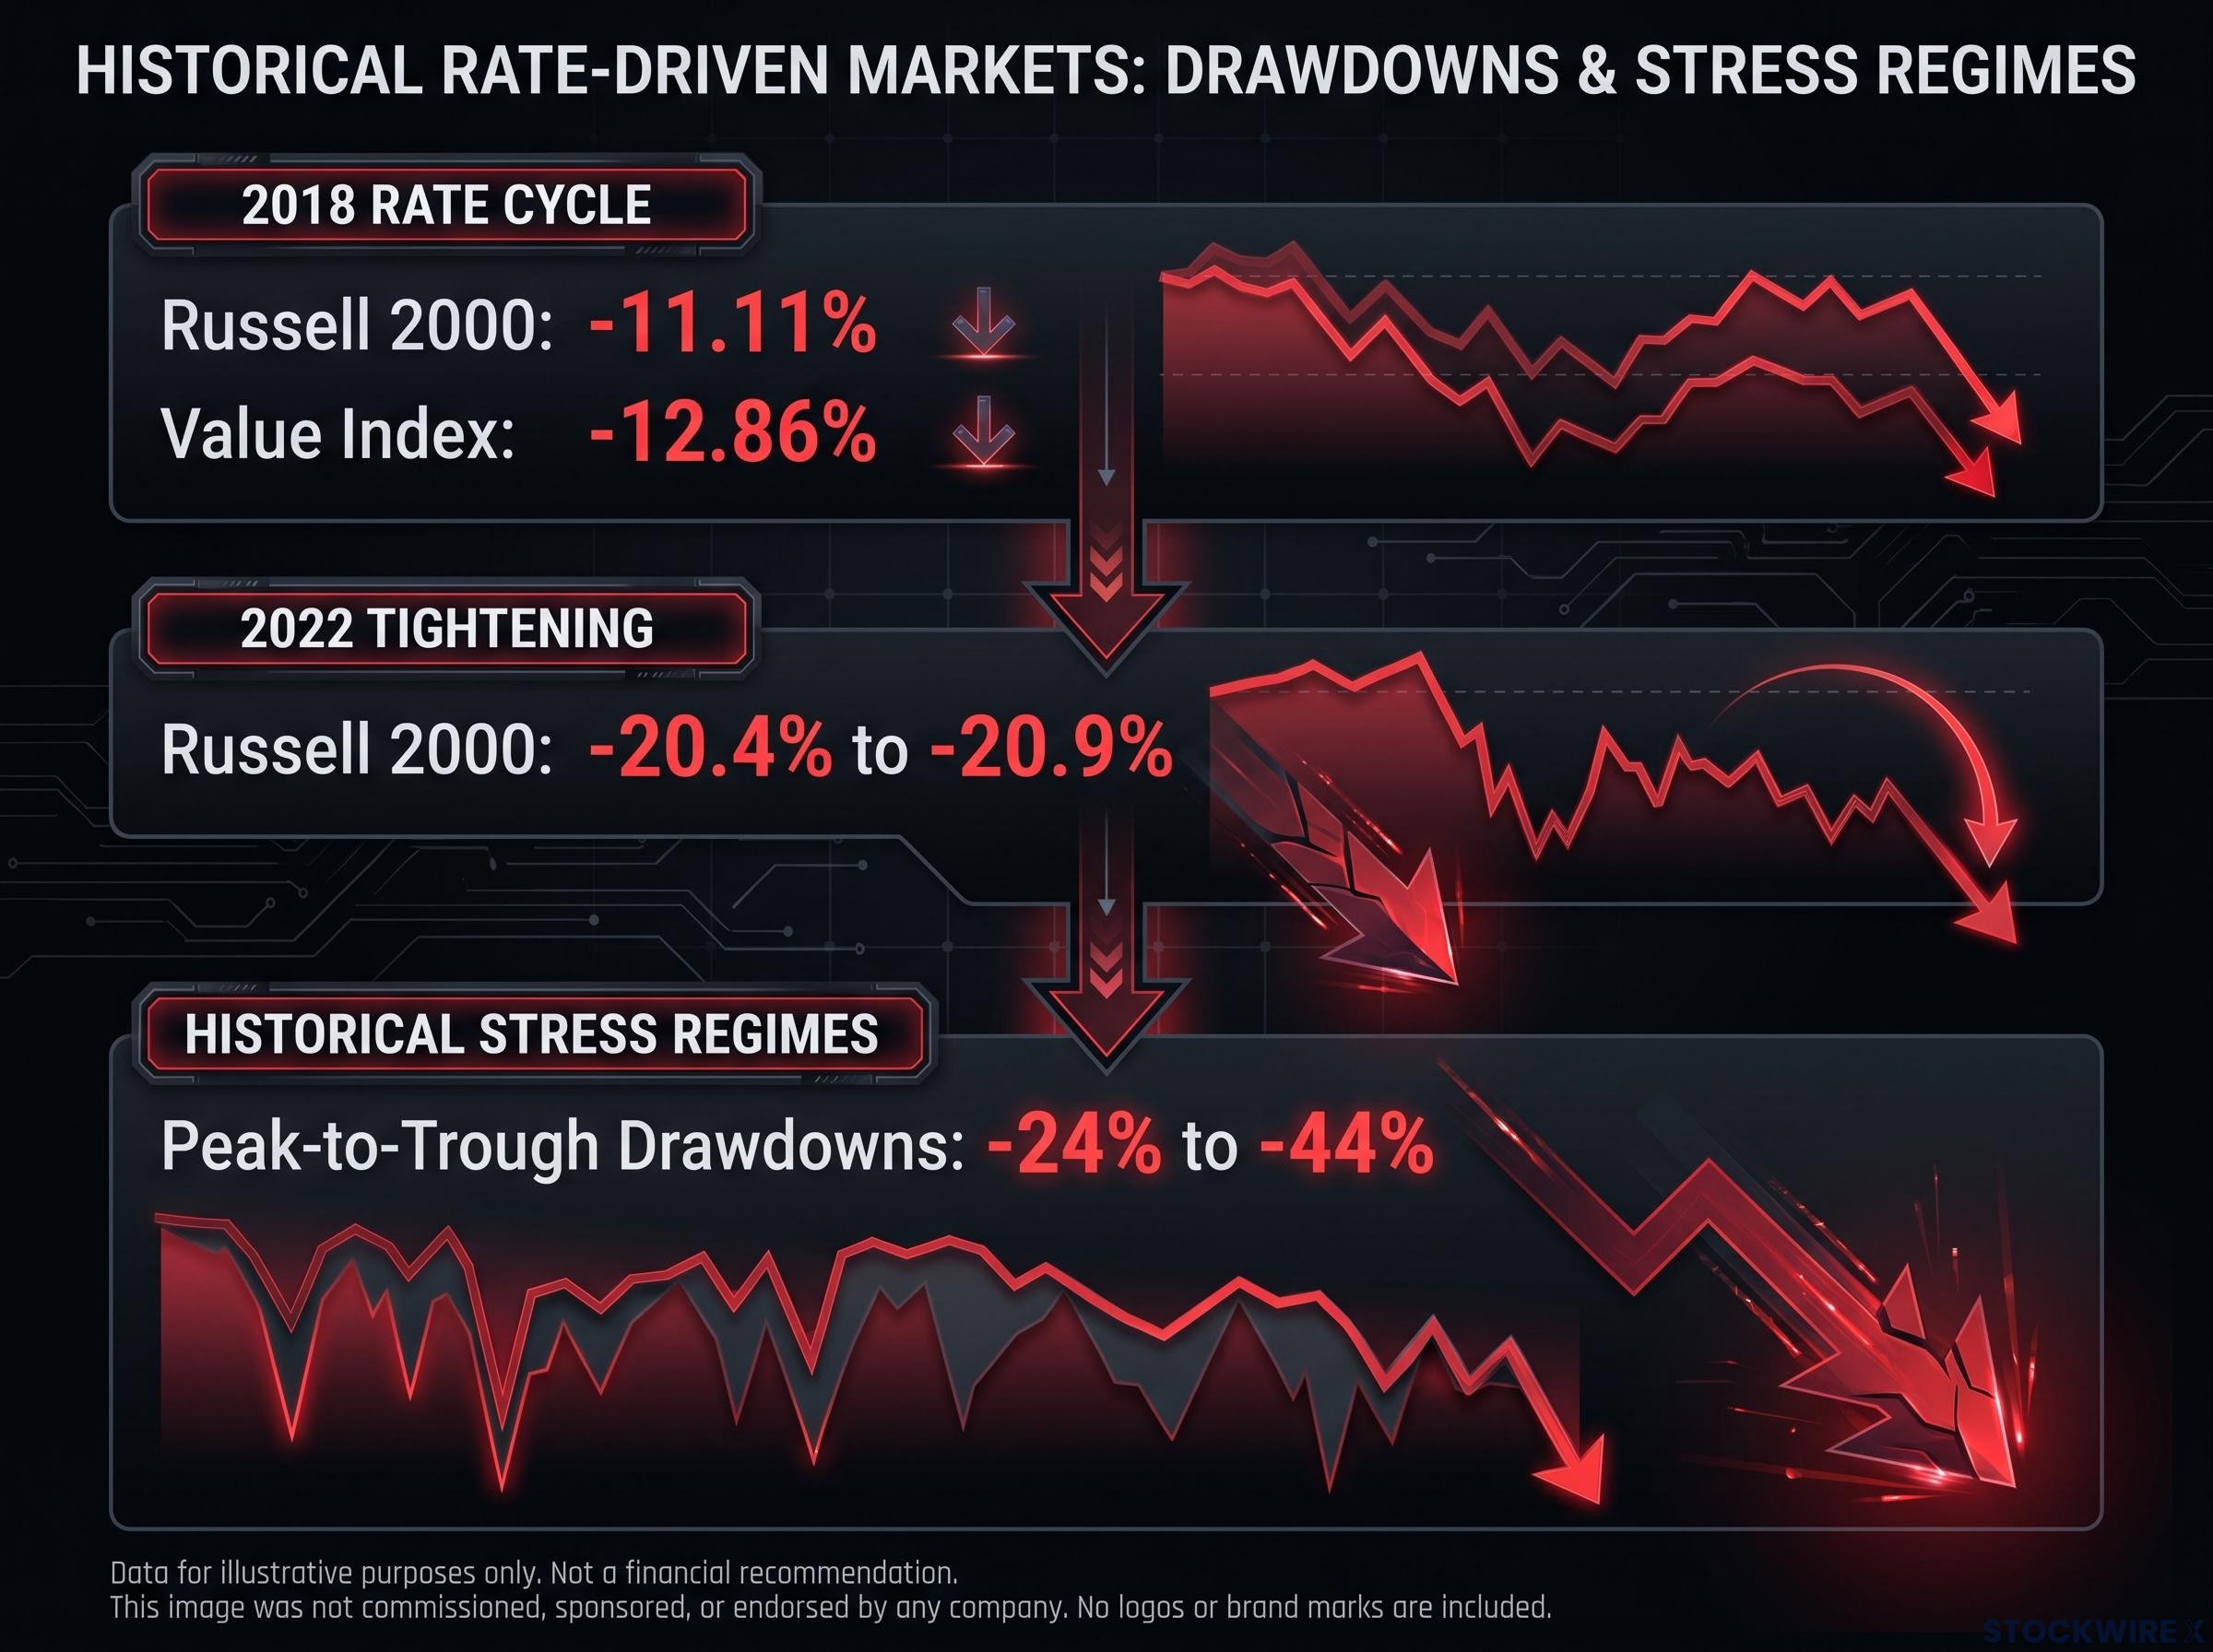
The historical record backs the theory. In 2018, amid multiple Fed hikes and a late-year risk-off move, the Russell 2000 fell roughly 11.11%, with its Value index down 12.86%. In 2022, rapid tightening drove the index to its worst first half on record and a full-year decline of around 20.4% to 20.9%. Major small-cap stress regimes have historically produced peak-to-trough drawdowns between -24% and -44%.
The energy cost channel sits on top of the rate channel
Elevated oil compounds the duration problem through a separate margin channel. Smaller domestic firms carry less pricing power and fewer hedging tools than diversified large caps, so higher energy input costs hit their margins harder and with less ability to pass them on.
Three pressures stack on Russell 2000 constituents at once:
- Floating-rate and short-maturity debt refinancing at higher coupons directly lifts interest expense.
- Energy costs compress margins for smaller firms that cannot hedge or reprice with the flexibility of global large caps.
- Rising discount rates and widening risk premia erode the valuation of businesses priced on distant cash flows.
The read here is that small-cap rate sensitivity is not a mood or a beta reading. It is a mathematical property of where cash flows sit in time, and small caps carry more of it by structural definition. That is also why the same rate level treats different companies so differently.
How options market pricing efficiency shapes strategy selection for this view
If the bearish structural case holds, the next question is how to express it. That is where an uncomfortable truth about liquid options markets comes in: they rarely hand out mispricings.
In deeply traded indexes such as the S&P 500, NASDAQ 100 and Russell 2000, market makers are well informed about upcoming catalysts. Option prices efficiently reflect the expected magnitude of a move rather than a directional bet, which means a low implied volatility reading is usually information, not error.
Practitioners test whether a specific catalyst is being isolated in pricing by studying the term structure, comparing implied volatility across pre-event and post-event expirations. If the market were singling out an event, that comparison would reveal it.
A low reading in an illiquid single-name market and a low reading in a deeply liquid index carry very different meanings:
- In a thinly traded single name, low implied volatility can genuinely signal that the market is underpricing a known catalyst.
- In a deeply liquid index, low implied volatility more often reflects efficient, well-informed pricing that should be built into strategy rather than treated as a gift.
Consider the illustration from the research of a stock tagged UAP 11, which had averaged roughly 25% moves across six prior earnings events while the options market priced in only 11% to 12%. The practitioner response was not to declare the pricing broken and buy blindly. It was to fold that observation into a specific structure, such as an out-of-the-money put spread.
Institutional hedge sizing: In regimes of subdued headline volatility but elevated crash risk, institutional portfolios often allocate 1% to 3% of NAV to rolling out-of-the-money index put spreads as a primary crash hedge.
The lesson for you is a reframe. The edge in liquid index options rarely lies in finding a cheap strike. It lies in choosing a structure that matches both your directional thesis and the volatility regime you are trading into. That is precisely why the put spread earns its place here, ahead of a naked long put.
The 2,725/2,700 put spread: structure, logic, and the risks that travel with it
Here is one documented way to express the bearish view with defined risk: a 2,725/2,700 debit put spread on the Russell 2000, typically built with E-mini futures. Buying the higher 2,725 put and selling the lower 2,700 put creates a bearish position with a hard floor on losses.
The strikes are not arbitrary. They align with a technical double-top measured-move target near 2,730, giving the structure short delta exposure without the unbounded risk of an outright short.
The arithmetic is tight and known in advance.
| Parameter | Detail |
|---|---|
| Strike bought | 2,725 put |
| Strike sold | 2,700 put |
| Net debit paid | 3.85 points ($192.50) |
| Maximum loss | $192.50 |
| Maximum profit | 21.15 points ($1,057.50) |
The structural appeal over a naked short or an outright short-premium play is defined risk. The net debit is the maximum loss, full stop. You hold short delta exposure without the tail that can bankrupt an unhedged short, and the structure suits a regime where headline volatility is calm but left-tail crash risk is elevated.
Sizing is not a footnote here. Risk frameworks advise that the worst-spot loss on any financed options structure should not exceed 0.5% to 1.0% of total portfolio value. Given crowded bearish positioning in small caps, that discipline is the central design feature that makes the trade executable, not an optional extra.
For investors wanting to apply similar defined-risk structures across different index products, our comprehensive walkthrough of put spread construction covers strike selection, credit sizing, and exit trigger rules using XSP, which scales the same mechanics to smaller account sizes.
The spread carries its own structural risks, separate from whether the macro call is right:
- Path dependency: a slow drift lower may never reach the spread’s maximum value even if direction is correct.
- Volatility collapse: a drop in implied volatility can erode the spread’s value.
- Capped upside: in a severe crash, the fixed maximum profit underperforms a naked long put.
Where the bearish thesis could break down
The most important caveat is positioning. Institutional flows show the small-cap space crowded with fresh short exposure, and that crowding turns any unwind violent, making de-grossing a first-order risk rather than a distant tail.
Three catalysts, roughly ranked by potential to trigger a squeeze, could break the trade:
- A Fed pivot or soft-landing signal would ease financing pressure quickly, and small caps have historically outperformed once a tightening cycle matures.
- Valuation mean reversion could kick in because the small-cap-to-large-cap gap has widened so far that depressed prices may already discount heavy stress.
- Resilient domestic demand, better-than-feared data, or narrowing credit spreads could spark aggressive short-covering in domestically focused names.
What the positioning data tells you is that the thesis can be directionally right and still tactically fragile. The macro can play out over months while a short squeeze inflicts real damage over days.
Small-cap allocation sizing becomes especially consequential in a crowded-short regime because portfolio architecture, not just directional conviction, determines whether a squeeze inflicts real damage or remains a managed drawdown within pre-set risk bands.
This article is for informational purposes only and should not be considered financial advice. Investors should conduct their own research and consult with financial professionals before making investment decisions. Past performance does not guarantee future results, and these statements are speculative and subject to change based on market developments.
What the data supports and where the structural argument still has room to run
Pull the three layers together and a single argument emerges. The Russell 2000’s vulnerability is structural and arithmetic, rooted in floating-rate debt, short maturities and long-duration valuations. The options market offers a defined-risk way to express that view. But the timing and magnitude of any realisation hinge on macro variables that remain genuinely unsettled.
The counter-arguments deserve real weight. Many small-cap value businesses fixed debt at low rates and extended maturities pre-emptively, blunting their current exposure. Elevated rates have not consistently produced small-cap underperformance across every historical cycle, and severe drawdowns have usually required a broader macro shock, a recession or a crisis, rather than high rates alone. Depressed valuations may already discount a good deal of the stress.
What tilts the structural case is duration. The median FOMC projection places rate cuts in the 2028-2029 window, which means the refinancing burden grinding through small-cap income statements is an extended condition, not a brief squeeze.
The FOMC Summary of Economic Projections released alongside the September meeting places the median federal funds rate at 4.1% by end-2026, with no cuts projected until the 2028-2029 window, a duration of elevated rates that is the central variable determining how much refinancing damage flows through small-cap income statements.
Oil adds a second live variable. WTI sits near $99.53, carrying a geopolitical war premium, against a near-term scenario range spanning an $80 bear case and a $115 bull case.
To keep the thesis honest as conditions evolve, watch three inputs:
- The Fed rate trajectory: the timing and pace of eventual cuts.
- WTI crude persistence above or below $90, which governs the margin-compression channel.
- Investment-grade and high-yield credit spread direction, the clearest leading signal of refinancing stress.
The structural argument stays intact even where near-term price action does not cooperate. Your task is to manage the position around volatility and squeeze risk while the slower-moving arithmetic does its work.