Nearly $1 trillion in a single year. That is what UBS expects the world to spend on artificial intelligence infrastructure in 2026, and the number sits at the centre of a question that will shape returns for the next several years. Is this the most consequential structural investment cycle in a generation, or the largest coordinated overbuilding exercise technology has ever attempted?
UBS has planted its flag firmly on the first interpretation. Its institutional view remains constructive on global equities, and it held that line through a genuinely uncomfortable September.
September brought real volatility. Elevated oil prices collided with a hawkish repricing of Federal Reserve policy, and markets wobbled. UBS did not blink.
This is a working model of the institutional logic behind the current constructive global equities outlook: what the thesis actually rests on beneath the headline positivity, where the data conflicts, and where serious dissent lives. After reading, you should be able to judge whether that logic applies to your own positioning, or whether the risks warrant a different stance.
Why UBS stayed bullish when September’s volatility hit
September was a stress test, and it is worth watching how UBS’s framework absorbed the shock. The disruption was real but specific: oil prices climbed and the market repriced Fed policy toward a more hawkish path. Neither of those is a deterioration in the thing that actually drives equity returns over time, which is corporate earnings and economic growth.
That distinction is the whole point. UBS looked through the turbulence because the structural supports underneath its view stayed intact.
According to UBS, three macro conditions held firm through the wobble:
- Expansionary fiscal stances across most major economies
- A recovery in manufacturing activity
- Accelerating loan growth
Together those signals told UBS the underlying economy was still expanding, which meant the September sell-off was about sentiment and rate expectations rather than fundamentals.
The quantitative anchor for the whole thesis is a specific number.
UBS sees roughly 10% upside for the MSCI All Country World Index (ACWI) through mid-2027, driven primarily by earnings growth rather than by valuations expanding further.
That said, the earnings picture carries genuine uncertainty, and it is worth surfacing rather than smoothing over. The original UBS material projected earnings growth of 26% for 2026 and 14% for 2027. UBS CIO figures from September 2026 came in lower, at 21% for 2026 and 12% for 2027. The honest read is a range, not a single clean figure, and even the lower end represents strong expected growth.
The interest rate story is similarly unresolved. Some UBS material references a modest tightening cycle ahead, with the bank’s view that equity markets tend to hold up well through rate rises provided the cycle does not become sharply steep the way it did in 2022. Other institutional research points to Fed rate cuts providing the cyclical tailwind. This is a live interpretive question, not a settled one.
The Bank of England September 2026 monetary policy minutes illustrate the broader central bank dilemma that UBS’s rate thesis is navigating: policymakers across major economies are balancing sticky inflation against growth concerns, and the path they choose will reprice the cyclical backdrop for global equities.
Not everyone agrees with holding the line. Morgan Stanley downgraded global equities to equal weight in March 2026 amid geopolitical uncertainty, a useful counterweight to UBS’s maintained conviction.
The persistence of UBS’s stance through a rough September tells you something practical: this thesis is anchored to structural factors, not to whether markets feel calm. That means it holds or breaks on whether those factors stay intact, which is also the test you can apply to your own decision to sit through volatility.
When big ASX news breaks, our subscribers know first
What the AI capex cycle actually means for equity investors
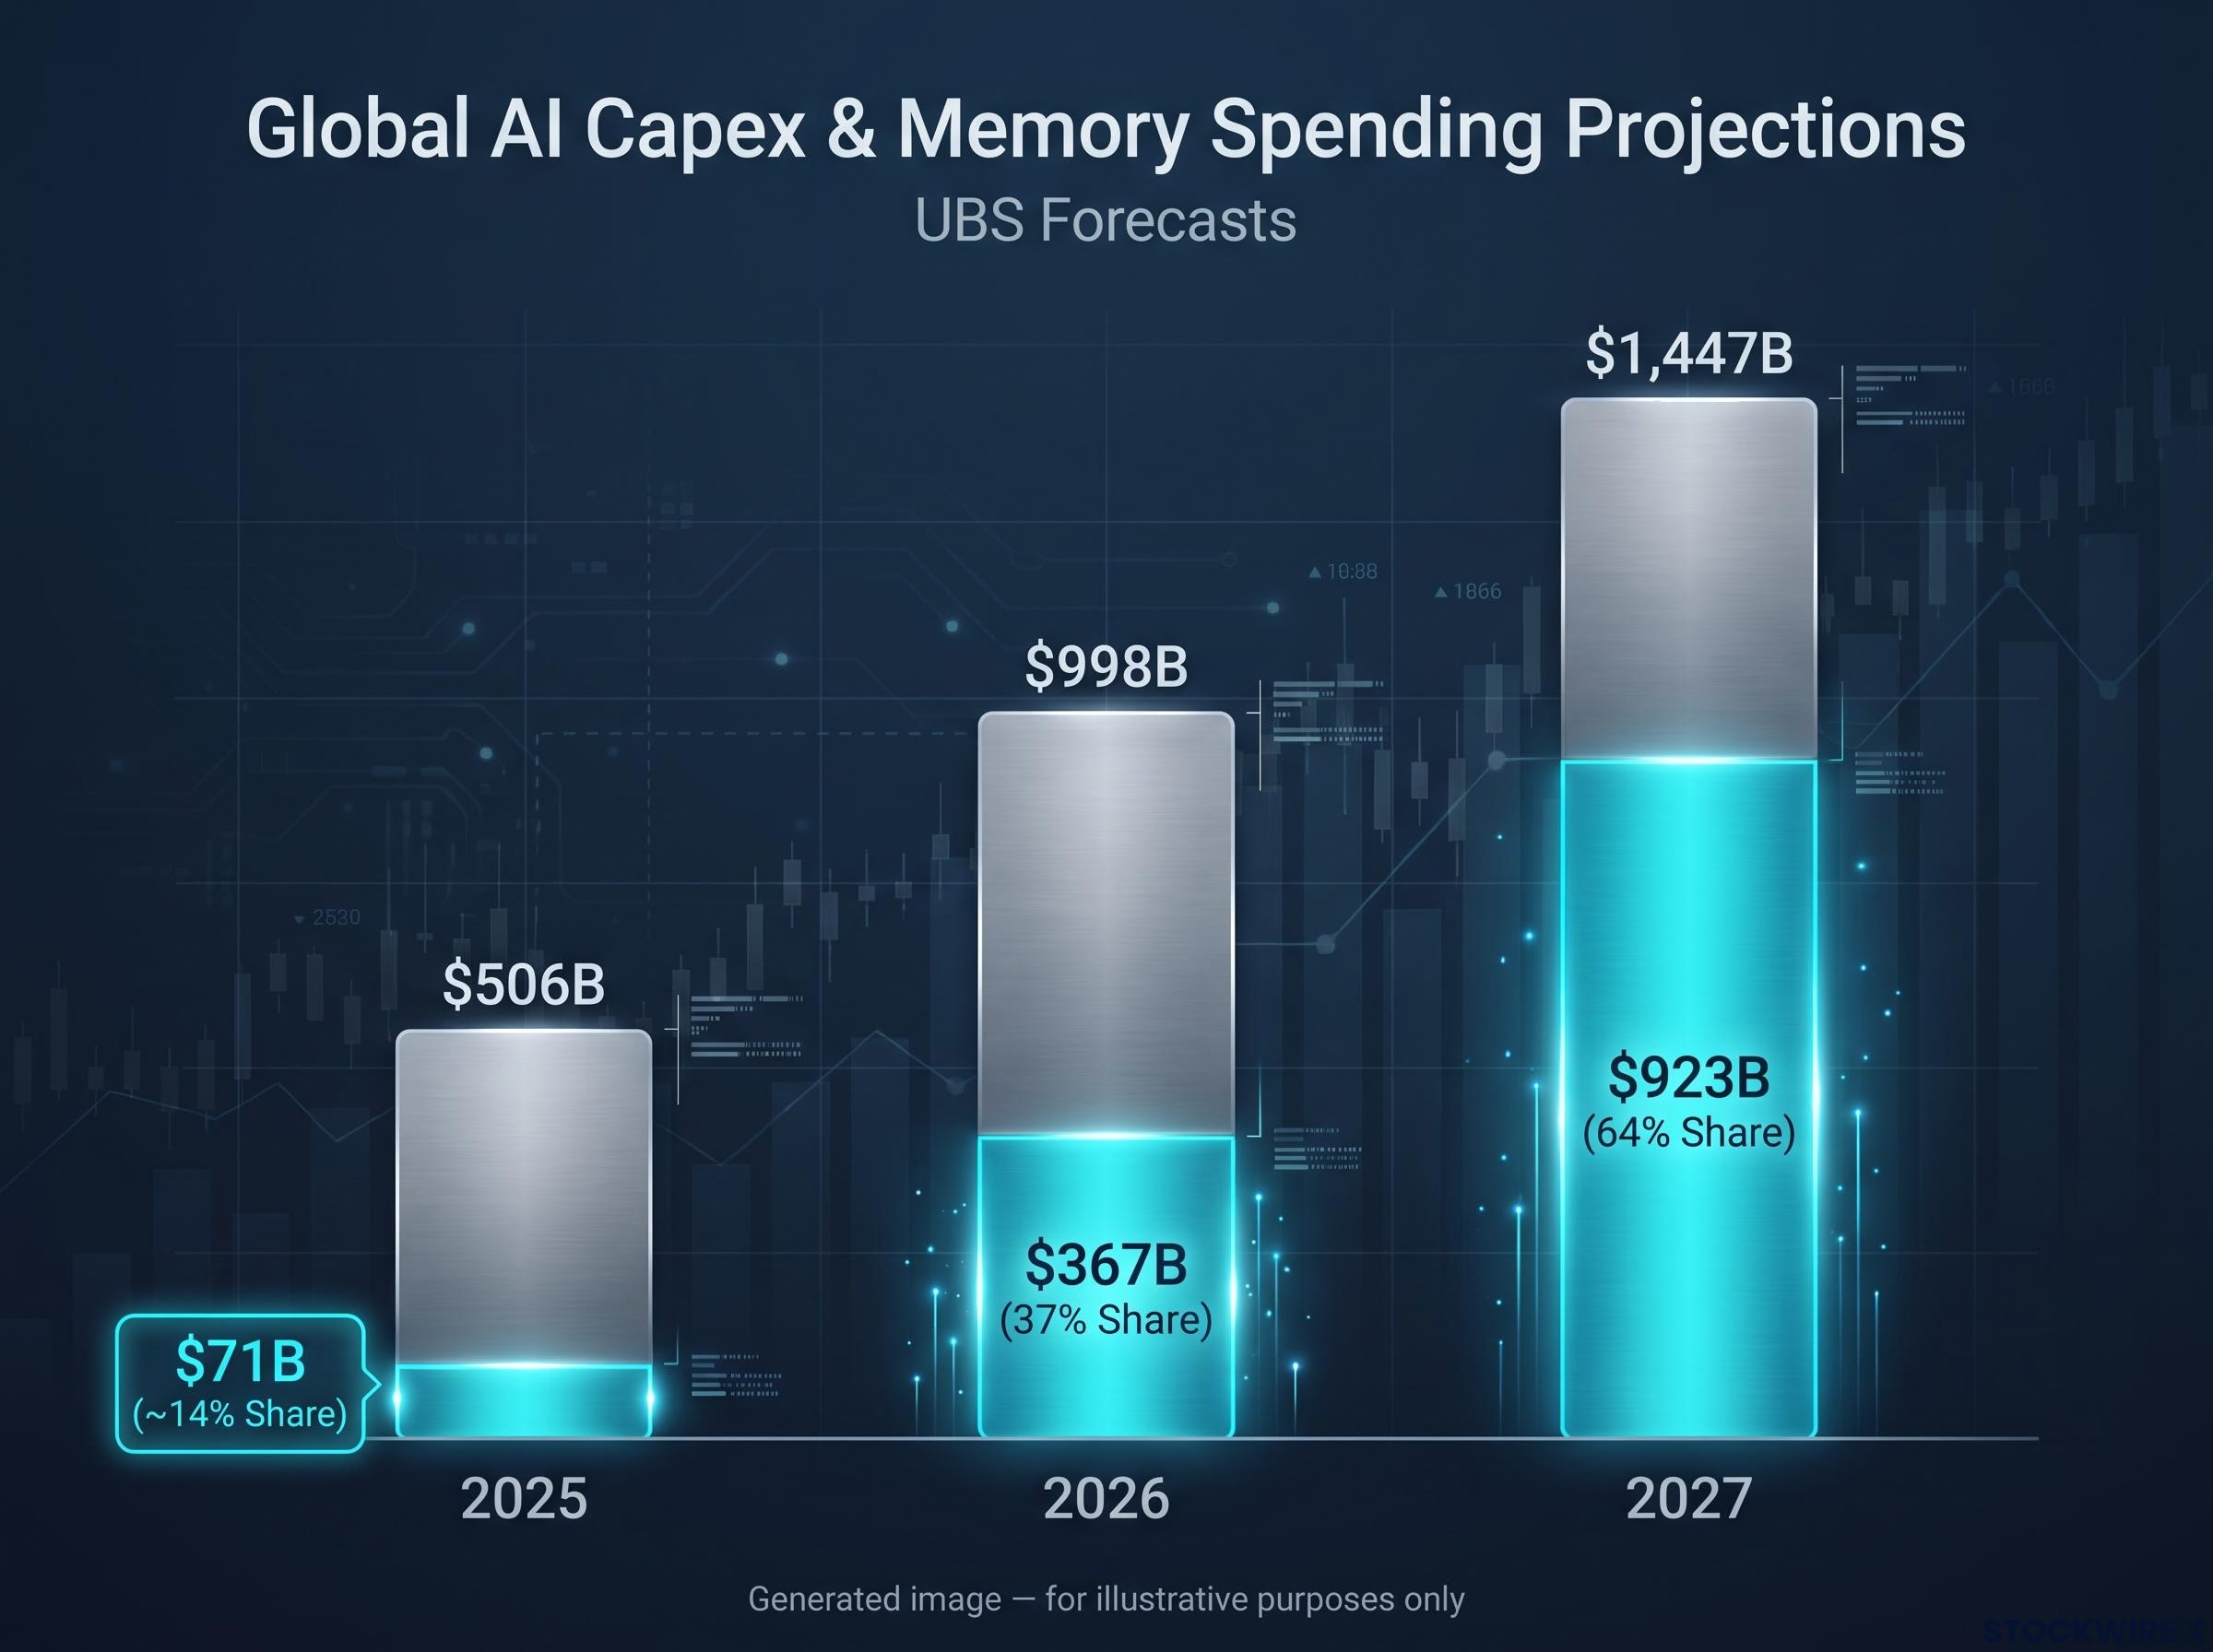
The numbers here are large enough to require a second look. UBS projects global AI capital expenditure will reach $998 billion in 2026, nearly double the $506 billion spent in 2025, then climb to about $1.447 trillion in 2027. UBS expects that spending to compound at roughly 25% annually through 2030, which is what turns a spike into a multi-year cycle.
US IT spending reaching a record 4.9% of GDP in Q1 2026 places the current AI buildout above prior technology investment peaks including the dot-com era at approximately 4.2% and the cloud buildout at approximately 3.8%, providing a historical scaling reference that helps calibrate whether the spending levels UBS projects are unprecedented or within the range of cycles markets have absorbed before.
Gartner’s worldwide AI spending forecast, published in September 2026, provides an independent cross-check on the scale of investment UBS projects, and its sector-level breakdowns help identify where within the broader AI infrastructure build-out the incremental capital is actually flowing.
In the original UBS framing, that translates to AI-related capex rising approximately 84% this year, followed by a further 33% increase in 2027.
Scale on its own does not put money in your pocket. What matters is where inside that spend the growth is concentrated, and the answer is less obvious than the Nvidia headlines suggest.
The underreported story is memory. UBS projects global memory spending to rise from $71 billion in 2025 to $367 billion in 2026 and up to $923 billion in 2027. Memory’s share of total AI capex is forecast to hit 37% in 2026 and 64% in 2027. Roughly 90% of the incremental growth in AI capex between 2025 and 2027 is driven specifically by rising memory prices.
| Year | Total AI Capex | Memory Spending | Memory Share |
|---|---|---|---|
| 2025 | $506B | $71B | ~14% |
| 2026 | $998B | $367B | 37% |
| 2027 | $1,447B | $923B | 64% |
Here is what the memory data tells you. The sharpest part of the growth curve may not sit with the chip designers everyone already watches, but with the component and materials suppliers exposed to memory price appreciation. That is where the incremental spend is actually going.
Bernstein’s August 2026 research identifies the memory wall as the structural condition redirecting AI infrastructure spending toward memory rather than logic semiconductors, with conventional DRAM generating more than twice the revenue per wafer compared with HBM, making the broader memory complex the financial centre of gravity for the cycle.
The monetisation gap: returns believers vs. overinvestment sceptics
The genuine tension is not optimism versus pessimism. It is a disagreement about whether the spending is being turned into profit fast enough, and both camps have real data behind them.
The believers point to evidence that the money is working. BlackRock notes recent earnings delivered clear signs that AI capex is translating into returns, with infrastructure names showing strong fundamentals. JPMorgan observes that after years of heavy data-centre spending, providers still face capacity shortages, hardly the signature of overbuilding. Expanding margins at the major cloud platforms support the case that this spend can be profitably monetised.
The sceptics point at the gap between what is being spent and what is coming back.
Analysis from Bain and AllianceBernstein notes roughly $400 billion in 2025 data-centre capex against estimated AI monetisation of only $50-150 billion, implying a large revenue gap that has to close to justify multi-trillion-dollar investment.
Add rapid hardware obsolescence, power availability limits, and supply-chain bottlenecks, and the sceptics have a coherent structural worry rather than mere caution.

The signal to watch is straightforward: whether hyperscaler margins keep expanding in the next round of earnings reports. If they do, the believers gain ground. If they flatten, the revenue-gap argument gets louder.
Which regions and sectors UBS actually favours, and why
The macro thesis only becomes useful when it turns into positions you can measure against your own holdings. UBS treats its constructive view as favourable across U.S., European, and Asian markets, but it is not neutral within that.
Its relative tilts point toward specific geographies:
- The eurozone
- Asia excluding Japan
- Emerging markets
The sector mix looks eclectic until you see the logic. UBS holds cyclical positions, consumer discretionary and banking, alongside more structural ones in industrials and health care, then layers thematic allocations on top. Holding both cyclicals and defensives at once is a deliberate hedge: cyclicals capture the growth if the expansion continues, while structural names provide ballast if it does not.
| Sector / Theme | Strategic Logic |
|---|---|
| Consumer discretionary, banking | Cyclical exposure to capture continued economic expansion |
| Industrials, health care | Structural positions providing stability across the cycle |
| Artificial intelligence | Direct exposure to the multi-year capex cycle |
| Energy and natural resources | Thematic hedge against inflation and supply pressures |
| Longevity industries | Long-horizon demographic growth theme |
The selectivity makes more sense once you read it against valuations. The MSCI ACWI forward price-to-earnings ratio, a measure of how much investors pay per dollar of expected earnings, sat at approximately 16.9x in late August and September 2026, above historical averages. The IMF estimates global stocks are around 10% overvalued.
The AI trade rotation away from semiconductors is already visible in the data: semiconductors now account for only about 25% of total AI infrastructure spending, with capital flowing toward energy infrastructure, high-bandwidth memory, and enterprise software where the structural bottlenecks now sit, a shift that reframes which sectors carry the incremental opportunity UBS’s capex projections imply.
There is a genuine conflict in the source material worth flagging. The original UBS view described valuations as having normalised toward their 10-year average, while later research characterises them as stretched. Both readings are on the table.
Either way, BlackRock’s overweight on U.S. equities aligns broadly with UBS’s constructive stance, while RBC noted in March 2026 that geopolitical uncertainty is keeping forward multiples under pressure.
The combination of stretched valuations and pointed regional tilts tells you this is not a passive buy-the-index thesis. The upside UBS expects depends on being in the right places, which means a reader with concentrated home-market exposure can read these preferences as a map of where diversification might strengthen the position heading into 2027.
The risks that could break the thesis
Three sections of the bullish case deserve a counterweight, and these are mechanisms rather than boilerplate disclaimers. Four risk vectors carry the most institutional weight, in rough order of consensus concern:
- Valuation correction: With the IMF calling global equities around 10% overvalued, stretched prices amplify the downside if bond yields back up more than expected or inflation stays sticky.
- Geopolitical escalation: Major geopolitical events can trigger sharp declines, raise sovereign risk premiums, and compress forward P/E multiples, which is exactly why Morgan Stanley downgraded global equities to equal weight in March 2026.
- Debt and currency vulnerabilities: Rising sovereign debt burdens can interact with currency mismatches to amplify disorderly declines, a risk the IMF flags most acutely for emerging markets.
- AI concentration and overbuilding: A handful of megacap AI winners now dominate index performance, and power limits, supply-chain bottlenecks and rapid hardware obsolescence sharpen the concentration risk for suppliers if sentiment reverses.
Worth noting: UBS’s own view already acknowledges these risks implicitly through its regional tilts and sector selectivity. This is not naive optimism. The bank is hedging within its constructive stance, which is a different thing from ignoring the downside. RBC’s observation that geopolitical uncertainty keeps multiples under pressure despite reasonable earnings sits comfortably alongside UBS’s positioning.
The most actionable warning comes from BlackRock.
BlackRock cautions that a small group of megacap AI winners dominate index performance and urges diversification to mitigate drawdown risk if sentiment reverses.
Here is why that one matters to you specifically. If five or six AI-dominant names correct sharply, broad index funds will feel it more than most investors expect. Passive exposure is not neutral exposure in a concentrated market, and understanding each mechanism lets you stress-test your own portfolio against the scenarios that would actually invalidate the thesis.
Reading UBS’s thesis as a framework, not a forecast
The real value of a major institutional outlook is not knowing whether UBS turns out to be right. It is having a structure for your own thinking about which factors matter and which signals to track.
UBS’s constructive case rests on three interdependent pillars. Structural earnings growth provides the fuel. The AI capex cycle provides the multi-year structural driver. Selective regional and sector positioning is how the upside actually gets captured. Remove any one and the case weakens: earnings without the capex cycle is just an ordinary market, and the capex cycle without selectivity runs straight into stretched valuations.
The quantitative anchor stays the same, roughly 10% upside on the MSCI ACWI through mid-2027. Even that carries a wide band, with UBS’s own earnings projections ranging from 21% to 26% for 2026, a reminder that institutional models are estimates, not certainties.
Three signals will confirm or challenge the thesis over the next 6-12 months:
- Hyperscaler margin trends: Continued expansion supports the monetisation case; flattening margins strengthen the overinvestment argument.
- Memory pricing trajectory: Sustained price appreciation validates the component-supplier opportunity; a reversal undercuts the sharpest part of the capex growth.
- The Fed’s actual path versus expectations: A meaningful gap in either direction reprices the whole cyclical backdrop.
The 25% annual AI capex compounding UBS projects through 2030 is the signal that survives short-term noise. Even if 2026 proves bumpy, that makes the AI-exposed case a multi-year thesis rather than a 12-month trade, which should change how much weight you give to near-term volatility.
For readers wanting to track the hyperscaler margin signal UBS identifies as the key confirming data point, our full explainer on earnings season as a macro indicator covers how corporate results deliver real-time signals on credit conditions, consumer health, and sector-level margin trends weeks before official GDP data is published.
This article is for informational purposes only and should not be considered financial advice. Investors should conduct their own research and consult with financial professionals before making investment decisions. Past performance does not guarantee future results, and financial projections are subject to market conditions and various risk factors. Forward-looking statements are speculative and subject to change based on market developments.